Fe-C Binary Phase Diagram
•
1 like•1,430 views

Homework IV - Biomaterials Science Generally, a phase diagram is a chart used to show conditions (temperature, pressure...) at which different thermodynamic states occur. Where each line represents the transitions between states. IST - 4th Year - 2nd Semester - Biomedical Engineering.

Recommended
More Related Content
What's hot
What's hot (20)
Similar to Fe-C Binary Phase Diagram
Similar to Fe-C Binary Phase Diagram (20)
More from Luís Rita
More from Luís Rita (20)
Recently uploaded
Recently uploaded (20)
Fe-C Binary Phase Diagram
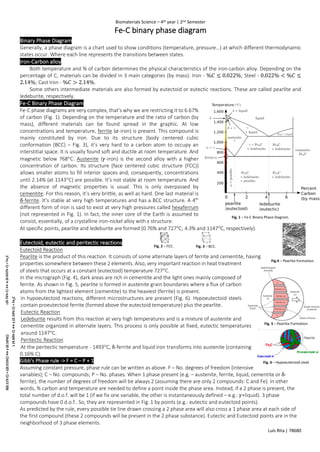
- 1. Biomaterials Science – 4th year | 2nd Semester Luís Rita | 78680 Fe-C binary phase diagram Binary Phase Diagram Generally, a phase diagram is a chart used to show conditions (temperature, pressure…) at which different thermodynamic states occur. Where each line represents the transitions between states. Iron-Carbon alloy Both temperature and % of carbon determines the physical characteristics of the iron-carbon alloy. Depending on the percentage of C, materials can be divided in 3 main categories (by mass): Iron - %𝐶 ≤ 0.022%; Steel - 0.022% < %𝐶 ≤ 2.14%; Cast Iron - %𝐶 > 2.14%. Some others intermediate materials are also formed by eutectoid or eutectic reactions. These are called pearlite and ledeburite, respectively. Fe-C Binary Phase Diagram Fe-C phase diagrams are very complex, that’s why we are restricting it to 6.67% of carbon (Fig. 1). Depending on the temperature and the ratio of carbon (by mass), different materials can be found spread in the graphic. At low concentrations and temperature, ferrite (𝛼-iron) is present. This compound is mainly constituted by iron. Due to its structure (body centered cubic conformation (BCC) – Fig. 3), it’s very hard to a carbon atom to occupy an interstitial space. It is usually found soft and ductile at room temperature. And magnetic below 768°C. Austenite (𝛾-iron) is the second alloy with a higher concentration of carbon. Its structure (face centered cubic structure (FCC)) allows smaller atoms to fill interior spaces and, consequently, concentrations until 2.14% (at 1143°C) are possible. It’s not stable at room temperature. And the absence of magnetic properties is usual. This is only overpassed by cementite. For this reason, it’s very brittle, as well as hard. One last material is δ-ferrite. It’s stable at very high temperatures and has a BCC structure. A 4th different form of iron is said to exist at very high pressures called hexaferrum (not represented in Fig. 1). In fact, the inner core of the Earth is assumed to consist, essentially, of a crystalline iron-nickel alloy with ε structure. At specific points, pearlite and ledeburite are formed (0.76% and 727°C; 4.3% and 1147°C, respectively). Eutectoid, eutectic and peritectic reactions Eutectoid Reaction Pearlite is the product of this reaction. It consists of some alternate layers of ferrite and cementite, having properties somewhere between these 2 elements. Also, very important reaction in heat treatment of steels that occurs at a constant (eutectoid) temperature 727°C. In the micrograph (Fig. 4), dark areas are rich in cementite and the light ones mainly composed of ferrite. As shown in Fig. 5, pearlite is formed in austenite grain boundaries where a flux of carbon atoms from the lightest element (cementite) to the heaviest (ferrite) is present. In hypoeutectoid reactions, different microstructures are present (Fig. 6). Hypoeutectoid steels contain proeutectoid ferrite (formed above the eutectoid temperature) plus the pearlite. Eutectic Reaction Ledeburite results from this reaction at very high temperatures and is a mixture of austenite and cementite organized in alternate layers. This process is only possible at fixed, eutectic temperatures around 1147°C. Peritectic Reaction At the peritectic temperature - 1493°C, δ-ferrite and liquid iron transforms into austenite (containing 0.16% C). Gibb’s Phase rule -> F = C – P + 1 Assuming constant pressure, phase rule can be written as above. F – No. degrees of freedom (intensive variables); C – No. compounds; P – No. phases. When 1 phase present (e.g. – austenite, ferrite, liquid, cementite or δ- ferrite), the number of degrees of freedom will be always 2 (assuming there are only 2 compounds: C and Fe). In other words, % carbon and temperature are needed to define a point inside the phase area. Instead, if a 2 phase is present, the total number of d.o.f. will be 1 (if we fix one variable, the other is instantaneously defined – e.g.: 𝛾+liquid). 3 phase compounds have 0 d.o.f.. So, they are represented in Fig. 1 by points (e.g.: eutectic and eutectoid points). As predicted by the rule, every possible tie line drawn crossing a 2 phase area will also cross a 1 phase area at each side of the first compound (these 2 compounds will be present in the 2 phase substance). Eutectic and Eutectoid points are in the neighborhood of 3 phase elements. Fig. 1 – Fe-C Binary Phase Diagram. Fig. 5 – Pearlite Formation. Fig. 6 – Hypoeutectoid steel. Fig. 2 – FCC. Fig. 3 – BCC. Fig.4 – Pearlite Formation.