Insight driven infographic
•
1 like•480 views

Improve sales performance with real-time analytics.
Recommended

Recommended
More Related Content
More from Laurent Pacalin
More from Laurent Pacalin (20)
Recently uploaded
Recently uploaded (20)
Insight driven infographic
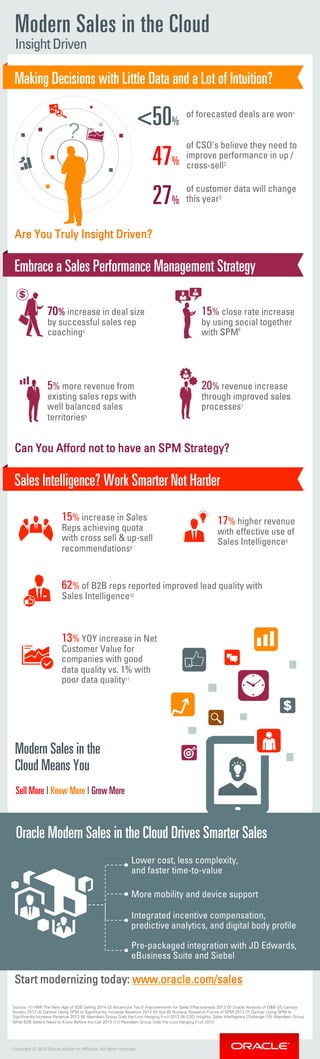
- 1. jçÇÉêå=p~äÉë=áå=íÜÉ=`äçìÇ= YRMB= QTB= of CSO’s believe they need to improve performance in up / cross-sell2 70% increase in deal size by successful sales rep coaching4 5% more revenue from existing sales reps with well balanced sales territories5 j~âáåÖ=aÉÅáëáçåë=ïáíÜ=iáííäÉ=a~í~=~åÇ=~=içí=çÑ=fåíìáíáçå= bãÄê~ÅÉ=~=p~äÉë=mÉêÑçêã~åÅÉ=j~å~ÖÉãÉåí=píê~íÉÖó= p~äÉë=fåíÉääáÖÉåÅÉ=tçêâ=pã~êíÉê=kçí=e~êÇÉê= pÉää=jçêÉ=ö=håçï=jçêÉ=ö=dêçï=jçêÉ= Source: (1) HBR The New Age of B2B Selling 2014 (2) Accenture Top 5 Improvements for Sales Effectiveness 2013 (3) Oracle Analysis of D&B US Census Bureau 2013 (4) Gartner Using SPM to Significantly Increase Revenue 2013 (5) Ibid (6) Nucleus Research Future of SPM 2013 (7) Gartner Using SPM to Significantly Increase Revenue 2013 (8) Aberdeen Group Grab the Low Hanging Fruit 2013 (9) CSO Insights, Sales Intelligence Challenge (10) Aberdeen Group What B2B Sellers Need to Know Before the Call 2013 (11) Aberdeen Group Grab the Low Hanging Fruit 2013 Start modernizing today: www.oracle.com/sales Copyright © 2014 Oracle and/or its affiliates. All rights reserved. Can You Afford not to have an SPM Strategy? Are You Truly Insight Driven? lê~ÅäÉ=jçÇÉêå=p~äÉë=áå=íÜÉ=`äçìÇ=aêáîÉë=pã~êíÉê=p~äÉë== Lower cost, less complexity, and faster time-to-value Pre-packaged integration with JD Edwards, eBusiness Suite and Siebel More mobility and device support Integrated incentive compensation, predictive analytics, and digital body profile jçÇÉêå=p~äÉë=áå=íÜÉ= `äçìÇ=jÉ~åë=vçì= 20% revenue increase through improved sales processes7 15% close rate increase by using social together with SPM6 of forecasted deals are won1 InsightDriven 15% increase in Sales Reps achieving quota with cross sell & up-sell recommendations8 62% of B2B reps reported improved lead quality with Sales Intelligence10 17% higher revenue with effective use of Sales Intelligence9 OTB= of customer data will change this year3 13% YOY increase in Net Customer Value for companies with good data quality vs. 1% with poor data quality11 $ ?