
![Outline
# Publication in Slides
- Consultancy division portfolio
- Indonesia and its energy sector strategic role in global portfolio
- Indonesian energy regulation and policy direction towards energy mix
target in 2025
- Key energy stakeholders in Indonesia
- Indonesian energy sector overview: oil & gas, coal, mineral, renewable
energy and electricity Power
# Video of floating storage and regasification unit (FSRU) visit [8 mins]
# Conclusion and Remarks
Disclaimer
This presentation has been prepared by PT Komunitas Energi Nusantara (the “EN”) independently and is circulated for the purpose of general
information only. It is not intended for the specific person who may receive this report. The information in this report has been obtained from
sources which we deem reliable. No warranty (expressed or implied) is made to the accuracy or completeness of the information. All opinions and
estimations included in this report constitute our judgment as of this date and are subject to change without prior notice.
We disclaim any responsibility or liability which may be brought against or suffered by any person as a result of acting in reliance upon the whole
or any part of the contents of this report and neither the EN and/or its respective employees and/or agents accepts liability for any errors,
omissions, negligent or otherwise, in this report and any inaccuracy herein or omission here from which might otherwise arise.](data:image/gif;base64,R0lGODlhAQABAIAAAAAAAP///yH5BAEAAAAALAAAAAABAAEAAAIBRAA7)
Empfohlen
Weitere ähnliche Inhalte
Was ist angesagt?
Was ist angesagt? (20)
Andere mochten auch
Andere mochten auch (17)
Ähnlich wie En indonesian energyupdates_oct13
Ähnlich wie En indonesian energyupdates_oct13 (20)
Kürzlich hochgeladen
Kürzlich hochgeladen (20)
En indonesian energyupdates_oct13
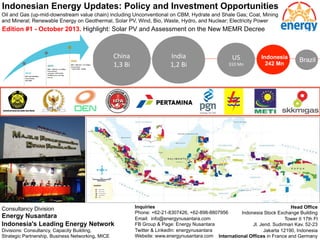
- 1. Indonesian Energy Updates: Policy and Investment Opportunities Oil and Gas (up-mid-downstream value chain) including Unconventional on CBM, Hydrate and Shale Gas; Coal, Mining and Mineral; Renewable Energy on Geothermal, Solar PV, Wind, Bio, Waste, Hydro, and Nuclear; Electricity Power Edition #1 - October 2013. Highlight: Solar PV and Assessment on the New MEMR Decree China 1,3 Bi India 1,2 Bi US 310 Mn Indonesia 242 Mn Brazil Consultancy Division Energy Nusantara Indonesia's Leading Energy Network Divisions: Consultancy, Capacity Building, Strategic Partnership, Business Networking, MICE Inquiries Phone: +62-21-8307426, +62-898-8807956 Email: info@energynusantara.com FB Group & Page: Energy Nusantara Twitter & LinkedIn: energynusantara Website: www.energynusantara.com Head Office Indonesia Stock Exchange Building Tower II 17th Fl Jl. Jend. Sudirman Kav. 52-23 Jakarta 12190, Indonesia International Offices in France and Germany
- 2. Outline # Publication in Slides - Consultancy division portfolio - Indonesia and its energy sector strategic role in global portfolio - Indonesian energy regulation and policy direction towards energy mix target in 2025 - Key energy stakeholders in Indonesia - Indonesian energy sector overview: oil & gas, coal, mineral, renewable energy and electricity Power # Video of floating storage and regasification unit (FSRU) visit [8 mins] # Conclusion and Remarks Disclaimer This presentation has been prepared by PT Komunitas Energi Nusantara (the “EN”) independently and is circulated for the purpose of general information only. It is not intended for the specific person who may receive this report. The information in this report has been obtained from sources which we deem reliable. No warranty (expressed or implied) is made to the accuracy or completeness of the information. All opinions and estimations included in this report constitute our judgment as of this date and are subject to change without prior notice. We disclaim any responsibility or liability which may be brought against or suffered by any person as a result of acting in reliance upon the whole or any part of the contents of this report and neither the EN and/or its respective employees and/or agents accepts liability for any errors, omissions, negligent or otherwise, in this report and any inaccuracy herein or omission here from which might otherwise arise.
- 3. Consultancy Division of Energy Nusantara There are all 5 Divisions: Consultancy, Capacity Building, Business Networking, Strategic Partnership and MICE (Meeting, Incentive, Convention, Exhibition) Consultancy Energy Nusantara Capacity Building Business Networking Strategic MICE Partnership Portfolio Activities Explanation Monthly Publication on Indonesian Energy Updates Energy Nusantara published monthly publication on "Indonesian Energy Updates: Policy and Investment Opportunities" which covers energy spectrum in Indonesia: Oil and Gas (up-mid-downstream value chain) including Unconventional on CBM, Hydrate and Shale Gas; Coal, Mining and Mineral; Renewable Energy on Geothermal, Solar PV, Wind, Bio, Waste, Hydro, and Nuclear; Electricity Power. Access to this publication is complimentary to its members. Investor Roadshow Provided analysis and presentation on Indonesian Energy Sector for clients on Investor Roadshow in August 2013 in Singapore. The clients are BNP Paribas, J.P. Morgan, Nomura, Meryl Lynch, Pine Bridge, GE Asset Management, Morgan Stanley, GIC and Invesco Investment Banking Business Development Performed business development on Pertamina's field acquisition in Republic of Yemen Engineering Conducted engineering activity on the evaluation of Plan of Development (POD) SKKMIGAS (formerly BPMIGAS) : • ENI Muara Bakau BV in Jangkrik field, South Kalimantan • Tately NV in Budi Field Musi Banyuasin, South Sumatra Social Community and Economic Study Conducted social community and economic study with local multiplier impact analysis on POD and Plan of Further Development (POFD) of PSC Companies at: • Tropik Energi Pandan (TEP) in Musi Rawas Field, South Sumatra • Medco E&P Indonesia in Musi Banyuasi Block, South Sumatra • PetroChina International Jabung Ltd in Tanjung Jabung Timur Field, Jambi • Pertamina EP in Rantau Field - North Sumatra, Tapian Timur Field/ Kutai Barat Field - Central Kalimantan and Talang Jimar Field - South Sumatra Quality and HSE Management System Quality, safety, health & environment management system (ISO 9001, ISO 14001, OHSAS 18001, ISO/TS 16949) Political Risk, Stakeholder Engagement Performed political risk and analysis, stakeholder engagement, government policy and corporate development Feasibility Study and Financing Conducted feasibility study and financing of Solar PV Project, engaged with potential investors. Energy Nusantara through its Consultancy Division providing wide range of services starting from guidance on how to do energy business in Indonesia, partnership for training and capacity building, and give support to business partners who are looking for strategic partners and investment in Indonesia. Head Office Indonesia Stock Exchange Building, Tower II 17th Fl Jl. Jend. Sudirman Kav. 52-23 Jakarta 12190, Indonesia International Offices in France and Germany Phone: +62-21-8307426, +62-898-8807956 Email: info@energynusantara.com Website: www.energynusantara.com
- 4. Indonesia - in a nutshell. Key player in global power Archipelago Country Indonesia is the biggest archipelago country in the world with 13,667 islands, its 5 main islands are Sumatra, Kalimantan, Java, Sulawesi and Papua. 70% of its territory are ocean. For comparison, Philippines is the 2nd largest with approximately 7000ish islands Top 5 Population Indonesia is the 4th most populous nation in the world, with 60% is under the age of 39 providing a dynamic workforce G-20 Countries Currently 16th largest economy, Indonesia is projected to be 7th largest in the world by 2030 Stable GDP Growth Indonesia is one of the most stable consistent growth countries with average GDP growth of around 6 - 6.5 % China 1,3 Bi India 1,2 Bi US 310 Mn Indonesia 242 Mn Brazil -Exports contribute the smallest portion of GDP growth, while consumption reached above 60% portion. -The driver of the growth is not from its large labor population size, but the improved labor productivity -Over the last decade, 61% of growth came from improved productivity, versus 39% resulting from the increased number of labor input itself -Indonesia is ranked number 25 on macroeconomic stability in 2012, up from rank 89 in 2007 -Energy is Indonesia’s backbone and engine of economic growth with oil and gas is the prominent part ECONOMY & ENERGY GDP = US$ 700B with its estimated growth at 6.5% Energy Supply Security; Utilization & Pricing Energy Demand, growing by population & current industry age Energy Conservation Increasing National Capacity In Oil And Gas Industry INDONESIA ENERGY TARGETS Growth/ year 2010 Surplus/Defisit Million ton oil equivalent -18 (~0.4 Mmbpd) FOR 2025 5 % § Maintain oil production level of 1 Million BOPD § 50% national operatorship § Security of domestic fuel & industrial feedstock § 91% local content (goods and services) § 99% skilled national workforce § Achieving oil and gas safety, zero accidents, zero failure, and achievement of zero flares, and zero waste 9 % 5 % 2 % Indonesia Energy Demand 2025 Million ton oil equivalent, per year Growth 2010-2025 Oil 63 65 Coal 75 29 75 104 33 38 71 Natural Gas 38 55 24 Others.1 24 63 79 128 113 109 (~210 Mt) 42 (~50 bcm) 28 (~30 bcm) -86 (~1.7 Mmbpd) Decreasing on Gas export for domestic demand Securing oil supply is important ~70% oil is imported in 2025 vs. ~25% currently. 1) Solar, wind, hydro, geothermal, nuclear, fire wood, manure, biomass (rice residue, sugar, rubber, palm, agribusiness cogeneration). Mton = Million tons; Bcm = Billion cubic meter. Mmbpd = Million barrel of oil per day. Source: *Estimation 2010, DEN 2010-2025, **BAU EBTKE Source: Energy Nusantara, Bank Indonesia, Pertamina, MEMR 2013, McKinsey, IEA, FGE - FACTS Global Energy
- 5. PESTLE: Political, Economic, Sociological, Technological on Indonesia’s Macro Situation Nationalism spirit Regional Autonomy Election year 2014 G 20 Countries High GDP Growth of 7-8%/ year Job Creation Land Acquisition Manpower availability to match job qualification Deepwater in offshore in frontier area in the eastern part Oil and Gas Law Amendment Geothermal Law Amendment Energy Mix Policy Climate Change
- 6. PORTER’s Five Forces Model Analysis on Energy sector in Indonesia Overseas buyer for Fossil Energy and Domestic for all energy types Asia Pacific as the highest economic growth region in high demand for energy [LOW] Competition among PSCs Major oil and gas companies [STRONG] Qualified and proven EPC contractor Equipment and service availability Advanced and proprietary technology [STRONG] High investment and operation, skilled man power, technology Procedures and Licensing [STRONG] Oil and gas Vs cheaper coal, development of renewable energy and unconventional resources [LOW]
- 7. Energy outlook 2030. Gas will likely dominate with global resources exceed 250 years of current production. Indonesia is among top 3 both reserve and production of oil and gas in Asia Pacific and is currently also the biggest thermal coal exporter country, thus Indonesia is strategically plays important role in the region and global power Asia Pacific Countries Gas Oil Reserve (TCF) Production (BCFD) Reserve (Bil BO) Production (MBOPD) Australia 132 (1) 4.7 (4) 3.9 (5) 458 (5) China 109 10.3 15.5 4158 Indonesia 103 (3) 6.9 (2) 4.7 (3) 918 (2) Malaysia 46 6.3 4.5 657 India 47 3.9 5.6 894 Source: Energy Nusantara, BP Statistical Review 2013, IEA 2012
- 8. Masterplan acceleration and expansion of economic development 2011-2025 (MP3EI) Source: *Estimation 2010, DEN 2010-2025, **BAU EBTKE Source: Energy Nusantara, MP3EI
- 9. Energy Security: National Interest Vs Foreign Threat. Indonesia has 10 bordering countries: India, Thailand, Malaysia, Singapore, Vietnam, Phillippine, Palau, PNG, Australia and Timor Leste. Just slightly north of Indonesia’s natuna sea, there is a territorial disputed area over the ownership of Spratly islands among China, Brunei, Malaysia, Philippines, Taiwan and Vietnam. The trigger was the giant oil discovery in 1968 in the area with estimation of the reserve is 4th largest in the world
- 10. Indonesian Energy Regulation and Policy Direction. Except for oil, others are projected to increase in energy mix target in 2025. Oil and gas milestone timeline: oil and gas law no. 22/ 2001 resulting SKKMigas and BPHMigas Law No 30 / 2007, Oil and Gas Law No. 22/ 2001 Energy Diversification Presidential Regulation No. 5 / 2006 National Energy Policy (17% from Renewable Energy) Vision 25/25 – Ministry of Energy and Mineral Resources (MEMR) and National Energy Council to achieve 25% from renewable energy in 2025 Energy Law No. 30/ 2007 • New & Renewable Energy can be developed optimally v Diversification : Towards Renewable Energy v Conservation : Efficient Energy Use v Intensification : Exploitation of Energy Sources to increase resources Geothermal Law No. 27/ 2003 Oil and Gas Law No. 22/ 2001 NRE Coal Gas Oil Policy Direction Goals 4.8 % 21.9 % 26.38 % 47 % 4300 Million BOE 3.1 % 34.6 % • Reduce of oil’s role in energy mix • Fulfillment of domestic energy needs • Price subsidy become direct subsidy • Electrification ratio 93% in 2025 • Energy Elasticity less than 1 in 2025 17 % 33 % 30 % Primary Energy Mix (2025) 41.7 % 23 % 2010 2015 2020 2025 ENERGY CONSERVATION (33,85%) DIVERSIFICATION ENERGY 25 % 22 % 30 % 20,6 % 2852 Million BOE 1066 Million BOE 3200 Million BOE 20 % MEMR VISION 25/25 BAU PRIMARY ENERGY MIX 2010 Source: *Estimation 2010, DEN 2010-2025, **BAU EBTKE PRIMARY ENERGY MIX 2025 Oil 20% Coal 33% Natural Gas 30% Biofuels 5% Geothermal 5% Solar, Wind, Biomas s, Nuclear, Hydro 5% Liquified Coal 2% Renewable Energy 17% Source: Energy Nusantara, Pertamina, MEMR 2013 Regulation Hierarchy 1. Undang Undang 2 .Peraturan Pemerintah 3. Peraturan Presiden 4. Instruksi Presiden 5. Keputusan Presiden 6. Peraturan Menteri 7. Instruksi Menteri 8. etc
- 11. Indonesian Key Energy Stakeholders PRESIDENT 2004-2009, 2009-2014 Marzuki Ali BPHMIGAS Ministry of State Enterprise (BUMN) Jero Wacik • Govt. Liaison for oil & gas • Determine policy on oil & gas activities • Award PSC • Undertake / supervise on SOE, PERTAMINA, PGN Johannes Widjanarko (act) SKKMigas Ditjen Oil and Gas Downstream § Refinery, marketing, pipelines, distribution and logistic. § This includes tariff, supply regulation and price Upstream - E & P § Manage exploration acreage § Manage PSC § Manage sales of Govt. oil & gas portion § Report to Minister on upstream activities Ministry of Energy & Mineral Resources (ESDM) Andy Noorsaman Sommeng Dahlan Iskan Susilo Bambang Yudhoyono Edy Hermantoro Ditjen Electricity Energy Commission (DPR RI Komisi VII) Party (Fraksi) 1. Fraksi Partai Demokrat 2. Fraksi Partai Golongan Karya 3. Fraksi Partai Demokrasi Indonesia Perjuangan (F-PDIP) 4. Fraksi Partai Keadilan Sejahtera 5. Fraksi Partai Amanat Nasional 6. Fraksi Partai Persatuan Pembangunan 7. Fraksi Partai Kebangkitan Bangsa 8. Fraksi Partai Gerakan Indonesia Raya (F-Gerindra) 9. Fraksi Partai Hati Nurani Rakyat (F-Hanura) Partners (Mitra Kerja) Departemen Energi dan Sumber Daya Mineral Menteri Negara Lingkungan Hidup Menteri Negara Riset dan Teknologi Badan Tenaga Nuklir (BAPETAN) Badan Koordinasi Survei dan Pemetaan Nasional (BAKOSURTANAL) Lembaga Penerbangan dan Antariksa Nasional (LAPAN) Badan Pengatur Kegiatan Hilir Migas (BPH Migas) SKK Migas Dewan Energi Nasional (DEN) PP IPTEK Lembaga EIKJMEN Badan Pengkajian dan Penerapan Teknologi (BPPT) Dewan Riset Nasional Lembaga Ilmu Pengetahuan Indonesia (LIPI) Badan Tenaga Nuklir (BATAN) Badan Pengawas Tenaga Nuklir (BAPETAN) Chairman: President, Vice Chairman: Vice President Executive Chairman: Minister of EMR Members (15): 7 Ministers: Keuangan, Perencanaan Pembangunan Nasional/ Ketua Bappenas, Perhubungan, Pertanian, Perindustrian, Ristek, LH 8 Unsur Pemangku Kepentingan: Industri, Akademisi, Konsumen, Teknologi, LH Ditjen New, Renewable Energy and Energy Conservation Ditjen Mineral and Coal Nur Pamudji Hendi PS Karen Agustiawan National Energy Council (DEN) Association
- 12. Ministry of Energy and Mineral Resources (ESDM) Republic of Indonesia Source: ESDM
- 13. Fossil energy share and subsidy. Ironically as we import crude and refined product, in high crude price in 2008 the energy subsidy also hit the country all time record. Jan-98 May-98 Sep-98 Jan-99 May-99 Sep-99 Jan-00 May-00 Sep-00 Jan-01 May-01 Sep-01 Jan-02 May-02 Sep-02 Jan-03 May-03 Sep-03 Jan-04 May-04 Sep-04 Jan-05 May-05 Sep-05 Jan-06 May-06 Sep-06 Jan-07 May-07 Sep-07 Jan-08 May-08 Sep-08 Jan-09 May-09 Sep-09 Jan-10 May-10
- 14. Oil and gas are getting more expensive and difficult to extract. Unconventional on CBM, Heavy Oil, Gas Shales and Gas Hydrates are progressing
- 15. Indonesia’s current reserve and production are concentrated in western part with the country's future is in the frontier area in the eastern part Moving from the western to eastern part by expanding exploration activities in the eastern part of Indonesia Shifting from oil to gas, both in the upstream industry and its utilization: - Numerous Gas Development Projects - Stronger oil to gas substitution in many areas of utilizations, such as: electricity, industrial sector, and CNG - Turning gas allocation from export to domestic market, - Switching gas as the source of revenue to gas as the engine of economy.
- 16. Oil and gas production: historic and outlook. Gas is the trend with the increasing gas production outlook despite declining oil production trend Source: SKKMigas Outlook 0 500 1000 1500 2000 1966 1967 1968 1969 1970 1971 1972 1973 1974 1975 1976 1977 1978 1979 1980 1981 1982 1983 1984 1985 1986 1987 1988 1989 1990 1991 1992 1993 1994 1995 1996 1997 1998 1999 2000 2001 2002 2003 2004 2005 2006 2007 2008 2009 2010 2011 2012 2013 2014 2015 2016 2017 MBOEPD Oil Gas PEAK 1977 Plateau stage Decline 2-3% *) Outlook per January 29th,2013 PEAK 1995
- 17. Indonesia’s fuel distribution is the most complex in the world. Pertamina as national energy company maintains the public service obligation (pso) providing fuel across the archipelago with the same consumer price Source: Pertamina JAYAPURA MERAUKE BITUNG SABANG KRUENG RAYA LHOK SEUMAWE UP. I - PKL. BRANDAN LAB. DELI UP. II - DUMAI SIAK MEULABOH SIBOLGA G. SITOLI TT. TLK. KABUNG JAMBI BENGKULU UP. III - PLAJU PANJANG P. NATUNA P. BATAM PONTIANAK SEMARANG SURABAYA CAMPLONG SAMARINDA BALIKPAPAN MENENG TT. TLK MANGGIS AMPENAN BADUNG BIMA REO MAUMERE ENDE WAINGAPU L. TUKA SANANA TERNATE KALABAHI ATAPUPU DILI KUPANG BIAK TUAL DOBO SAUMLAKI FAK - FAK SERUI NABIRE MANOKWARI SORONG TOBELO BULA MASOHI NAMLEA PABUHA UP. IV CILACAP SINTANG SAMPIT CILIK RIWUT PKL.BUN P. PISANG BANJARMASIN TARAKAN TOLI - TOLI MOUTONG DONGGALA PARIGI POSO GORONTALO KOLONDALE PALOPO TAHUNA KOTA BARU PARE - PARE P. SAMBU TT. TG. GEREM/MERAK BONTANG PLUMPANG UP.VI BALONGAN LUWUK KENDARI KOLEKA RAHA BAU -BAU UJ. PANDANG SUBUNG TT. WAY AME BANGGAI KALBUT IMPORT T. SEMANGKA KETERANGAN : REFINERIES : DISTRIBUTION PATTERN : TRANSIT TERMINAL : FUELS DEPOT : FLOATING STORAGE : TERMINAL BACK LOADING : DISCHARGE PORT IMPOR • 14 Transit Terminal & Instalasi • 51 Terminal & Depo Utama • 85 Depo Darat & Laut Lainnya • 5 STS & Jobber • 55 DPPU
- 18. Gas Utilization, Export Vs Domestic. Domestic being used and prioritized for oil and gas lifting, fertilizer, electricity and industry. In period of 2003-2012, the domestic use is increased 9% per yr CAGR. Cumulative Volume (TCF) Gas Domestic Utilization 25 20 15 10 5 0 Fertilizer Electricity Industry 2003 2004 2005 2006 2007 2008 2009 2010 2011 2012 MTPA Indonesian LNG – Export Realization 30 25 20 15 10 5 0 Domestic USA China Taiwan South Korea Japan 2005 2006 2007 2008 2009 2010 2011 2012 Lifting, 4.7% Fertilizer, 8.1% Electricity, 12.3% Industry + CO2, 16.8% Citygas, 0.003% LNG Domestic, 0.4% Gas Pipe Export, 13.9% LPG, 3.7% LNG Export, 40.0%
- 19. Gas in the form of LNG is a global traded commodity. Indonesia was #1, now is #3 biggest LNG exporting country after Qatar and Malaysia Source: WoodMackenzie at World Gas Conference 2012
- 20. LNG exporting and importing countries and FSRU worldwide. FSRU West Java is #4 FSRU in operation, and it is the 1st in Asia Pacific. It starts operating in mid 2012 Source: Energy Nusantara LNG Workshop 2013, Marine Service GMBH
- 21. 1st FSRU in Asia Pacific, Value Chain and Ship to Ship Operation LNG Carrier FSRU Source: Energy Nusantara, Nusantara Regas
- 22. LNG Infrastructure in Eastern Indonesia. Mini LNG is the most effective solution considering the geographic challenges and low demand There will be 8 mini LNG plants with each varies from 3-30 mmscfd capacity • Unlike in Java and Sumatra, construction of extensive gas transmission pipelines in eastern Indonesia is not feasible as the relatively low gas demand does not justify the high CAPEX • Gas pipeline networks are not well established in eastern Indonesia, LNG is the most strategic solution to balance the supply-demand gap in respect to geographical condition and distance between gas supply to demand points in Indonesia • Due to marginal demand in the range 3 to 30 MMSCFD in the eastern part of Indonesia, small scale LNG plant is the most suited and efficient way for gas distribution
- 23. Mineral resources and reserve map. Law no. 4/ 2009 stipulates on mineral and coal mininng To increase added value, investors are expected to process any metal minerals into metal products in Indonesia, by establishing owned smelters or using others’. In five years since 2009, it is prohibited for companies or investors to export raw materials of mining commodities. Ferro and Associates : Fe, Nickel, Cobalt, Chromit , Mangan, Molibdenum, Titanium Precious Metal : Gold, Silver, PlaFnum Base Metal : Zinc, Cupper, Tin, Lead, Mercury Light and Rare metal : Bauxite, Monasit NO Commodity Resource (Million TON ORE) Reserve (Million TON ORE) 1 Copper 4.925 4.161 2 Bauxite 551 180 3 Nickel 2.633 577 4 Pasir Besi 1.649 5 5 LateriFc Iron 1.462 106 6 Primary Iron 563 30 7 Sediment Iron 18 -‐ 8 Mangan 11 4 9 Alluvial Gold 1.455 17 10 Primary Gold 5.386 4.231 11 Silver 3.406 4.104 12 Zinc 577 7 13 White Lead 354 0,7 14 Lead 363 1,6 Source: Badan Geologi, 2010
- 24. Coal resources and reserve map. Indonesia is the largest coal exporting country Very High ( > 7100 kal/gr ) High ( 6100 -‐ 7100 kal/gr ) Medium ( 5100 -‐ 6100 kal/gr ) Low ( < 5100 kal/gr ) Total Resource 161.34 Billion Ton* Total Reserve 28.17 Billion Ton *) 41 Billion Ton Source: Badan Geologi, 2010
- 26. Geothermal potential, Indonesia is currently 3rd biggest installed capacity after US and the Philippines (1/2) Source: Pertamina
- 27. Lahendong Operator : Pertamina Capacity : 20 MW Dieng Operator : GeoDipa Capacity : 60 MW Gunung Salak Operator : Chevron Capacity : 375 MW Kamojang Operator : Pertamina Capacity : 140 MW Sibayak Operator : Pertamina Capacity : 2 MW 13,800 MW Wayang Windu Operator : Star Energy Capacity : 110 MW 9,250 MW 1,900 MW 2,000 MW 50 MW Darajat Operator : Chevron Capacity :255 MW Exploration/ Development Open Area Geothermal potential, Indonsia is currently 3rd biggest installed capacity after US and the Philippines (2/2) Source: Energy Nusantara, ESDM
- 28. Solar ministerial 1 PV, the right time for project developer. Government also recently issued decree on this (1/5) Indonesia is relatively well exposed compared to other countries, with solar irradiation levels highest in Jawa, Sulawesi and Nusa Tenggara Solar insolation map Peak sun hours day PPPPPPPPPRRRRRRRRROOOOOOOOOPPPPPPPPPIIIIIINNNIIINNNNNNSSSSSSSSSIIIIII...III... ... GGG GGGGGGOOOOOOOOORRRRRRRRROOOOOOOOONNNNNNNNNTTTTTTTTTAAAAAAAAALLLLLLLLLOOOOOOOOO PPPPPPPPPRRRRRRRRROOOOOOOOOPPPPPPPPPIIIIIIIIINNNNNNNNNSSSSSSSSSIIIIIIIII......... BBBBBBBBBEEEEEEEEENNNNNNNNNGGGGGGGGGKKKKKKKKKUUUUUUUUULLLLLLLLLUUUUUUUUU PROPINSI. SULAWESI TENGGARA PPPPPPPPRRRRRRRROOOOOOOOPPPPPPPPIIIIINNIIINNNNNNSSSSSSSSIIIII..III... ... SS SSSSSSUUUUUUUULLLLLLLLAAAAAAAAWWWWWWWWEEEEEEEESSSSSSSSIIIII III TT TTTTTTEEEEEEEENNNNNNNNGGGGGGGGGGGGGGGGAAAAAAAARRRRRRRRAAAAAAAA PPPPPPPPPRRRRRRRRROOOOOOOOOPPPPPPPPPIIIIIINNNIIINNNNNNSSSSSSSSSIIIIII...III... ... BBB BBBBBBAAAAAAAAANNNNNNNNNTTTTTTTTTEEEEEEEEENNNNNNNNN PPPPPPPPPRRRRRRRRROOOOOOOOOPPPPPPPPPIIIIIINNNIIINNNNNNSSSSSSSSSIIIIII...III... ... KKK KKKKKKAAAAAAAAALLLLLLLLLIIIIIIMMMIIIMMMMMMAAAAAAAAANNNNNNNNNTTTTTTTTTAAAAAAAAANNNNNNNNN BBB BBBBBBAAAAAAAAARRRRRRRRRAAAAAAAAATTTTTTTTT Solar Module Polysilicon Wafer Solar Cell Solar System Electricity Project scope is to build 60 Megawatt peak solar cell plant & 30 Megawatt peak solar module plant Project scheme : JV with State Owned Enterprise Target for commercialization in early 2015 Estimated solar irradiation map of Indonesia kWh/sqm/ January July 4.75 – 4.90 4.90 – 5.25 5.25 – 7.50 POTENSI PASIR KUARSA PPPPPPPPPRRRRRRRRROOOOOOOOOPPPPPPPPPIIIIIINNNIIINNNNNNSSSSSSSSSIIIIII...III... ... NNN NNNNNNUUUUUUUUUSSSSSSSSSAAAAAAAAATTTTTTTTTEEEEEEEEENNNNNNNNNGGGGGGGGGGGGGGGGGGAAAAAAAAARRRRRRRRRAAAAAAAAA BBB BBBBBBAAAAAAAAARRRRRRRRRAAAAAAAAATTTTTTTTT PPPPPPPPPRRRRRRRRROOOOOOOOOPPPPPPPPPIIIIIINNNIIINNNNNNSSSSSSSSSIIIIII III DDD DDDDDDAAAAAAAAAEEEEEEEEERRRRRRRRRAAAAAAAAAHHHHHHHHH III IIISSSIIISSSSSSTTTTTTTTTIIIIIIMMMIIIMMMMMMEEEEEEEEEWWWWWWWWWAAAAAAAAA YYY YYYYYYOOOOOOOOOGGGGGGGGGYYYYYYYYYAAAAAAAAAKKKKKKKKKAAAAAAAAARRRRRRRRRTTTTTTTTTAAAAAAAAA PPPPPPPPPRRRRRRRRROOOOOOOOOPPPPPPPPPIIIIIINNNIIINNNNNNSSSSSSSSSIIIIII...III... ... MMM MMMMMMAAAAAAAAALLLLLLLLLUUUUUUUUUKKKKKKKKKUUUUUUUUU UUU UUUUUUTTTTTTTTTAAAAAAAAARRRRRRRRRAAAAAAAAA PPPPPPPPPRRRRRRRRROOOOOOOOOPPPPPPPPPIIIIIINNNIIINNNNNNSSSSSSSSSIIIIII...III... ... MMM MMMMMMAAAAAAAAALLLLLLLLLUUUUUUUUUKKKKKKKKKUUUUUUUUU PPPPPPPPPRRRRRRRRROOOOOOOOOPPPPPPPPPIIIIIINNNIIINNNNNNSSSSSSSSSIIIIII...III... ... KKK KKKKKKAAAAAAAAALLLLLLLLLIIIIIIMMMIIIMMMMMMAAAAAAAAANNNNNNNNNTTTTTTTTTAAAAAAAAANNNNNNNNN SSS SSSSSSEEEEEEEEELLLLLLLLLAAAAAAAAATTTTTTTTTAAAAAAAAANNNNNNNNN PPPPPPPPPRRRRRRRRROOOOOOOOOPPPPPPPPPIIIIIINNNIIINNNNNNSSSSSSSSSIIIIII III III IIIRRRIIIRRRRRRIIIIIIAAAIIIAAAAAANNNNNNNNN JJJ JJJJJJAAAAAAAAAYYYYYYYYYAAAAAAAAA TTT TTTTTTEEEEEEEEENNNNNNNNNGGGGGGGGGAAAAAAAAAHHHHHHHHH PPPPPPPPPRRRRRRRRROOOOOOOOOPPPPPPPPPIIIIIINNNIIINNNNNNSSSSSSSSSIIIIII...III... ... BBB BBBBBBAAAAAAAAALLLLLLLLLIIIIIIIII PPPPPPPPPRRRRRRRRROOOOOOOOOPPPPPPPPPIIIIIINNNIIINNNNNNSSSSSSSSSIIIIII...III... ... SSS SSSSSSUUUUUUUUULLLLLLLLLAAAAAAAAAWWWWWWWWWEEEEEEEEESSSSSSSSSIIIIII III TTT TTTTTTEEEEEEEEENNNNNNNNNGGGGGGGGGAAAAAAAAAHHHHHHHHH PPPPPPPPPRRRRRRRRROOOOOOOOOPPPPPPPPPIIIIIINNNIIINNNNNNSSSSSSSSSIIIIII...III... ... SSS SSSSSSUUUUUUUUUMMMMMMMMMAAAAAAAAATTTTTTTTTEEEEEEEEERRRRRRRRRAAAAAAAAA UUU UUUUUUTTTTTTTTTAAAAAAAAARRRRRRRRRAAAAAAAAA PPPPPPPPPRRRRRRRRROOOOOOOOOPPPPPPPPPIIIIIINNNIIINNNNNNSSSSSSSSSIIIIII III BBB BBBBBBAAAAAAAAANNNNNNNNNGGGGGGGGGKKKKKKKKKAAAAAAAAA BBB BBBBBBEEEEEEEEELLLLLLLLLIIIIIITTTIIITTTTTTUUUUUUUUUNNNNNNNNNGGGGGGGGG PPPPPPPPPRRRRRRRRROOOOOOOOOPPPPPPPPPIIIIIINNNIIINNNNNNSSSSSSSSSIIIIII...III... ... SSS SSSSSSUUUUUUUUUMMMMMMMMMAAAAAAAAATTTTTTTTTEEEEEEEEERRRRRRRRRAAAAAAAAA BBB BBBBBBAAAAAAAAARRRRRRRRRAAAAAAAAATTTTTTTTT PPPPPPPPPRRRRRRRRROOOOOOOOOPPPPPPPPPIIIIIINNNIIINNNNNNSSSSSSSSSIIIIII...III... ... KKK KKKKKKAAAAAAAAALLLLLLLLLIIIIIIMMMIIIMMMMMMAAAAAAAAANNNNNNNNNTTTTTTTTTAAAAAAAAANNNNNNNNN TTT TTTTTTEEEEEEEEENNNNNNNNNGGGGGGGGGAAAAAAAAAHHHHHHHHH PPPPPPPPPRRRRRRRRROOOOOOOOOPPPPPPPPPIIIIIINNNIIINNNNNNSSSSSSSSSIIIIII...III... ... LLL LLLLLLAAAAAAAAAMMMMMMMMMPPPPPPPPPUUUUUUUUUNNNNNNNNNGGGGGGGGG PPPPPPPPPRRRRRRRRROOOOOOOOOPPPPPPPPPIIIIIINNNIIINNNNNNSSSSSSSSSIIIIII III SSS SSSSSSUUUUUUUUULLLLLLLLLAAAAAAAAAWWWWWWWWWEEEEEEEEESSSSSSSSSIIIIII III BBB BBBBBBAAAAAAAAARRRRRRRRRAAAAAAAAATTTTTTTTT PPPPPPPPPRRRRRRRRROOOOOOOOOPPPPPPPPPIIIIIIIIINNNNNNNNNSSSSSSSSSIIIIIIIII......... RRRRRRRRRIIIIIIIIIAAAAAAAAAUUUUUUUUU PPPPPPPPPRRRRRRRRROOOOOOOOOPPPPPPPPPIIIIIINNNIIINNNNNNSSSSSSSSSIIIIII...III... ... KKK KKKKKKEEEEEEEEEPPPPPPPPPUUUUUUUUULLLLLLLLLAAAAAAAAAUUUUUUUUUAAAAAAAAANNNNNNNNN RRR RRRRRRIIIIIIAAAIIIAAAAAAUUUUUUUUU PPPPPPPPPRRRRRRRRROOOOOOOOOPPPPPPPPPIIIIIINNNIIINNNNNNSSSSSSSSSIIIIII III KKK KKKKKKAAAAAAAAALLLLLLLLLIIIIIIMMMIIIMMMMMMAAAAAAAAANNNNNNNNNTTTTTTTTTAAAAAAAAANNNNNNNNN TTT TTTTTTIIIIIIMMMIIIMMMMMMUUUUUUUUURRRRRRRRR PPPPPPPPPRRRRRRRRROOOOOOOOOPPPPPPPPPIIIIIINNNIIINNNNNNSSSSSSSSSIIIIIIIIIIIIIII III PPP PPPPPPAAAAAAAAAPPPPPPPPPUUUUUUUUUAAAAAAAAA TTT TTTTTTIIIIIIMMMIIIMMMMMMUUUUUUUUURRRRRRRRR PPPPPPPPPRRRRRRRRROOOOOOOOOPPPPPPPPPIIIIIINNNIIINNNNNNSSSSSSSSSIIIIII III III IIIRRRIIIRRRRRRIIIIIIAAAIIIAAAAAANNNNNNNNN JJJ JJJJJJAAAAAAAAAYYYYYYYYYAAAAAAAAA BBB BBBBBBAAAAAAAAARRRRRRRRRAAAAAAAAATTTTTTTTT PPPPPPPPPRRRRRRRRROOOOOOOOOPPPPPPPPPIIIIIIIIINNNNNNNNNSSSSSSSSSIIIIIIIII......... NNNNNNNNNAAAAAAAAANNNNNNNNNGGGGGGGGGGGGGGGGGGRRRRRRRRROOOOOOOOOUUUUUUUUU AAAAAAAAACCCCCCCCCEEEEEEEEEHHHHHHHHH DDDDDDDDDAAAAAAAAARRRRRRRRRUUUUUUUUUSSSSSSSSSSSSSSSSSSAAAAAAAAALLLLLLLLLAAAAAAAAAMMMMMMMMM PPPPPPPPPRRRRRRRRROOOOOOOOOPPPPPPPPPIIIIIINNNIIINNNNNNSSSSSSSSSIIIIII...III... ... JJJ JJJJJJAAAAAAAAAMMMMMMMMMBBBBBBBBBIIIIIIIII PPPPPPPPPRRRRRRRRROOOOOOOOOPPPPPPPPPIIIIIINNNIIINNNNNNSSSSSSSSSIIIIII III JJJ JJJJJJAAAAAAAAAWWWWWWWWWAAAAAAAAA TTT TTTTTTEEEEEEEEENNNNNNNNNGGGGGGGGGAAAAAAAAAHHHHHHHHH Indonesia has the potential for very large quartz sand (17,491 billion tons) that can be used as a main ingredient a silicon-based solar energy industry Source: Pertamina
- 29. Solar PV Project Development Timeline and Business Scheme (2/5) Source: Energy Nusantara
- 30. Solar PV Project Development Timeline and Business Scheme (3/5) Source: Energy Nusantara
- 31. Solar Feed-in-Tariff at MEMR Decree 17/ 2013 (4/5) Source: Fuadi Nasution – Energy Nusantara Industry Expert
- 32. Implication of MEMR Decree 17/ 2013 on Solar PV (5/5) Source: Fuadi Nasution – Energy Nusantara Industry Expert
- 33. Chemicals Hydro is high CAPEX but low opex Source: Sampoerna ITB Energy Management 2007 Class Lecture Material
- 34. Wind energy highest potential in Indonesia is located in Nusa Tenggara Timur Favorable Wind Resource Area at East Nusa Tenggara Wind Map West Timor and Sumba Islands Current status : mapping the potential of wind energy Source: NREL
- 35. Wind and Solar PV Hybrid ImplementaSon
- 36. Nuclear - Uranium, no progress as no political will and lack of public acceptance Source: SBM ITB
- 37. 951 544 Source Reduction & Reuse Recycling / Composting Energy Recovery Treatment & Disposal Capacity 10MW Produce: 500kg/ day Waste to Energy 197 20 From 6000T waste/ day, only2000T can be managed by GTJ Potential to be developed Current System Proposed technology systems Integrated Plasma Gasification Combined Cycle (IPGCC) Scope converts waste products into potential 120 MW electricity with bioavtur Scheme JV with municipal waste management contractor in Jakarta and technology provider Commercialization target 2015 Source: Pertamina 2015 2014 2013 61 2011 on grid (MW) Capacity Development of WTE in Indonesia 2012
- 38. Electricity Investment Scheme Government PT PLN (Persero) Banking: International and National Loan Electricity Consumer Private Investor (IPP) Contractor (EPC) Mechanism Auction Legal Basis Presidential decree no. 80/ 2003 concerning guidance for government procurement of goods/ services jo presidential regulation no. 95/ 2007 Mechanism Auction, Direct Appointment, Direct Selection Legal Basis PP No. 10/1989 jo PP No. 3/ 2005, PP No. 26/ 2006 Direct Appointment a. The sale of electric power from power generator using renewable, marginal gas, mine mouth coal and other local energy b. The purchase of excess electric power c. Local electric power system in critical condition of electric power supplly d. Capacity extensions of electric power generator in power generators which has been operating at the same location with cooperative state owned enterprise, private, NGO, individual acting as holder of IUKU Direct Selection a. Developer apply for direct appointment in the system of PKUK or IUKU Holder more than one b. Capacity volume over by developer exceeds the additional needs of system capacity of PKUK or Holder of local IUKU APBN Auction Revenue Sale of electric power
- 39. Power Plant 2008 – 2014, coal is the biggest contribution 2008 2009 2010 2011 2012 RAPBN-P 2013 RAPBN 2014 % from total production (GWh) HSD 36% 25% 22% 22,95% 14,97% 10,87% 9,70% Gas 17% 25% 25% 21,00% 23,41% 22,45% 22,02% Coal 35% 39% 38% 44,06% 50,27% 55,15% 57,24% Hydro 9% 8% 12% 6,80% 6,39% 6,40% 6,09% Geothermal 3% 3% 3% 5,13% 4,85% 4,60% 4,43% Bio Diesel & Other RE 0% 0% 0% 0,07% 0,11% 0,52% 0,52% Source: Energy Nusantara, MEMR 2013
- 40. Electricity ratio target in 2013, with NTB, NTT and Papua are the lowest indicated with yellow and red colored box NAD 91,06% Sumut 88,69% Sumbar 78,72% Riau 86,10% Sumsel 74,50% Bengkulu 79,88% Babel 94,77% Lampung 77,39% Jakarta 99,99% Banten 80,20% Jabar 77,36% Jateng 83,98% Jambi 75,30% DIY 81,43% Bali 77,35% JaSm 77,15% NTB 62,86% NTT 60,78% Kalbar 76,37% Kalsel 77,71% KalSm 73,69% Sulut 77,90% Sulteng 70,40% Sulsel 78,77% Malut 79,74% Maluku 75,92% Category : Papua 50,20% > 60 % 41 -‐ 60 % 20 -‐ 40 % Sulbar 75,01% Kepri 84,50% Sultra 66,93% Papua Barat 71,49% Kalteng 80,41% Gorontalo 66,03% NTB 53,63% NTT 53,42% REALISASI (Tahun) RENCANA 2006 2007 2008 2009 2010 2011 2012 2013 2014 Rasio Elektrif ikasi 63% 64,3% 65,1% 65,8% 67,2% 72,95% 76,56% 79,3% 81,4% Papua 34,62% Source: Energy Nusantara, PLN 2013 2012 2012 2012
- 41. FSRU Visit Video: Stakeholders witnessed the operational of this facility (4th in the world) in Youtube: http://www.youtube.com/watch?v=VjGeAFY-8Fk [copyright of Energy Nusantara 2013]. Due to PDF file conversion, you can look for Energy Nusantara FSRU in the Youtube in order to view this 8 minutes FSRU visit video FSRU West Java Nusantara Regas Pertamina (60%) and PGN (40%) Start Operation in Mid 2012 Gov Budget Saving USD 700 Mil/yr
- 42. Remarks Indonesia plays strategic role in global context, as G-20 and high GDP growth country. It also posses abundant energy resources but in order to expedite resource monetization and meet the energy mix target in 2025 In Indonesia, there are quite a number of stakeholders overseeing energy sector. Need to minimize the overlapping roles by strengthening the existing one. Renewable energy implementation is still low due to lack of strong leadership, high interest in fossil energy and the energy pricing policy is not yet supporting B to B. In fossil energy, gas is the trend with the recent discovery and increasing production but infrastructure especially offshore marine is required to support this growing industry INDONESIA I
- 43. Thank You Energy Nusantara Indonesia's Leading Energy Network Head Office Indonesia Stock Exchange Building, Tower II 17th Fl Jl. Jend. Sudirman Kav. 52-23 Jakarta 12190, Indonesia International Offices in France and Germany Phone: +62-21-8307426, +62-898-8807956 FB Group & Page: Energy Nusantara Twitter, LinkedIn, Youtube: energynusantara Email: info@energynusantara.com Website: www.energynusantara.com Head Office Indonesia Energy Nusantara is an energy based consultancy and business partner, providing wide range of services starting from guidance on how to do energy business in Indonesia, partnership for training and capacity building, and give support to business partners who are looking for strategic partners and investment in Indonesia. Five Divisions under Energy Nusantara are Business Consultancy, Capacity Building, Business Networking, Strategic Partnership and MICE (Meeting, Incentive, Convention, Exhibition) International Offices France, Germany