Resultados del Campeonato mundial de Marcha por equipos Antalya 2024
Top Suthayakhom
1. Patterns of Shooting in Football
Top Suthayakhom
email: toppy_6@hotmail.com
18% of the results involved 2 passes and 3 players before a
INTRODUCTION METHODS shot occurred. This was not a significant finding and
therefore had no trend. But this is not to say it is not relevant
Shooting in football is a vital part of the game to be able Notational analysis was conducted by watching 22 games for coaching purposes because passes were usually
to score more than the opposition and win. It is important which included 23 teams that competed in the 2002 World intended for a player but was either deflected or intercepted
for players to be able to shoot the ball on target for there Cup. The primary variables consisted: by an opponent therefore restarting the player count.
to be any possibilities of scoring a goal. The three main
components to shooting are technique, scoring attitude Variable 1: Ball orientation and method of possession
and field awareness (1). In this analytical research, it will Variable 2: Number of Players and Passes involved Penalty kicks are extremely vital part of the game. 25% of
determine if the technique and field awareness would Variable 3: Shot outcome (on target, off target, goal, no goal) the total goals came from penalty kicks and 88.2% (SR = 14)
make a difference when it comes to a successful shot. of goals were scored off penalty kicks ( ² (5) = 214.378, p <
From previous research and coaching articles in Variables were then tested by using Chi-squares and also .001)
reference to set pieces and tactical plays, show that they determining different percentages for coaching strategies
involve at least two passes and three players in each
scenario of open play (2, 3). Goals Google Images 2009
Hughes and Franks analysed the 1990 and 1994 World RESULTS 70
Cups and concluded that there were significantly more
shots per possession at longer passing sequences for Analysis showed a significant relationship between the ball 60 CONCLUSION
Amount of Goals
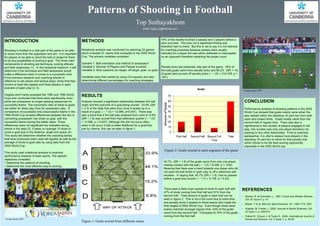
successful teams. The conversion ratio of shots to goals origin and the outcome of a goal being scored. 33.9% (SR
50
are better for direct play than for possession play. A = 2.3) of the balls that were from zone A ended up in a Performance analysis of shooting patterns in the 2002
comparison of successful and unsuccessful teams in the result of a goal. ( ² (3) = 12.086, p=0.007). There was 40 World Cup showed that goals mainly came when the
1990 World Cup showed differences between the two in also a trend that if the ball was obtained from zone D, 6.8% play started within the attacking 18 yard box from both
30
converting possession into shots on goal, with the (SR = 1.6) was scored from that defensive quarter ( ² (3) open and closed shots. Goals mostly came from the
successful teams having the better ratios. These = 12.086, p = 0.007) Although this did not occur often, 20 second half of regular time. There was also a
differences were not significant but indicated strong when it did occur it had a better likelihood for a goal than significance in the number of players engaged in the
10
trends in the data (3). It takes on average 10 shots to just by chance, this can be seen in figure 1. play, this number was only one player therefore not
score a goal due to the distance, angle and space (4). 0 passing to any other teammates. From a coaching
This study will determine whether the coaching tactics First Half Second Half Beyond Full Total perspective, it is vital to always have players in the
that have previously been used still applies as well as the Time attacking 18 yard box to strive for that penalty kick
average of shots to goal ratio by using data from the which shows to be the best scoring opportunity
2002 World Cup. especially in the 2002 World cup.
Figure 2: Goals scored in each segment of the game
This study used notational analysis to examine
performance analysis of team sports. The specific
objectives consisted:
• Determine the patterns of shooting 40.7% (SR = 1.9) of the goals came from only one player
• Determine the most effective way to scoring making contact with the ball ( (2) = 6.206, p = .045).
Meaning that there was a trend towards one player who did
not pass the ball whilst in open play or off a stationary ball
situation. In saying that, 40.7% (SR = 1.9) had no passes
before a goal was scored ( ² (1) = 5.139, p = 0.23).
There were a fairly even spread of shots in each half with REFERENCES
47% of shots coming from first half and 51% from the
second half. Total amount of goals in each half can be • Savoie, R. & Chevrette, L., 1997, Coach and Athletic Director.,
seen in figure 2. This is not a full count due to extra time Vol. 67 Issue 5, p 14
and penalty shots if applied to those teams who made the
• Besier, T et al. Med Sci Sport Exercise. 33: 1168-1175, 2001
final stages of 2002 World Cup. Even though shots were
evenly matched amongst regular time, 53% of the goals • Hughes, M. Franks, I., 2005, Journal of Sports Sciences, Vol.
came from the second half. Compared to 34% of the goals 23 Issue 5. p. 509-514
coming from the first half. • Pollard R., Ensum J. & Taylor S., 2004, International Journal of
Google Images 2009 Soccer and Science, Vol. 2 Issue 1. p. 50-55
Figure 1: Goals scored from different zones.