Business Research Method - Unit II, AKTU, Lucknow Syllabus
•Download as PPTX, PDF•
5 likes•436 views

Business Research Methods, Unit II, AKTU, Lucknow Syllabus. Research Methodology, Topics Covered - Research design: Concept, Features of a good research design, Use of a good research design; Qualitative and Quantitative research approaches, Comparison – Pros and Cons of both approaches. Exploratory Research Design: Concept, Types: Qualitative techniques – Projective Techniques, Depth Interview, Experience Survey, Focus Groups, Observation. Descriptive Research Designs: Concept, types and uses. Concept of Cross-sectional and Longitudinal Research Experimental Design: Concept of Cause, Causal relationships, Concept of Independent & Dependent variables, concomitant variable, extraneous variable, Treatment, Control group.

Recommended
More Related Content
What's hot
What's hot (20)
Similar to Business Research Method - Unit II, AKTU, Lucknow Syllabus
Similar to Business Research Method - Unit II, AKTU, Lucknow Syllabus (20)
More from Kartikeya Singh
More from Kartikeya Singh (16)
Recently uploaded
Recently uploaded (20)
Business Research Method - Unit II, AKTU, Lucknow Syllabus
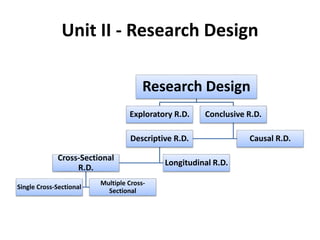
- 1. Unit II - Research Design Research Design Exploratory R.D. Conclusive R.D. Descriptive R.D. Cross-Sectional R.D. Single Cross-Sectional Multiple Cross- Sectional Longitudinal R.D. Causal R.D.
- 3. Various Methods of Research Design I. Research design in case of exploratory research studies • The main purpose of such studies is that of formulating a problem for more precise investigation or of developing the working hypotheses from an operational point of view. – the survey of concerning literature; – the experience survey and – the analysis of ‘insight-stimulating’ examples
- 4. • Exploratory research is carried out for a difficulty which has not been clearly defined. It helps in figuring out the best research design, data collection method and choice of subjects.
- 5. Exploratory Research Design • Initial research conducted to clarify and define the nature of a problem • Does not provide conclusive evidence • Subsequent research expected. • If not well defined: • Exploratory Research is used to clarify/define a problem • Case: Manager tells you “sales just aren’t what we expected for this kite” • Exploratory research is defined as the initial research into a hypothetical or theoretical idea. • This is where a researcher has an idea or has observed something and seeks to understand more about it.
- 6. Qualitative techniques • Projective Techniques • Depth Interview • Experience Survey • Focus Groups • Observation.
- 7. Projective Techniques – Word association tests- wat 500 words.pdf – Sentence completion tests - Projective TechniqueSentence Completion.jpg – Story completion tests - Projective Techniquestory-completion- projective-technique-5-728.jpg – Pictorial Techniques • Thematic apperception test (T.A.T.)Projective Techniquethematic- apperception-test-31-638.jpg • Rosenzweig test(24 Cartoons)Projective TechniqueRosenwig Test.jpg • Rorschach test (10 Inkblot) Projective TechniqueRorshach Test.png • Holtzman Inkblot Test (HIT)(45 Inkblot Cards)Projective TechniqueHIT.jpg • Tomkins-Horn picture arrangement test – (25 sets of three pictures )Projective TechniqueTomkins Horn.jpg – Quizzes, tests and examinations – Sociometry
- 8. Depth Interview • In-depth interviewing is a qualitative research technique that involves conducting intensive individual interviews with a small number of respondents to explore their perspectives on a particular idea, program, or situation. • Face to face • Emphasis on Body language • Listen rather than talk • Guided conversation • Is conducted using a discussion guide • Projective techniques can be incorporated into the interview too.
- 9. Experience Survey • An experience survey is a set of questions designed to gauge the overall satisfaction of a group of people who have shared a common experience. Businesses commonly distribute these surveys among customers, and educational institutions often distribute surveys among students. • multiple-choice questions • open-ended questions
- 10. Focus Groups • Focus groups were originally called "focused interviews" or "group depth interviews". • A focus group could be defined as a group of interacting individuals having some common interest or characteristics, brought together by a moderator, who uses the group and its interaction as a way to gain information about a specific or focused issue
- 11. Observation • Structured observation //Unstructured observation • Participant observation//non-participant observation//disguised observation • Controlled//uncontrolled observation
- 12. Descriptive Research Designs: • Concept, types and uses. • Concept of Cross-sectional and Longitudinal Research
- 13. Descriptive Research Designs: • Descriptive research design is a scientific method which involves observing and describing the behavior of a subject without influencing it in any way. • Many scientific disciplines, especially social science and psychology, use this method to obtain a general overview of the subject. • Give a detailed sketch or profile of the respondent population being studied. This might require a structured primary collation of the information to understand the concerned population.
- 14. Descriptive Research Designs: • Observational, defined as a method of viewing and recording the participants • Case study, defined as an in-depth study of an individual or group of individuals • Survey, defined as a brief interview or discussion with an individual about a specific topic.
- 15. Cross-Sectional Design • Both the cross-sectional and the longitudinal studies are observational studies. This means that researchers record information about their subjects without manipulating the study environment. • At Single time. • Example: A Danish Ice-Cream firm wants to find out how to target the Indian consumer to indulge in high end ice creams.
- 16. Cross-Sectional Design • Cohort Analysis: Multiple Sample groups at different time intervals, is called cohort studies. • Example: in the 9/11 case, if we study and compare the attitudes of middle-aged Americans versus teenaged Americans towards Asian-American, post the event. It would be cohort analysis.
- 17. Longitudinal Design • A longitudinal study, like a cross-sectional one, is observational. So, once again, researchers do not interfere with their subjects. • In a longitudinal study, researchers conduct several observations of the same subjects over a period of time, sometimes lasting many years. • Example:
- 18. Experimental Design • A blueprint of the procedure that enables the researcher to maintain control over all factors that may affect the result of an experiment. • In doing this, the researcher attempts to determine or predict what may occur. • Experimental research is often used where there is time priority in a causal relationship (cause precedes effect), there is consistency in a causal relationship (a cause will always lead to the same effect), and the magnitude of the correlation is great.
- 19. What do these studies tell you? • Experimental research allows the researcher to control the situation. In so doing, it allows researchers to answer the question, “What causes something to occur?” • Permits the researcher to identify cause and effect relationships. • Experimental research designs support the ability to limit alternative explanations and to infer direct causal relationships in the study. • Approach provides the highest level of evidence for single studies.
- 20. What these studies don't tell you? • The design is artificial, and results may not be generalize well to the real world. • The artificial settings of experiments may alter the behaviors or responses of participants. • Experimental designs can be costly if special equipment or facilities are needed. • Some research problems cannot be studied using an experiment because of ethical or technical reasons. • Difficult to apply ethnographic and other qualitative methods to experimentally designed studies.
- 21. Experimental Design • An experiment is generally used to infer a causality. In experiment, a researcher actively manipulates one or more causal variables and measures their effects on dependent variables. • Causality: • Sales Training Workforce Increased Sales Performance.
- 22. Necessary conditions for Making Causal Inferences • Concomitant Variation: It is the extent to which a cause X and effect Y occur together or vary together. • Time order of occurrence of Variables: This condition means that the causal variable must occur prior to or simultaneously with the effect variable. • Absence of other possible causal factors: The objective of an experiment is to measure the influence of the independent variable on a dependent variable while keeping the effect of other extraneous variables constant.
- 23. Concept Used in Experiments • Independent Variable: explanatory variable - treatment • Test Units: Test Units are those entities on which treatments are applied • Dependent Variable: These variables measure the effect of treatments(independent Variable) on the test units. • Experiment: To establish relationship between independent and dependent variable. • Extraneous Variable: Variables other than the independent variables which influence the response of test units to treatments.
- 24. Validity in Experimentation • For conducting an experiment, it is essential to specify: – Treatments – Test units to be used – Dependent variables to be measured – Procedure for dealing with the extraneous Variables.
- 25. Validity in Experimentation • To Draw valid conclusions about the effect of treatments(independent variables) on the dependent variables – Internal Validity. • To make generalizations about the results to a wider population – External Validity.
- 26. Definition and Symbols • X – the exposure of a test group to an experimental treatment whose effect is to be measured. • O – The measurement or observation of the dependent variable. • R – The random assignment of test units or groups to separate treatments. • The movement from left to right indicates the time sequence of events • All symbols in one row indicate that the subject belongs to that specific treatment group • Vertical arrangement of the symbols means that these symbols refers to the events or activities that occur simultaneously.
- 27. Definition and Symbols • Example: O1 X O2 O3 O1 = Measurement taken prior to applying treatment X. O2,O3 = measurement on the group taken after the application of the treatment.
- 28. Definition and Symbols • R O1 X O2 • R X O3 • The above scheme indicates that the two groups of individuals were assigned at random (R) to two treatment groups at the same time. • First group received both a pretest (O1) and post test (O2) measurement. • The second group received the post-test measurement (O3) at the same time as the first group received the post – test treatment (O2).
- 29. Factors affecting Internal Validity • History • Maturation • Testing – before presentation of the treatment • Measuring Instrumentation – change in value of money • Statistical Regression – Extreme performances. • Selection Bias – Selected on the judgement of the researcher. • Test Unit Mortality
- 30. Factors affecting External Validity • Environmental Change • Population Change • Duration Problem • Treatment change.
- 31. Classification of Experimental Design Experimental Design Pre experimental One Shot Case Study One Group Pre- test – Post Test Static Group Quasi Experimental Time Series Multiple Time Series True Experimental Pre-test-Post test Control Group Post-test-Only control Group Solomon Four Group Statistical Completely Randomised Randomised Blocks Latin Square Factorial
- 32. 1. Pre Experimental • One shot case study: X O • This means that only one test group is subjected to the treatment X and then a measurement on the dependent variable is taken O. • No random assignment • Assignment is done as per the choice of the researcher.
- 33. 1. Pre Experimental • One group pre-test-post-test design: • Before and after without control group design. O1 X O2 • The test units are subjected to the treatment X and both pretreatment (O1 ) and post- treatment measurement (O2) are taken. • Factors affecting it – History, Maturation, Testing, Instrumentation, Selection bias.
- 34. 1. Pre Experimental • Static Group Comparison: – Group 1: X O1 – Group 2: O2 • Two groups are tested and not randomly selected • First Group – Experimental Group is subjected to treatment. • Second Group – Control Group, is not subjected to the treatment. • Factors affecting the result – selection bias and mortality.
- 35. 2. Quasi Experimental Design • In this design the researcher can control when measurements are taken and on whom they are taken. • However, this design lacks complete control of scheduling of treatment and also lacks the ability to randomize test units exposure to treatments. • As the experimental control is lacking, the possibility of getting confounded results is very high.
- 36. 2. Quasi Experimental Design • Time Series design: • This involves a series of periodic measurements on the dependent variable for a group of test unit. The treatment X is then administered and series of periodic measurements are again taken to measure the effect of treatment • O1O2O3O4 X O5O6O7O8 • There is no randomization of treatment to the test units.
- 37. 2. Quasi Experimental Design • Time Series design: • Because of the multiple observations in time series design, the effect of maturation, main testing effect, instrumentation and statistical regression can be ruled out. • Drawback of this experiment is the inability of a researcher to control the effect of history.
- 38. Graph
- 39. 2. Quasi Experimental Design • Multiple Time Series Design: • One more group called the ‘control group’ is added to the time series design. The design may be diagrammed symbolically as: • Experimental Group: O1O2O3O4 X O5O6O7O8 • Control Group: O1O2O3O4 O5O6O7O8 • Major drawback of this design is the possibility of the interactive effect in experiment group.
- 40. 3. True Experiment Designs • In this researchers can randomly assign units and treatments to an experimental group. • Here the researcher is able to eliminate the effect of extraneous variables from both the experimental and control group. • Randomization procedure allows the researcher the use of statistical techniques for analyzing the experimental results.
- 41. 3. True Experiment Designs • Pre – Test – Post – Test Control Group: • Experimental Group : R O1 X O2 • Control Group : R O3 O4 • Random Selection has taken place. • Extraneous Variable act significantly. • Only difference in the two groups is the effect of treatment in the experimental group. • A = O2 - O1 = Treatment + Extraneous Variable • B = O4 - O3 = Extraneous Variable. • A – B = (O2 - O1) – (O4 - O3) • It is doubtful to generalize the result. Extraneous Variable – history, maturation, testing, instrumentation, statistical regression, selection bias and test unit mortality.
- 42. 3. True Experiment Designs • Post – Test – only control group design: • Experimental Group: R X O1 • Control Group: R O2 • Random Selection • O1 – O2 = (Treatment effect + Extraneous Factors) – (Extraneous Factors) = Treatment Effect. • Test unit mortality affects each group equally. One can always justify these assumptions by taking a large randomized sample. This design is widely used in marketing research.
- 43. 3. True Experiment Designs Solomon four-group design: This design is also called four – group six-study design. • This is also referred to as ‘ideal controlled experiment’. As will be seen, this design helps the researcher to remove the influence of extraneous variables and also that of the interactive testing effect. This design is symbolically presented as: • Experiment Group1: R O1 X O2 • Control Group1: R O3 O4 • Experiment Group2: R X O5 • Control Group2 : R O6
- 44. 3. True Experiment Designs Solomon four-group design: • Experiment Group1 • O2 – O1 = Treatment effect + Extraneous factors without interactive testing effect + interactive testing effect ….(i) • Control Group1 • O4 – O3 = Extraneous factors without interactive testing effect. (no interactive testing effect) ….(ii)
- 45. 3. True Experiment Designs Solomon four-group design: • Experimental Group 2: • O5 – O1 = Treatment effect + extraneous factors without interactive testing effect. …..(iii) • O5 – O3 = Treatment effect + extraneous factors without testing. …...(iv) • As there was actually no pre-test measurement, the interactive testing effect cannot occur here. • Control Group2: • O6 – O1 = Extraneous factors without testing effect. ….(v) • O6 – O3 = Extraneous factors without testing effect. ….(vi) • Would only give effect of extraneous factors. *As the group was not subjected to any treatment, so no testing effect or interactive effect.
- 46. 3. True Experiment Designs • By taking the average of (v) and (vi) one gets: • O2 – (O1 + O3) 𝟐 = (Extraneous Factors without testing effect.) …..(vii) • By taking average of (iii) and (iv), one obtains • O5 - (O1 + O3) 𝟐 = (Treatment Effect + extraneous factors without testing effect).(viii) • By subtracting (vii) from (viii) • O5 - (O1 + O3) 𝟐 - O2 – (O1 + O3) 𝟐 = O5 – O6 • = Treatment Effect
- 47. 3. True Experiment Designs • By subtracting (viii) from (i) • O2 – O1 - O5 - (O1 + O3) 𝟐 = Interacting testing effect • This design has helped not only in measuring the effect of treatment, but also in obtaining magnitude of the interactive testing effect and extraneous factors. • It is a costly affair – so rarely used • This design guarantees maximum internal validity. • For business where cause and effect relationship is very crucial for survival, this design is useful.
- 48. 4. Statistical Design • Statistical design allow for statistical control and analysis of external variables. The main advantages of statistical design are the following: – The effect of more than one level of independent variable on the dependent variable can be manipulated. – The effect of more than one independent variable can be examined – The effect of specific extraneous variable can be controlled.
- 49. 4. Statistical Design • Completely Randomized Design: • This design is used when a researcher is investigating the effect of one independent variable on the dependent variable. • The independent variable is required to be measured in nominal scale. • Each of the categories of the independent variable is considered as the treatment. • The basic assumption of this design is that there are no differences in the test units. • There are no extraneous variables that could influence the outcome.
- 50. 4. Statistical Design • Example: Sales of a particular goods is influenced by the price of that goods. • Sales – Dependent variable. • Price – Independent Variable. • Let there be three level of price – high, medium and low. • We have to measure at which price level the sales is highest. • Average mean. • Variance - ANOVA
- 51. 4. Statistical Design • This design suffers from the main limitation that it does not take into account the effect of extraneous variables on the dependent variable. • Different stores are the test unit where different price level was implemented. • The extraneous variable in the present example may be size of the store, the competitor’s price and price of the substitute product in question. • The assumption of the effect of extraneous variable may not be true. • The design is very simple and inexpensive to conduct.
- 52. 4. Statistical Design • Randomized Block Design: In this randomized block design it is possible to separate the influence of one extraneous variable on a particular dependent variable, thereby providing a clear picture of the impact of treatment on test units. • Example: 12 stores of different sizes like small, medium, large • Price Level – Low, Medium and High.
- 53. 4. Statistical Design Small Store 1 2 3 4 5 6 7 8 9 10 11 12 Low Medium High Medium Store 1 2 3 4 5 6 7 8 9 10 11 12 Low Medium High Large Store 1 2 3 4 5 6 7 8 9 10 11 12 Low Medium High
- 54. 4. Statistical Design • Latin Square Design: Store Size Packaging 1 2 3 1(Small) X1 X2 X3 2(Medium) X2 X3 X1 3(Large) X3 X! X2 Price - X1= Low. X2 = Medium. X3 = High.
- 55. 4. Statistical Design • Factorial Design Store Small(B1) Big(B2) Low(A1) Medium(A2) Large(A3)
Editor's Notes
- Different research designs can be conveniently described if we categorize them as: research design in case of exploratory research studies; research design in case of descriptive and diagnostic research studies, and research design in case of hypothesis-testing research studies. We take up each category separately. 1. Research design in case of exploratory research studies: Exploratory research studies are also termed as formulative research studies. The main purpose of such studies is that of formulating a problem for more precise investigation or of developing the wopoint of view. The major emphasis in such studies is on the discovery of ideas and insights. As such the research design appropriate for such studies must be flexible enough to provide opportunity for considering different aspects of a problem under study. Inbuilt flexibility in research design is needed because the research problem, broadly defined initially, is transformed into one with more precise meaning in exploratory studies, which fact may necessitate changes in the research procedure for gathering relevant data. Generally, the following three methods in the context of research design for such studies are talked about: the survey of concerning literature; the experience survey and (c) the analysis of ‘insight-stimulating’ examples. The survey of concerning literature happens to be the most simple and fruitful method of formulating precisely the research problem or developing hypothesis. Hypotheses stated by earlier workers may be reviewed and their usefulness be evaluated as a basis for further research. It may also be considered whether the already stated hypotheses suggest new hypothesis. In this way the researcher should review and build upon the work already done by others, but in cases where hypotheses have not yet been formulated, his task is to review the available material for deriving the relevant hypotheses from it. Besides, the bibliographical survey of studies, already made in one’s area of interest may as well as made by the researcher for precisely formulating the problem. He should also make an attempt to apply concepts and theories developed in different research contexts to the area in which he is himself working. Sometimes the works of creative writers also provide a fertile ground for hypothesis formulation and as such may be looked into by the researcher. Experience survey means the survey of people who have had practical experience with the problem to be studied. The object of such a survey is to obtain insight into the relationships between variables and new ideas relating to the research problem. For such a survey people who are competent and can contribute new ideas may be carefully selected as respondents to ensure a representation of different types of experience. The respondents so selected may then be interviewed by the investigator. The researcher must prepare an interview schedule for the systematic questioning of informants. But the interview must ensure flexibility in the sense that the respondents should be allowed to raise issues and questions which the investigator has not previously considered. Generally, the experience collecting interview is likely to be long and may last for few hours. Hence, it is often considered desirable to send a copy of the questions to be discussed to the respondents well in advance. This will also give an opportunity to the respondents for doing some advance thinking over the various issues involved so that, at the time of interview, they may be able to contribute effectively. Thus, an experience survey may enable the researcher to define the problem more concisely and help in the formulation of the research hypothesis. This survey may as well provide information about the practical possibilities for doing different types of research. Analysis of ‘insight-stimulating’ examples is also a fruitful method for suggesting hypotheses for research. It is particularly suitable in areas where there is little experience to serve as a guide. This method consists of the intensive study of selected instances of the phenomenon in which one is interested. For this purpose the existing records, if any, may be examined, the unstructured interviewing may take place, or some other approach may be adopted. Attitude of the investigator, the intensity of the study and the ability of the researcher to draw together diverse information into a unified interpretation are the main features which make this method an appropriate procedure for evoking insights. Now, what sort of examples are to be selected and studied? There is no clear cut answer to it. Experience indicates that for particular problems certain types of instances are more appropriate than others. One can mention few examples of ‘insight-stimulating’ cases such as the reactions of strangers, the reactions of marginal individuals, the study of individuals who are in transition from one stage to another, the reactions of individuals from different social strata and the like. In general, cases that provide sharp contrasts or have striking features are considered relatively more useful while adopting this method of hypotheses formulation. Thus, in an exploratory of formulative research study which merely leads to insights or hypotheses, whatever method or research design outlined above is adopted, the only thing essential is that it must continue to remain flexible so that many different facets of a problem may be considered as and when they arise and come to the notice of the researcher.
- Thematic apperception test (TAT) is a projective psychological test. Proponents of the technique assert that subjects' responses, in the narratives they make up about ambiguous pictures of people, reveal their underlying motives, concerns, and the way they see the social world. The Rorschach Inkblot Test is a projective psychological test consisting of 10 inkblots printed on cards (five in black and white, five in color) created in 1921 with the publication of Psychodiagnostik by Hermann Rorschach. During the 1940s and 1950s, the test was synonymous with clinical psychology. Throughout much of the 20th century, the Rorschach inkblot test was a commonly used and interpreted psychological test. In surveys in 1947 (Louttit and Brown The Holtzman Inkblot Technique (HIT) Based on the same underlying premise as the Rorschach, the HIT was constructed to be a psychometrically sound projective instrument. The test consists of two parallel forms (A and B), each composed of 45 inkblots with two additional trial blots identical in both test forms. Included are inkblots that are achromatic and chromatic. Unlike the Rorschach, which consists of symmetrical blots (similar on both sides), asymmetrical blots were also included in the HIT. Inkblot Perception and Personality (Holtzman, Thorpe, Swartz, & Herron, 1961) serves as a manual and a scoring guide for the test. The inkblots are presented one at a time to the subject, and (unlike the Rorschach) subjects are instructed to produce only one response per blot. A brief inquiry follows immediately, wherein the examiner seeks to determine where the percept was seen and the qualities of the blot that contributed to the forming of the percept.e) and 1961 (Sundberg), for instance, it was the fourth and first, respectively, most frequently used psychological test. Picture arrangement test is a psychological test performed by giving the subject pictures of a person with various facial expressions. The test consists of 25 sets of three pictures that the subject is asked to tell a story with by putting a card in sequence and writing a sentence about it. The test was created by Silvan Tomkins who used it to practice reading facial expressions by watching a recording of the story being told with no sound. Sociometry is a branch of the social sciences based on the work of Jacob L. Moreno, M.D. (1890-1974) which studies the formation and construction of groups and which features methods to describe and account for the interpersonal relations in groups. The degree of acceptance and rejection for others in specific roles is obtained, measured, and depicted in ways to facilitate open discussing of the individual's impact on the group's structure and cohesion, and the group's construction as it impacts the individual. Persons trained in sociometric methods focus on groups or team building, social networks, community, leadership, isolation, mutuality, incongruity, status, motivation and sociometric perception.
- How is a depth interview carried out? Depth interviews are normally carried out face to face so that a rapport can be created with respondents. Body language is also used to add a high level of understanding to the answers. Telephones can also be used by a skilled researcher with little loss of data and at a tenth of the cost. The style of the interview depends on the interviewer. Successful in-depth interviewers listen rather than talk. They have a clear line of questioning and use body language to build rapport. The interview is more of a guided conversation than a staccato question and answer session. The interview is conducted using a discussion guide which facilitates the flushing out of the respondent’s views through open ended questioning. Projective techniques can be incorporated into the interview too.
- Experience surveys are usually composed of two types of questions. The first are multiple-choice questions that allow participants taking the survey to rate their experiences on a scale or indicate their satisfaction levels by choosing from a list of responses. Many experience surveys also include open-ended questions in which individuals write short responses or expand on their answers in the multiple-choice section.
- Focus groups were originally called "focused interviews" or "group depth interviews". The technique was developed after World War II to evaluate audience response to radio programs (Stewart & Shamdasani, 1990). Since then social scientists and program evaluators have found focus groups to be useful in understanding how or why people hold certain beliefs about a topic or program of interest. A focus group could be defined as a group of interacting individuals having some common interest or characteristics, brought together by a moderator, who uses the group and its interaction as a way to gain information about a specific or focused issue. A focus group is typically 7-10 people who are unfamiliar with each other. These participants are selected because they have certain characteristics in common that relate to the topic of the focus group. The moderator or interviewer creates a permissive and nurturing environment that encourages different perceptions and points of view, without pressuring participants to vote, plan or reach consensus (Krueger, 1988). The group discussion is conducted several times with similar types of participants to identify trends and patterns in perceptions. Careful and systematic analysis of the discussions provide clues and insights as to how a product, service, or opportunity is perceived by the group.
- The essentials of action research design follow a characteristic cycle whereby initially an exploratory stance is adopted, where an understanding of a problem is developed and plans are made for some form of interventionary strategy. Then the intervention is carried out (the "action" in Action Research) during which time, pertinent observations are collected in various forms. The new interventional strategies are carried out, and this cyclic process repeats, continuing until a sufficient understanding of (or a valid implementation solution for) the problem is achieved. The protocol is iterative or cyclical in nature and is intended to foster deeper understanding of a given situation, starting with conceptualizing and particularizing the problem and moving through several interventions and evaluations. What do these studies tell you? This is a collaborative and adaptive research design that lends itself to use in work or community situations. Design focuses on pragmatic and solution-driven research outcomes rather than testing theories. When practitioners use action research, it has the potential to increase the amount they learn consciously from their experience; the action research cycle can be regarded as a learning cycle. Action research studies often have direct and obvious relevance to improving practice and advocating for change. There are no hidden controls or preemption of direction by the researcher. What these studies don't tell you? It is harder to do than conducting conventional research because the researcher takes on responsibilities of advocating for change as well as for researching the topic. Action research is much harder to write up because it is less likely that you can use a standard format to report your findings effectively [i.e., data is often in the form of stories or observation]. Personal over-involvement of the researcher may bias research results. The cyclic nature of action research to achieve its twin outcomes of action (e.g. change) and research (e.g. understanding) is time-consuming and complex to conduct. Advocating for change requires buy-in from participants. Definition and Purpose Cross-sectional research designs have three distinctive features: no time dimension; a reliance on existing differences rather than change following intervention; and, groups are selected based on existing differences rather than random allocation. The cross-sectional design can only measure differences between or from among a variety of people, subjects, or phenomena rather than a process of change. As such, researchers using this design can only employ a relatively passive approach to making causal inferences based on findings. What do these studies tell you? Cross-sectional studies provide a clear 'snapshot' of the outcome and the characteristics associated with it, at a specific point in time. Unlike an experimental design, where there is an active intervention by the researcher to produce and measure change or to create differences, cross-sectional designs focus on studying and drawing inferences from existing differences between people, subjects, or phenomena. Entails collecting data at and concerning one point in time. While longitudinal studies involve taking multiple measures over an extended period of time, cross-sectional research is focused on finding relationships between variables at one moment in time. Groups identified for study are purposely selected based upon existing differences in the sample rather than seeking random sampling. Cross-section studies are capable of using data from a large number of subjects and, unlike observational studies, is not geographically bound. Can estimate prevalence of an outcome of interest because the sample is usually taken from the whole population. Because cross-sectional designs generally use survey techniques to gather data, they are relatively inexpensive and take up little time to conduct. What these studies don't tell you? Finding people, subjects, or phenomena to study that are very similar except in one specific variable can be difficult. Results are static and time bound and, therefore, give no indication of a sequence of events or reveal historical or temporal contexts. Studies cannot be utilized to establish cause and effect relationships. This design only provides a snapshot of analysis so there is always the possibility that a study could have differing results if another time-frame had been chosen. There is no follow up to the findings. Cross-sectional study Both the cross-sectional and the longitudinal studies are observational studies. This means that researchers record information about their subjects without manipulating the study environment. In our study, we would simply measure the cholesterol levels of daily walkers and non-walkers along with any other characteristics that might be of interest to us. We would not influence non-walkers to take up that activity, or advise daily walkers to modify their behaviour. In short, we’d try not to interfere. The defining feature of a cross-sectional study is that it can compare different population groups at a single point in time. Think of it in terms of taking a snapshot. Findings are drawn from whatever fits into the frame. To return to our example, we might choose to measure cholesterol levels in daily walkers across two age groups, over 40 and under 40, and compare these to cholesterol levels among non-walkers in the same age groups. We might even create subgroups for gender. However, we would not consider past or future cholesterol levels, for these would fall outside the frame. We would look only at cholesterol levels at one point in time. The benefit of a cross-sectional study design is that it allows researchers to compare many different variables at the same time. We could, for example, look at age, gender, income and educational level in relation to walking and cholesterol levels, with little or no additional cost. However, cross-sectional studies may not provide definite information about cause-and-effect relationships. This is because such studies offer a snapshot of a single moment in time; they do not consider what happens before or after the snapshot is taken. Therefore, we can’t know for sure if our daily walkers had low cholesterol levels before taking up their exercise regimes, or if the behaviour of daily walking helped to reduce cholesterol levels that previously were high. Longitudinal study A longitudinal study, like a cross-sectional one, is observational. So, once again, researchers do not interfere with their subjects. However, in a longitudinal study, researchers conduct several observations of the same subjects over a period of time, sometimes lasting many years. The benefit of a longitudinal study is that researchers are able to detect developments or changes in the characteristics of the target population at both the group and the individual level. The key here is that longitudinal studies extend beyond a single moment in time. As a result, they can establish sequences of events. To return to our example, we might choose to look at the change in cholesterol levels among women over 40 who walk daily for a period of 20 years. The longitudinal study design would account for cholesterol levels at the onset of a walking regime and as the walking behaviour continued over time. Therefore, a longitudinal study is more likely to suggest cause-and-effect relationships than a cross-sectional study by virtue of its scope. In general, the research should drive the design. But sometimes, the progression of the research helps determine which design is most appropriate. Cross-sectional studies can be done more quickly than longitudinal studies. That’s why researchers might start with a cross-sectional study to first establish whether there are links or associations between certain variables. Then they would set up a longitudinal study to study cause and effect. One example of this progression can be found in an Institute for Work & Health (IWH) project on the links between computer work and musculoskeletal disorders (MSDs) at a large newspaper. This project began with a cross-sectional study, aimed at exploring the links between injuries and different characteristics of the job (e.g. work stress) or of the worker (e.g. the social support he or she had at work). Knowing which links were strongest helped the researchers develop theories to test. In the next study, a longitudinal one, they studied changes in workers’ MSD symptoms over time. That study gave the researchers a better understanding of the cause-and-effect relationship between MSD symptoms and work/worker characteristics, which in turn lay the groundwork for intervention studies down the line.
- http://libguides.usc.edu/writingguide/researchdesigns
- A blueprint of the procedure that enables the researcher to maintain control over all factors that may affect the result of an experiment. In doing this, the researcher attempts to determine or predict what may occur. Experimental research is often used where there is time priority in a causal relationship (cause precedes effect), there is consistency in a causal relationship (a cause will always lead to the same effect), and the magnitude of the correlation is great. The classic experimental design specifies an experimental group and a control group. The independent variable is administered to the experimental group and not to the control group, and both groups are measured on the same dependent variable. Subsequent experimental designs have used more groups and more measurements over longer periods. True experiments must have control, randomization, and manipulation. What do these studies tell you? Experimental research allows the researcher to control the situation. In so doing, it allows researchers to answer the question, “What causes something to occur?” Permits the researcher to identify cause and effect relationships between variables and to distinguish placebo effects from treatment effects. Experimental research designs support the ability to limit alternative explanations and to infer direct causal relationships in the study. Approach provides the highest level of evidence for single studies. What these studies don't tell you? The design is artificial, and results may not generalize well to the real world. The artificial settings of experiments may alter the behaviors or responses of participants. Experimental designs can be costly if special equipment or facilities are needed. Some research problems cannot be studied using an experiment because of ethical or technical reasons. Difficult to apply ethnographic and other qualitative methods to experimentally designed studies.
- Confounded – bewildered, confused, perplexed.
- Pre-test manipulation interaction bias is present when the pre-testing in an experiment heightens participants’ sensitivity and makes them behave in a systematically different way during the experiment that prevents the results being generalised to a population of interest (i.e. it reduces external validity).