Hidden lives v2
•Als PPT, PDF herunterladen•
0 gefällt mir•788 views

PowerPoint on Galaxies

Empfohlen
Empfohlen
Weitere ähnliche Inhalte
Was ist angesagt?
Was ist angesagt? (20)
Andere mochten auch
Andere mochten auch (14)
Ähnlich wie Hidden lives v2
Ähnlich wie Hidden lives v2 (20)
Kürzlich hochgeladen
Kürzlich hochgeladen (20)
Hidden lives v2
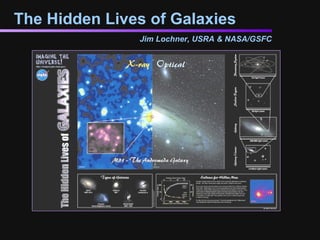
- 1. The Hidden Lives of Galaxies Jim Lochner, USRA & NASA/GSFC
- 2. What is a Galaxy ? Solar System Distance from Earth to Sun = 93,000,000 miles = 8 light-minutes Size of Solar System = 5.5 light-hours
- 3. What is a Galaxy? Stellar Region 30 light-years Sun (solar system too small to be seen on this scale)
- 4. What is a Galaxy? Galaxy 200,000 light-years a massive collection of stars, gas, and dust kept together by gravity Sun’s Stellar Region
- 5. What is a Galaxy? If our solar system was the size of a cell in the human body, our galaxy would still measure over one mile across.
- 6. Types of Galaxies Spiral Barred Spiral Elliptical Irregular Peculiar disk-like appearance with arms of stars and dust forming a spiral pattern similar to spirals but with a bright bar of stars and gas through the center elliptically-shaped, with less gas and dust than spirals; no disk or “arms” neither elliptical nor spiral in shape; gas and dust as in spirals but no defined “arms” distorted form of one of the above types, often due to collision with another galaxy or similar catastrophic event
- 7. The Hidden Lives of Galaxies
- 8. Galaxy Formation Galaxies form from the primordial density fluctuations that arise after the big bang and grow under inflation. These density fluctuations form filaments, and galaxies form in knots along the filaments.
- 11. Spirals in Grazing Encounter
- 13. “ Invisible” Light from Galaxies Electromagnetic Spectrum
- 14. “ Invisible” Light from Galaxies
- 16. Hidden Mass in Galaxies This X-ray image of an elliptical galaxy reveals hot, fast-moving gas even in the outer reaches of the galaxy. The visible mass of the galaxy is insufficient to hold onto it. (The dark circle shows the size of the galaxy when photographed in visible light. The X-ray image shows mass far outside the visible image.)
- 20. Hidden Mass in Galaxies Rotation Curve - A Plot of Object Velocity vs. Distance Our Solar System
- 21. Activity #6a: Evidence for Hidden Mass There are ____ solar system planets presented on the graph. The planets, from the closest to the sun to the furthest, are ___________________________________ ______________________________. Using the graph, the velocities of the solar system planets, from the lowest value to the highest value, are _____________________ _________________________. Using the graph, the distances of the planets from the Sun are, from least to greatest, ____________________________________ ______________. In general, the further a planet is from the sun the ______ its velocity. The closer a planet is to the sun ______ its velocity. nine Mercury, Venus, Earth, Mars, Jupiter, Saturn, Uranus, Neptune, and Pluto approximately 48, 35, 30, 24, 13, 10, 7, 5, and 4 km/sec 0, 110, 150, 250, 800, 1500, 2800, 4500, and 6000 million km slower faster
- 22. Hidden Mass in Galaxies Rotation Curve - A Plot of Object Velocity vs. Distance Our Solar System
- 24. Activity 6b, part 1 2.0 x 10 30 2.0 x 10 30 2.0 x 10 30
- 26. Hidden Mass in Galaxies What we expect for a galaxy if all the mass was concentrated in the central region. Compare expected velocities with actual velocities
- 28. Activity 6b, part 2 2.1 x 10 40 5.6 x 10 40 8.4 x 10 40
- 32. The Hidden Lives of Galaxies Presentation available at http://imagine.gsfc.nasa.gov/docs/teachers/galaxies/galaxies.html
Hinweis der Redaktion
- In this presentation, we’ll discuss the information about galaxies contained in “The Hidden Lives of Galaxies” poster and information booklet. We’ll also do a couple of classroom activities discussed in the booklet This version of the presentation includes information on galaxy formation, and has expanded approach for determining that galaxies have hidden mass [An image of the poster and text of the booklet are available on-line at http://imagine.gsfc.nasa.gov/docs/teachers/galaxies/galaxies.html] This version was uploaded to the Imagine site on 8/28/03 under the name Hidden_Lives_v2.ppt
- To define what a galaxy is, we start with something close to home - our own solar system - and its place in our galaxy. The distance from the Earth to the Sun is 93 million miles (150 million km), or 8 light-minutes. That is, the time it takes light from the sun to reach Earth is 8 minutes. The entire solar system is 5.5 light-hours across. That is, light takes 5.5 hours to cross the solar system.
- Neighboring stars can be grouped into stellar regions. The solar neighborhood is about 30 light-years across. A light year is the distance light travels in one year, and is about 6 trillion miles (9.5 trillion km) [Note that in some regions stars can be clustered quite closely together. Thus, some neighborhoods may be more crowded than others.]
- A stellar region is just a small portion of a galaxy. A galaxy is a massive collection of stars, gas, and dust held together by its own gravity. Galaxies can range in size from 6,000 to 350,000 light-years across. Our own galaxy, the Milky Way, is about 105,000 light-years in diameter. The galaxy pictured here is the Andromeda Galaxy, which is the nearest large galaxy to our own. We think the Milky Way looks very much like Andromeda.
- Galaxies are enormous in size. This slide shows the scale of our galaxy by analogy to the size of a cell in the human body. [A cell in the human body is about 50 microns (or 0.00005 meters) across.] Using this same analogy, the Andromeda Galaxy would be 22 miles away.
- There are different types of galaxies, each with different characteristics. This slide presents the different galaxy types and their major features, one at time. The slide ends by showing a few additional examples of each type of galaxy. [This version works properly in Powerpoint for Mac OS X. The large image of the galaxy is now grouped with its descriptive text.]
- At this point, participants can perform Activity #2 from “The Hidden Lives of Galaxies” booklet to test their knowledge of the types of galaxies. Use Transparencies #1 and #2 which accompany the booklet or which are available on the Imagine the Universe! website at http://imagine.gsfc.nasa.gov/docs/teachers/galaxies/transparencies/
- This is according to http://zeus.ncsa.uiuc.edu:8080/Summers/galform.html Note that a bottom up theory still exits. Matter clumps on smaller scales and then becomes bound together into a galaxy.
- Gas dissipates energy through collisions. Atoms in gas collide and heat up. The heat is dissipated in the infrared. The gas thus loses energy and collapses. If stars form quickly, then galaxy becomes elliptical. Angular momentum forms the gas into a disk. In ellipticals, gas hasn’t had time to collapse into a disk, and stars retain their initial orbits. If star formation proceeds more slowly, then the gas undergoes collisions and forms a disk under conservation of angular momentum. The stars don’t form until gas has collapsed into the disk. Globular clusters seem to form in the first epoch of star formation, just as the galaxies are forming. From http://zebu.uoregon.edu/~js/ast123/lectures/lec27.html
- Mergers occur because the universe is actually pretty crowded ! From http://stardate.org/resources/galaxy/formation.html: “Mergers are common because the universe is crowded, at least on the galactic distance scale. The disk of the Milky Way, for example, spans about 100,000 light-years; the nearest major galaxy, the great spiral in Andromeda, lies about two million light-years away. That means the distance between these two galaxies is only about 20 times greater than the sizes of the galaxies themselves. That doesn't leave a lot of "elbow room" for galaxies.” See http://www.strw.leidenuniv.nl/~dokkum/mergers/info_eng.txt for nifty info about mergers. E.g it can take only a billion years for a merger to be complete.
- From http://heritage.stsci.edu/1999/41/index.html Calculations indicate that IC 2163 is swinging past NGC 2207 in a counterclockwise direction, having made its closest approach 40 million years ago. However, IC 2163 does not have sufficient energy to escape from the gravitational pull of NGC 2207, and is destined to be pulled back and swing past the larger galaxy again in the future. They are destined to merge in the next few billion years. NGC 2207 has a diameter of 143,000 light years (44 kpc or 4'). IC 2163 has a diameter of 101,000 light years (31 kpc or 3'). They are 114 million light years (35 megaparsecs) away
- The collision of these two galaxies sparks star formation (via collision of gas clouds) http://hubblesite.org/newscenter/archive/1997/34/ From the figure caption: The Hubble telescope has uncovered over 1,000 bright; young star clusters bursting to life in a brief, intense, brilliant "fireworks show" at the heart of a pair of colliding galaxies. The picture on the left provides a sweeping view of the two galaxies, called the Antennae. The green shape pinpoints Hubble's view. Hubble's close-up view [right] provides a detailed look at the "fireworks" at the center of this wreck. The respective cores of the twin galaxies are the orange blobs, left and right of center, crisscrossed by filaments of dark dust. A wide band of chaotic dust stretches between the cores of the two galaxies. The sweeping spiral-like patterns, traced by bright blue star clusters, are the result of a firestorm of star birth that was triggered by the collision.
- Light is not only what we see with our eyes, but also comes in the form of radio waves, microwaves, infrared, ultraviolet, x-rays and gamma-rays. This figure shows common images representing the major portions of the spectrum. The gradations on the gray scale represent the changing wavelength of light as it goes from gamma-ray to radio. Astronomers use different regions of the e-m spectrum to determine different properties of objects. We often don’t get the whole picture until we look at an object in different wavelengths. Note that the X-ray image is not like the other images. The other images show the objects that emit that particular radiation. The medical x-ray show what is absorbed by the x-rays.
- An X-ray picture of a galaxy looks very different from an optical picture. On the right is an optical picture of the Andromeda Galaxy. Note the familiar spiral structure, and the dark lanes of dust. On the left is an x-ray image of the Andromeda Galaxy taken by the ROSAT satellite. We no longer see the spiral structure, but instead individual objects. The inset shows a close-up of the central region of the Andromeda Galaxy taken by the Chandra X-ray Observatory. Again we see individual sources. But in both the Chandra and ROSAT images, we also see diffuse x-ray emission caused by hot gas.
- These are some of the objects that emit x-rays in a galaxy: - Stars, like our Sun, emit X-rays from their hot coronas and active regions. - A Supernova Remnant is the remains of a massive star that has exploded. The explosion emits a shock wave that heats up surrounding gas. The gas becomes hot enough to glow in X-rays. - X-ray Binaries are star systems that consist of a normal star and a compact object such as a white dwarf, neutron star, or black hole. The compact object is what remains from a star after a supernova explosion. Material from the normal star flows toward the compact star, forming a disk of material around the compact star. As it nears the compact star, the gas in this disk becomes hot enough to emit x-rays. - Hot Gas permeates the galaxy and can surround a galaxy.
- A number of elliptical galaxies are observed to have hot gas beyond the visible limits of the galaxy. The temperature of the gas is a measure of its velocity and energy. This gas is so hot (about 10 million degrees Kelvin, or 18 million degrees F), and consequently has such a high velocity, that it first appears to be escaping from the galaxy. Indeed, the amount of visible mass in the galaxy is insufficient to keep it from escaping. We know the gas is bound to the galaxy, because if it wasn’t it would have dissipated long ago. Hence, there must be some other matter that lies undetected in the galaxy. This additional matter gives the galaxy enough mass to hold onto the gas. This “hidden mass” is also known to astronomers as “dark matter”.
- To further understand the evidence for hidden mass in galaxies, we go back to examining our own solar system. We first plot the velocity of the planets in their orbits around the sun (right hand vertical scale, in yellow) as a function of their distance from the sun (bottom scale, in yellow). This type of plot is known as a Rotation Curve. Ask audience members to describe how the velocity of the planets varies as the distance from the sun varies [as the distance increases, the velocity decreases]. You can use this slide with the following slide (on Activity 6a). May work best with this as a separate transparency on an overhead.
- To better familiarize themselves with the rotation curve of the solar system, participants now perform the first part of Activity #6a in “The Hidden Lives of Galaxies Booklet.” Use Transparency #6 which accompanies the booklet or which is available on the Imagine the Universe! website at http://imagine.gsfc.nasa.gov/docs/teachers/galaxies/transparencies/ When participants are done, the presenter uses this slide to fill in the answers.
- To further understand the evidence for hidden mass in galaxies, we go back to examining our own solar system. We first plot the velocity of the planets in their orbits around the sun (right hand vertical scale, in yellow) as a function of their distance from the sun (bottom scale, in yellow). This type of plot is known as a Rotation Curve. Ask audience members to describe how the velocity of the planets varies as the distance from the sun varies [as the distance increases, the velocity decreases]. The curve described is exactly that expected from Newton’s Law of Gravity.
- We now compare the rotation curve for the solar system to that of a galaxy. Here we plot the velocities of stars going around the center of the galaxy (left hand vertical scale, in white) vs. their distance from the center of the galaxy (top scale, in white). “Kpc” stands for “kiloparsecs”, a distance used to measure large distances in galaxies (1 kpc = 3,260 light-years). We expect the rotation curve of a galaxy to be linear through the central bulge. This is because the central bulge rotates as a solid body. Outside the bulge, we expect the rotation curve to fall off with distance according to Newton’s Law of Gravity (similar to the solar system). Now show the actual rotation curve for a galaxy. Again, ask audience members to describe how the velocity varies as a function of distance [it rises steadily, and then at 10 kpc it becomes nearly constant]. We find that the velocities continue to rise outside the bulge, and eventually flatten out. The fact that velocities don’t follow Newton’s Gravity means that there is more mass in the galaxy than we can account for.
- From observations of hot gas in galaxies and data from the Rotation Curves, we conclude that gas and stars in galaxies are moving faster than what we would expect from the visible mass of the galaxy. Note that by “visible”, we mean here mass detected at all wavelengths of the e-m spectrum, and not just optical. We find that only 10 % of the mass of the galaxy is detectable. WMAP results from Feb 2003 show that 4% of the universe is ordinary matter, 235 is cold dark matter, and 73% is dark energy.
- Scientists have various candidates for what the hidden mass in galaxies could be. Hydrogen gas is abundant in galaxies, but there is still not enough of it. Massive Compact Halo Objects are objects such as black holes, neutron stars and brown dwarfs. Again, there just aren’t enough of them. The best candidate is Weakly Interacting Massive Particles. These are as yet undiscovered sub-atomic particles that interact weakly with normal matter but yet have mass. This is currently a very active field of particle physics and cosmology.
- In this presentation, we’ll discuss the information about galaxies contained in “The Hidden Lives of Galaxies” poster and information booklet. We’ll also do a couple of classroom activities discussed in the booklet This version of the presentation includes information on galaxy formation, and has expanded approach for determining that galaxies have hidden mass [An image of the poster and text of the booklet are available on-line at http://imagine.gsfc.nasa.gov/docs/teachers/galaxies/galaxies.html]