Toronto real estate statistics november 2010
•
0 gefällt mir•279 views

Toronto Real Estate Market. Statistics and raw data for the entire GTA. Sales, new and active listings, average and median prices. Source Toronto Real Estate Board.

Empfohlen
Weitere ähnliche Inhalte
Was ist angesagt?
Was ist angesagt? (10)
Andere mochten auch
Ähnlich wie Toronto real estate statistics november 2010
Ähnlich wie Toronto real estate statistics november 2010 (19)
Mehr von John Helfrich
Mehr von John Helfrich (15)
Kürzlich hochgeladen
Kürzlich hochgeladen (20)
Toronto real estate statistics november 2010
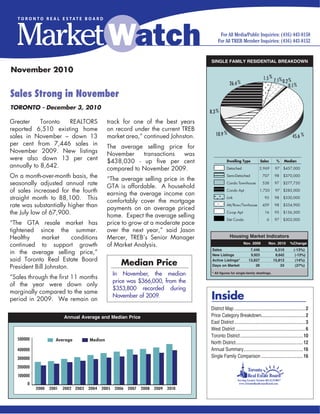
- 1. SINGLE FAMILY RESIDENTIAL BREAKDOWN November 2010 1.5 % 7.1% % 26.4 % 0.2 0.1 % Sales Strong in November TORONTO - December 3, 2010 8.3 % Greater Toronto REALTORS track for one of the best years reported 6,510 existing home on record under the current TREB sales in November – down 13 market area,” continued Johnston. 10.9 % 45.6 % per cent from 7,446 sales in The average selling price for November 2009. New listings November transactions was were also down 13 per cent $438,030 - up five 7.0 2.3 per cent % Dwelling Type Sales % Median % annually to 8,642. 21.5 % compared to November 2009. 0.3 0.1 % % Single Detached 2,969 Detached 97 $457,000 On a month-over-month basis, the “The average selling price in the Semi Detached Semi-Detached 707 98 $370,000 seasonally adjusted annual rate Condo T.H. Condo Townhouse 538 97 $277,750 GTA is affordable. A household of sales increased for the fourth earning the average income can 8.5 % Condo Apt. Condo Apt 1,720 97 $285,000 straight month to 88,100. This Link Link 95 98 $330,000 comfortably cover the mortgage rate was substantially higher than payments on an average priced Attached/Row Att/Row/Twnhouse 459 98 $354,900 the July low of 67,900. 12.0 home. Expect the average selling % 48.3 % Co-op Apt. Co-op Apt 16 95 $156,500 Detached Condo Det Condo 6 97 $303,000 “The GTA resale market has price to grow at a moderate pace tightened since the summer. over the next year,” said Jason Healthy market conditions Mercer, TREB’s Senior Manager Housing Market Indicators continued to support growth of Market Analysis. AuguNovNov. 2009 Nov. 2010 %Change Sales 7,446 6,510 (-13%) in the average selling price,” New Listings 9,923 8,642 (-13%) said Toronto Real Estate Board President Bill Johnston. Median Price Active Listings* Days on Market 13,827 26 15,813 33 (14%) (27%) In November, the median * All figures for single-family dwellings. “Sales through the first 11 months price was $366,000, from the of the year were down only $353,800 recorded during marginally compared to the same period in 2009. We remain on November of 2009. Inside District Map ............................................................. 2 Annual Average and Median Price Price Category Breakdown......................................2 East District ............................................................. 3 West District ............................................................ 6 Toronto District ......................................................10 500000 Average Median North District..........................................................12 400000 Annual Summary ...................................................16 300000 Single Family Comparison ....................................16 200000 100000 0 2000 2001 2002 2003 2004 2005 2006 2007 2008 2009 2010
- 2. District Map Price Category Breakdown - November 2010 Price Range Total S.F.D %S.F.D Condo Apt. %Condo Apt. Condo T.H. %Condo T.H. - - $90,000 30 0.5 16 0.9 4 0.7 $90,001 - $100,000 8 0.1 7 0.4 1 0.2 $100,001 - $110,000 16 0.2 13 0.8 2 0.4 $110,001 - $120,000 16 0.2 10 0.6 2 0.4 $120,001 - $130,000 24 0.4 14 0.8 1 0.2 $130,001 - $140,000 35 0.5 23 1.3 7 1.3 $140,001 - $150,000 47 0.7 31 1.8 8 1.5 $150,001 - $160,000 55 0.8 38 2.2 9 1.7 $160,001 - $170,000 69 1.1 40 2.3 16 3.0 $170,001 - $180,000 76 1.2 37 2.2 12 2.2 $180,001 - $190,000 72 1.1 37 2.2 15 2.8 $190,001 - $200,000 80 1.2 52 3.0 11 2.0 $200,001 - $225,000 253 3.9 131 7.6 57 10.6 $225,001 - $250,000 377 5.8 157 9.1 63 11.7 $250,001 - $300,000 851 13.1 340 19.8 100 18.6 $300,001 - $400,000 1,804 27.7 483 28.1 162 30.1 $400,001 - $500,000 1,140 17.5 161 9.4 35 6.5 $500,001 - $750,000 1,041 16.0 102 5.9 26 4.8 $750,001 - $1,000,000 256 3.9 10 0.6 5 0.9 $1,000,001 - $1,500,000 164 2.5 9 0.5 1 0.2 $1,500,001 - - 96 1.5 9 0.5 1 0.2 Total: 6,510 100 1,720 100 538 100 2 TORONTO REAL ESTATE BOARD
- 3. East District Current Month: November 2010 Area Active New Sales $ Volume Avg Price Med Price Avg DOM Avg %List E01 126 119 67 $33,035,345 $493,065 $490,000 22 100 E02 107 69 62 $39,831,351 $642,441 $569,000 18 98 E03 196 125 104 $40,640,100 $390,770 $384,500 24 98 E04 160 109 76 $22,605,788 $297,445 $304,000 28 98 E05 116 70 73 $24,514,700 $335,818 $282,000 30 98 E06 102 66 43 $19,712,295 $458,425 $377,000 20 99 E07 120 78 78 $25,222,600 $323,367 $328,000 35 98 E08 201 99 58 $20,512,937 $353,671 $335,500 31 98 E09 206 103 88 $25,140,788 $285,691 $273,500 36 97 E10 79 53 26 $10,148,888 $390,342 $382,000 23 98 E11 200 94 63 $17,773,250 $282,115 $270,000 36 97 E12 34 28 23 $7,674,100 $333,657 $300,000 27 98 E13 136 92 74 $26,889,050 $363,366 $331,450 34 97 E14 257 169 117 $35,840,682 $306,331 $295,500 34 97 E15 226 145 97 $30,519,200 $314,631 $301,500 29 98 E16 558 288 181 $40,517,747 $223,855 $217,000 42 97 E17 236 139 72 $18,690,500 $259,590 $241,700 40 98 E18 21 7 6 $4,010,000 $668,333 $577,500 88 94 E19 59 37 37 $14,407,788 $389,400 $355,000 27 99 E20 103 28 17 $5,945,700 $349,747 $257,900 56 97 E21 118 41 37 $10,961,350 $296,253 $300,000 52 96 TOTAL 3,361 1,959 1,399 $474,594,159 $339,238 $311,000 33 98 Year-to-Date: November 2010 Area Listed Sales $ Volume Avg Price Med Price Avg DOM Avg %List E01 1,555 862 $419,195,871 $486,306 $460,850 16 102 E02 1,356 785 $478,065,768 $609,001 $536,900 15 101 E03 2,191 1,173 $480,436,746 $409,579 $400,000 20 100 E04 1,616 857 $250,102,405 $291,835 $310,000 26 98 E05 1,648 981 $336,593,832 $343,113 $310,250 25 99 E06 1,010 533 $216,500,014 $406,191 $359,000 20 100 E07 1,500 871 $291,484,880 $334,655 $340,000 25 99 E08 1,574 806 $259,007,297 $321,349 $325,000 27 98 E09 2,124 1,217 $332,219,534 $272,982 $265,000 28 98 E10 868 516 $205,872,026 $398,977 $384,500 22 99 E11 1,735 929 $274,361,513 $295,330 $287,000 29 98 E12 432 233 $77,023,183 $330,572 $299,900 26 98 E13 1,706 949 $331,777,858 $349,608 $330,000 26 98 E14 2,826 1,651 $545,407,441 $330,350 $315,000 24 98 E15 2,648 1,540 $488,971,524 $317,514 $301,250 23 98 E16 4,308 2,226 $514,395,439 $231,085 $222,250 33 97 E17 1,966 1,132 $295,108,456 $260,697 $247,000 31 98 E18 115 42 $25,796,900 $614,212 $453,750 58 95 E19 659 395 $155,641,645 $394,029 $352,000 31 98 E20 593 283 $87,091,540 $307,744 $281,000 51 96 E21 704 344 $115,841,434 $336,748 $310,000 49 96 TOTAL 33,134 18,325 $6,180,895,306 $337,293 $310,500 26 99 TORONTO REAL ESTATE BOARD 3
- 4. SINGLE FAMILY EAST BREAKDOWN - NOVEMBER 2010 East District East District East District 80 Days on Market 80 Sales Active Listing Ratio 60 60 40 40 20 20 0 0 Nov Dec Jan Feb Mar Apr May Jun Jul Aug Sep Oct Nov Nov Dec Jan Fab Mar Apr May Jun Jul Aug Sep Oct Nov 2009 2010 2009 2010 Detached Houses Semi-Detached Houses Area Act Sales Av. Price Med. Price % S-A Av. % List Area Act Sales Av. Price Med. Price % S-A Av. % List E01 39 16 $539,681 $498,950 41.0 98 E01 45 38 $493,390 $500,000 84.4 101 E02 45 23 $860,367 $753,000 51.1 98 E02 32 24 $524,854 $484,950 75.0 98 E03 79 54 $453,852 $425,000 68.4 99 E03 32 19 $447,421 $447,000 59.4 100 E04 59 33 $379,539 $360,000 55.9 99 E04 5 9 $288,422 $283,500 180.0 98 E05 26 26 $509,781 $521,050 100.0 99 E05 6 - - - - - E06 77 34 $477,744 $380,500 44.2 99 E06 11 5 $435,900 $349,000 45.5 97 E07 35 27 $434,563 $420,100 77.1 98 E07 7 5 $351,200 $355,000 71.4 100 E08 95 38 $411,321 $367,500 40.0 98 E08 3 4 $309,500 $307,500 133.3 97 E09 49 35 $357,806 $350,000 71.4 97 E09 3 1 $220,500 $220,500 33.3 110 E10 53 20 $433,944 $414,750 37.7 98 E10 2 - - - - - E11 61 20 $368,865 $355,000 32.8 97 E11 11 11 $298,482 $299,000 100.0 98 E12 23 14 $382,221 $335,550 60.9 99 E12 2 2 $255,000 $255,000 100.0 97 E13 83 41 $447,587 $383,000 49.4 97 E13 4 6 $302,483 $291,000 150.0 98 E14 180 65 $351,729 $341,000 36.1 97 E14 20 13 $283,531 $272,000 65.0 98 E15 152 66 $346,377 $337,500 43.4 98 E15 14 5 $245,180 $245,000 35.7 98 E16 427 128 $247,985 $240,500 30.0 97 E16 38 14 $176,654 $175,950 36.8 95 E17 165 44 $297,150 $270,875 26.7 98 E17 14 4 $187,875 $179,000 28.6 97 E18 21 6 $668,333 $577,500 28.6 94 E18 - - - - - - E19 56 31 $409,848 $375,000 55.4 98 E19 - - - - - - E20 94 16 $354,419 $255,950 17.0 97 E20 - - - - - - E21 118 35 $301,003 $310,000 29.7 96 E21 - 1 $207,250 $207,250 - 95 4 TORONTO REAL ESTATE BOARD
- 5. SINGLE FAMILY EAST BREAKDOWN - NOVEMBER 2010 East District Condo Apartment Link Area Act Sales Av. Price Med. Price % S-A Av. % List Area Act Sales Av. Price Med. Price % S-A Av. % List E01 17 5 $456,530 $440,000 29.4 97 E01 - - - - - - E02 14 7 $388,229 $325,000 50.0 99 E02 - - - - - - E03 71 24 $209,375 $177,000 33.8 97 E03 - - - - - - E04 70 24 $173,591 $183,894 34.3 97 E04 - - - - - - E05 62 34 $219,621 $204,950 54.8 97 E05 5 1 $470,000 $470,000 20.0 98 E06 5 2 $272,000 $272,000 40.0 98 E06 - - - - - - E07 64 26 $198,588 $203,500 40.6 96 E07 5 7 $355,500 $370,000 140.0 97 E08 89 8 $188,688 $169,500 9.0 96 E08 - - - - - - E09 121 45 $238,440 $235,000 37.2 97 E09 - - - - - - E10 5 2 $154,750 $154,750 40.0 98 E10 - - - - - - E11 87 11 $153,595 $154,900 12.6 96 E11 5 3 $313,500 $322,000 60.0 99 E12 1 1 $169,000 $169,000 100.0 97 E12 - 1 $330,500 $330,500 - 97 E13 13 5 $227,500 $246,500 38.5 97 E13 - 5 $310,980 $330,000 - 98 E14 13 5 $191,080 $192,500 38.5 96 E14 2 4 $257,250 $260,000 200.0 97 E15 16 5 $247,100 $278,000 31.3 98 E15 6 7 $266,343 $268,000 116.7 99 E16 20 7 $130,500 $134,000 35.0 95 E16 5 3 $223,833 $222,500 60.0 97 E17 14 5 $156,600 $156,000 35.7 97 E17 21 9 $231,167 $235,000 42.9 98 E18 - - - - - - E18 - - - - - - E19 - - - - - - E19 1 1 $339,000 $339,000 100.0 100 E20 6 - - - - - E20 1 1 $275,000 $275,000 100.0 97 E21 - - - - - - E21 - 1 $219,000 $219,000 - 97 Condo Townhouse Detached Condo Area Act Sales Av. Price Med. Price % S-A Av. % List Area Act Sales Av. Price Med. Price % S-A Av. % List E01 14 4 $313,000 $321,500 28.6 97 E01 - - - - - - E02 4 4 $508,250 $470,000 100.0 99 E02 - - - - - - E03 5 2 $384,700 $384,700 40.0 99 E03 - - - - - - E04 15 8 $306,375 $305,000 53.3 97 E04 - - - - - - E05 17 11 $269,855 $271,500 64.7 98 E05 - - - - - - E06 1 1 $327,500 $327,500 100.0 96 E06 - - - - - - E07 5 8 $300,638 $300,400 160.0 98 E07 - 1 $348,000 $348,000 - 100 E08 12 6 $232,208 $243,500 50.0 98 E08 - - - - - - E09 30 6 $212,050 $193,750 20.0 98 E09 - - - - - - E10 5 2 $265,000 $265,000 40.0 97 E10 - - - - - - E11 23 8 $211,375 $199,000 34.8 95 E11 1 1 $318,000 $318,000 100.0 96 E12 6 4 $197,125 $193,250 66.7 98 E12 - - - - - - E13 23 10 $209,570 $209,900 43.5 98 E13 - - - - - - E14 16 16 $208,563 $215,750 100.0 97 E14 2 - - - - - E15 14 7 $223,071 $219,000 50.0 97 E15 - - - - - - E16 51 20 $143,876 $137,000 39.2 97 E16 - - - - - - E17 9 - - - - - E17 - - - - - - E18 - - - - - - E18 - - - - - - E19 - - - - - - E19 - - - - - - E20 2 - - - - - E20 - - - - - - E21 - - - - - - E21 - - - - - - TORONTO REAL ESTATE BOARD 5
- 6. SINGLE FAMILY EAST BREAKDOWN - NOVEMBER 2010 East District Co-op Apartment Attached/Row/Townhouse Area Act Sales Av. Price Med. Price % S-A Av. % List Area Act Sales Av. Price Med. Price % S-A Av. % List E01 - - - - - - E01 11 4 $529,250 $520,000 36.4 101 E02 2 - - - - - E02 10 4 $673,950 $690,400 40.0 100 E03 3 - - - - - E03 6 5 $367,340 $348,200 83.3 97 E04 5 - - - - - E04 6 2 $434,000 $434,000 33.3 96 E05 - - - - - - E05 - 1 $354,900 $354,900 - 100 E06 - - - - - - E06 8 1 $418,000 $418,000 12.5 97 E07 - - - - - - E07 4 4 $332,125 $320,250 100.0 99 E08 - - - - - - E08 2 2 $371,000 $371,000 100.0 97 E09 3 - - - - - E09 - 1 $395,000 $395,000 - 98 E10 10 - - - - - E10 4 2 $315,250 $315,250 50.0 97 E11 - - - - - - E11 12 9 $274,844 $266,000 75.0 98 E12 - - - - - - E12 2 1 $525,000 $525,000 50.0 97 E13 - - - - - - E13 13 7 $276,429 $252,500 53.9 97 E14 - - - - - - E14 24 14 $283,642 $285,000 58.3 98 E15 - - - - - - E15 24 7 $253,000 $250,000 29.2 99 E16 - - - - - - E16 17 9 $204,444 $210,000 52.9 99 E17 - - - - - - E17 13 10 $200,090 $200,000 76.9 98 E18 - - - - - - E18 - - - - - - E19 - - - - - - E19 2 5 $272,700 $266,000 250.0 101 E20 - - - - - - E20 - - - - - - E21 - - - - - - E21 - - - - - - West District Current Month: November 2010 Area Active New Sales $ Volume Avg Price Med Price Avg DOM Avg %List W01 91 73 58 $28,248,700 $487,047 $440,250 20 100 W02 90 68 51 $24,435,625 $479,130 $440,000 24 99 W03 176 94 64 $20,787,400 $324,803 $326,500 32 97 W04 182 76 54 $17,828,900 $330,165 $343,250 37 96 W05 346 139 79 $24,085,200 $304,876 $312,900 38 96 W06 269 120 84 $34,583,570 $411,709 $387,000 38 98 W07 104 73 62 $31,955,700 $515,415 $494,000 29 98 W08 196 87 94 $60,313,813 $641,636 $456,500 39 97 W09 144 53 40 $15,281,987 $382,050 $445,000 38 97 W10 290 132 60 $15,114,250 $251,904 $282,500 38 96 W12 200 87 56 $32,066,636 $572,619 $458,500 34 97 W13 214 92 72 $46,207,398 $641,769 $460,000 35 96 W14 110 57 54 $18,912,188 $350,226 $323,000 34 97 W15 319 218 147 $38,682,091 $263,143 $236,000 27 97 W16 122 73 68 $27,784,038 $408,589 $371,000 35 97 W17 - - - - - - - - W18 94 45 29 $8,254,525 $284,639 $285,300 43 96 W19 248 186 144 $56,597,386 $393,037 $377,750 28 98 W20 276 210 198 $80,909,400 $408,633 $383,250 25 98 W21 429 179 126 $77,281,450 $613,345 $468,000 45 96 W22 150 116 97 $37,684,649 $388,502 $372,000 28 98 W23 677 408 275 $94,583,105 $343,939 $330,000 30 97 W24 471 326 233 $83,239,402 $357,251 $340,000 29 97 W25 141 47 33 $12,143,162 $367,975 $357,500 41 97 W26 27 6 2 $2,648,000 $1,324,000 $1,324,000 32 86 W27 197 103 64 $25,680,200 $401,253 $380,000 40 98 W28 205 79 50 $24,455,850 $489,117 $433,500 46 98 W29 115 59 48 $16,871,000 $351,479 $299,500 50 97 TOTAL 5,883 3,206 2,342 $956,635,625 $408,470 $357,000 33 97 6 TORONTO REAL ESTATE BOARD
- 7. SINGLE FAMILY WEST BREAKDOWN - NOVEMBER 2010 West District West District West District 80 Days on Market 80 Sales Active Listing Ratio 60 60 40 40 20 20 0 0 Nov Dec Jan Feb Mar Apr May Jun Jul Aug Sep Oct Nov Nov Dec Jan Feb Mar Apr May Jun Jul Aug Sep Oct Nov 2009 2010 2009 2010 Year-to-Date: November 2010 Area Listed Sales $ Volume Avg Price Med Price Avg DOM Avg %List W01 999 607 $321,370,400 $529,441 $477,777 19 102 W02 1,255 783 $401,960,629 $513,360 $455,000 18 102 W03 1,416 668 $220,175,009 $329,603 $325,000 27 99 W04 1,413 685 $218,139,726 $318,452 $316,500 33 97 W05 2,314 1,028 $320,175,458 $311,455 $327,250 34 97 W06 2,045 1,113 $453,069,365 $407,070 $384,000 28 99 W07 1,119 691 $344,417,911 $498,434 $470,000 22 99 W08 1,936 1,169 $707,591,303 $605,296 $495,000 26 98 W09 917 445 $169,918,854 $381,840 $401,000 32 97 W10 1,816 843 $220,005,869 $260,980 $264,000 33 97 W12 1,627 854 $462,639,855 $541,733 $445,000 29 98 W13 1,589 818 $487,444,206 $595,898 $444,750 28 97 W14 983 563 $202,536,283 $359,745 $345,000 26 98 W15 3,464 2,018 $538,798,938 $266,997 $242,100 27 98 W16 1,410 898 $372,021,410 $414,278 $375,000 24 98 W17 4 1 $251,000 $251,000 $251,000 16 100 W18 759 370 $105,084,227 $284,011 $295,350 31 97 W19 3,610 2,101 $845,084,150 $402,229 $388,500 23 98 W20 4,163 2,552 $1,029,926,718 $403,576 $380,000 20 99 W21 3,155 1,670 $977,327,653 $585,226 $498,000 30 98 W22 1,974 1,250 $497,593,094 $398,074 $369,900 19 99 W23 7,579 4,161 $1,436,367,475 $345,198 $332,000 24 98 W24 5,610 3,152 $1,132,842,990 $359,405 $345,000 24 98 W25 921 519 $204,368,806 $393,774 $355,000 32 98 W26 109 55 $36,439,500 $662,536 $580,000 72 96 W27 1,384 854 $352,779,172 $413,090 $380,000 31 98 W28 1,320 732 $370,989,412 $506,816 $448,500 37 98 W29 883 586 $185,306,346 $316,222 $287,500 39 98 TOTAL 55,774 31,186 $12,614,625,759 $404,496 $357,000 26 98 TORONTO REAL ESTATE BOARD 7
- 8. SINGLE FAMILY WEST BREAKDOWN - NOVEMBER 2010 West District Detached Houses Semi-Detached Houses Area Act Sales Av. Price Med. Price % S-A Av. % List Area Act Sales Av. Price Med. Price % S-A Av. % List W01 23 12 $784,492 $757,450 52.2 102 W01 16 12 $495,771 $495,500 75.0 100 W02 35 17 $565,476 $588,500 48.6 97 W02 24 23 $474,066 $465,000 95.8 100 W03 106 36 $324,139 $325,500 34.0 97 W03 39 21 $350,257 $350,000 53.9 98 W04 79 34 $396,085 $407,500 43.0 97 W04 7 2 $353,000 $353,000 28.6 96 W05 78 24 $458,438 $415,500 30.8 96 W05 70 19 $371,095 $326,000 27.1 96 W06 51 36 $440,550 $423,250 70.6 99 W06 2 3 $354,167 $370,000 150.0 98 W07 42 28 $657,504 $588,000 66.7 100 W07 3 2 $421,750 $421,750 66.7 95 W08 108 49 $969,610 $785,000 45.4 96 W08 2 1 $495,000 $495,000 50.0 99 W09 44 22 $523,931 $532,000 50.0 98 W09 6 1 $455,100 $455,100 16.7 103 W10 81 26 $342,077 $344,750 32.1 96 W10 8 5 $300,500 $307,000 62.5 97 W12 125 34 $698,330 $545,875 27.2 97 W12 6 5 $393,000 $405,500 83.3 98 W13 154 40 $926,857 $696,500 26.0 96 W13 11 11 $334,692 $343,000 100.0 97 W14 24 16 $555,644 $531,950 66.7 97 W14 9 6 $409,250 $403,250 66.7 98 W15 17 8 $502,000 $496,500 47.1 99 W15 7 8 $375,675 $380,000 114.3 100 W16 61 33 $545,278 $495,000 54.1 97 W16 15 11 $342,314 $346,500 73.3 97 W17 - - - - - - W17 - - - - - - W18 19 9 $387,969 $350,000 47.4 96 W18 36 11 $289,845 $290,000 30.6 96 W19 95 46 $545,374 $533,600 48.4 98 W19 31 23 $401,408 $412,000 74.2 99 W20 113 76 $538,612 $505,500 67.3 97 W20 36 42 $367,095 $357,000 116.7 98 W21 317 72 $788,953 $615,000 22.7 96 W21 8 6 $404,333 $404,000 75.0 97 W22 94 52 $450,290 $430,500 55.3 98 W22 13 10 $359,485 $360,500 76.9 99 W23 398 153 $396,520 $382,500 38.4 98 W23 115 51 $297,373 $300,000 44.4 98 W24 300 119 $443,603 $438,000 39.7 97 W24 57 43 $322,850 $312,500 75.4 98 W25 90 13 $495,401 $472,000 14.4 97 W25 5 5 $358,280 $356,900 100.0 98 W26 26 2 $1,324,000 $1,324,000 7.7 86 W26 1 - - - - - W27 163 51 $435,461 $397,000 31.3 98 W27 10 1 $324,000 $324,000 10.0 98 W28 187 41 $517,794 $450,000 21.9 97 W28 8 8 $363,913 $347,500 100.0 99 W29 87 35 $394,163 $334,500 40.2 97 W29 10 7 $220,486 $232,500 70.0 97 Condo Apartment Link Area Act Sales Av. Price Med. Price % S-A Av. % List Area Act Sales Av. Price Med. Price % S-A Av. % List W01 34 25 $355,462 $315,000 73.5 99 W01 - - - - - - W02 16 7 $353,214 $375,000 43.8 99 W02 - - - - - - W03 26 4 $242,750 $250,500 15.4 98 W03 - - - - - - W04 65 8 $149,563 $144,250 12.3 96 W04 - - - - - - W05 123 18 $132,917 $135,000 14.6 95 W05 - - - - - - W06 196 35 $370,496 $318,000 17.9 97 W06 - - - - - - W07 47 21 $341,562 $294,900 44.7 98 W07 - - - - - - W08 78 40 $280,785 $251,050 51.3 97 W08 - - - - - - W09 89 14 $143,779 $107,000 15.7 93 W09 - - - - - - W10 169 21 $158,774 $153,000 12.4 96 W10 - 2 $297,000 $297,000 - 99 W12 44 8 $213,000 $216,000 18.2 96 W12 - - - - - - W13 25 6 $179,833 $172,000 24.0 98 W13 - - - - - - W14 46 19 $202,105 $207,000 41.3 96 W14 2 1 $440,000 $440,000 50.0 96 W15 270 110 $232,945 $228,000 40.7 97 W15 - - - - - - W16 14 9 $199,611 $195,000 64.3 97 W16 1 - - - - - W17 - - - - - - W17 - - - - - - W18 19 4 $154,375 $146,000 21.1 97 W18 - - - - - - W19 74 34 $271,135 $244,000 46.0 97 W19 2 2 $389,000 $389,000 100.0 98 W20 36 13 $215,223 $206,000 36.1 97 W20 2 4 $407,250 $400,500 200.0 97 W21 39 16 $364,556 $254,750 41.0 97 W21 - - - - - - W22 10 1 $264,999 $264,999 10.0 100 W22 3 - - - - - W23 80 16 $191,219 $204,000 20.0 91 W23 2 3 $334,000 $292,000 150.0 98 W24 41 24 $179,142 $170,200 58.5 96 W24 1 1 $335,000 $335,000 100.0 99 W25 14 8 $231,194 $203,575 57.1 97 W25 2 - - - - - W26 - - - - - - W26 - - - - - - W27 8 1 $236,000 $236,000 12.5 96 W27 - - - - - - W28 4 - - - - - W28 - - - - - - W29 12 1 $439,900 $439,900 8.3 98 W29 - 1 $240,000 $240,000 - 98 8 TORONTO REAL ESTATE BOARD
- 9. SINGLE FAMILY WEST BREAKDOWN - NOVEMBER 2010 West District Condo Townhouse Detached Condo Area Act Sales Av. Price Med. Price % S-A Av. % List Area Act Sales Av. Price Med. Price % S-A Av. % List W01 11 3 $354,667 $310,000 27.3 98 W01 - - - - - - W02 8 2 $327,500 $327,500 25.0 98 W02 - - - - - - W03 1 1 $268,000 $268,000 100.0 97 W03 - - - - - - W04 21 7 $217,929 $210,000 33.3 96 W04 - - - - - - W05 63 13 $209,454 $199,900 20.6 96 W05 - - - - - - W06 11 1 $880,000 $880,000 9.1 98 W06 - - - - - - W07 3 2 $331,650 $331,650 66.7 97 W07 - - - - - - W08 2 3 $302,508 $295,000 150.0 98 W08 - - - - - - W09 1 3 $429,167 $355,000 300.0 100 W09 - - - - - - W10 31 6 $131,583 $118,000 19.4 92 W10 - - - - - - W12 22 7 $494,914 $435,000 31.8 97 W12 2 1 $820,000 $820,000 50.0 97 W13 19 14 $282,857 $225,500 73.7 97 W13 1 - - - - - W14 27 11 $266,763 $314,000 40.7 98 W14 - - - - - - W15 25 20 $290,538 $277,500 80.0 97 W15 - - - - - - W16 31 13 $274,069 $280,000 41.9 96 W16 - - - - - - W17 - - - - - - W17 - - - - - - W18 17 5 $191,400 $195,000 29.4 95 W18 - - - - - - W19 37 32 $305,513 $313,500 86.5 98 W19 - - - - - - W20 69 43 $283,107 $266,000 62.3 98 W20 - - - - - - W21 20 12 $311,829 $299,000 60.0 97 W21 - - - - - - W22 8 2 $218,750 $218,750 25.0 98 W22 - - - - - - W23 40 21 $255,538 $262,000 52.5 96 W23 - - - - - - W24 38 20 $217,780 $209,000 52.6 97 W24 3 - - - - - W25 18 5 $286,400 $265,000 27.8 98 W25 1 - - - - - W26 - - - - - - W26 - - - - - - W27 12 6 $230,150 $236,700 50.0 97 W27 - - - - - - W28 1 - - - - - W28 - - - - - - W29 6 2 $167,500 $167,500 33.3 95 W29 - - - - - - Co-op Apartment Attached/Row/Townhouse Area Act Sales Av. Price Med. Price % S-A Av. % List Area Act Sales Av. Price Med. Price % S-A Av. % List W01 - - - - - - W01 7 6 $489,167 $458,000 85.7 102 W02 2 - - - - - W02 5 2 $395,750 $395,750 40.0 99 W03 - - - - - - W03 4 2 $262,000 $262,000 50.0 96 W04 - - - - - - W04 10 3 $311,333 $294,000 30.0 95 W05 3 3 $74,000 $83,000 100.0 91 W05 9 2 $347,250 $347,250 22.2 99 W06 3 2 $129,650 $129,650 66.7 95 W06 6 7 $507,800 $509,000 116.7 98 W07 1 - - - - - W07 8 9 $540,667 $530,000 112.5 97 W08 3 1 $169,000 $169,000 33.3 97 W08 3 - - - - - W09 4 - - - - - W09 - - - - - - W10 - - - - - - W10 1 - - - - - W12 - - - - - - W12 1 1 $370,000 $370,000 100.0 99 W13 - - - - - - W13 4 1 $412,500 $412,500 25.0 99 W14 - - - - - - W14 2 1 $352,000 $352,000 50.0 98 W15 - 1 $226,000 $226,000 - 98 W15 - - - - - - W16 - - - - - - W16 - 2 $332,500 $332,500 - 99 W17 - - - - - - W17 - - - - - - W18 - - - - - - W18 3 - - - - - W19 - - - - - - W19 9 7 $357,829 $353,000 77.8 99 W20 - - - - - - W20 20 20 $397,820 $392,500 100.0 98 W21 - - - - - - W21 45 20 $423,800 $396,500 44.4 98 W22 - - - - - - W22 22 32 $311,631 $311,000 145.5 99 W23 - - - - - - W2 3 42 31 $300,702 $291,000 73.8 98 W24 - - - - - - W24 31 26 $291,467 $306,250 83.9 97 W25 - - - - - - W25 11 2 $315,000 $315,000 18.2 97 W26 - - - - - - W26 - - - - - - W27 - - - - - - W27 4 5 $306,160 $313,800 125.0 99 W28 3 - - - - - W28 2 1 $315,000 $315,000 50.0 98 W29 - - - - - - W29 - 2 $258,500 $258,500 - 98 TORONTO REAL ESTATE BOARD 9
- 10. Central District Current Month: November 2010 Area Active New Sales $ Volume Avg Price Med Price Avg DOM Avg%List C01 956 524 382 $155,700,042 $407,592 $355,950 35 98 C02 205 115 73 $55,841,100 $764,947 $625,000 30 98 C03 109 61 41 $28,429,000 $693,390 $530,000 26 97 C04 162 100 82 $73,988,557 $902,299 $764,500 32 98 C06 73 40 36 $19,358,150 $537,726 $558,750 33 97 C07 213 133 108 $46,719,700 $432,590 $364,000 30 97 C08 263 176 160 $63,348,437 $395,928 $355,000 28 98 C09 66 40 39 $53,093,500 $1,361,372 $1,070,000 37 98 C10 165 128 83 $60,088,085 $723,953 $615,000 20 100 C11 48 42 43 $25,261,705 $587,482 $453,000 30 98 C12 112 45 27 $42,590,300 $1,577,419 $1,160,000 33 99 C13 105 57 41 $15,063,000 $367,390 $310,000 34 97 C14 305 216 182 $92,766,048 $509,704 $383,250 29 98 C15 187 115 113 $48,280,019 $427,257 $363,500 29 98 TOTAL 2,969 1,792 1,410 $780,527,643 $553,566 $396,750 31 98 Central District Central District 80 Days on Market 80 Sales Active Listing Ratio 60 60 40 40 20 20 0 0 Nov Dec Jan Feb Mar Apr May Jun Jul Aug Sep Oct Nov Nov Dec Jan Feb Mar Apr May Jun Jul Aug Sep Oct Nov 2009 2010 2009 2010 Year-to-Date: November 2010 Area Listed Sales $ Volume Avg Price Med Price Avg DOM Avg%List C01 7,845 3,993 $1,629,288,054 $408,036 $359,000 25 99 C02 1,664 843 $672,648,211 $797,922 $590,000 25 100 C03 1,052 560 $462,656,014 $826,171 $568,000 26 99 C04 1,869 1,053 $861,065,556 $817,726 $721,875 22 99 C06 633 302 $164,457,310 $544,561 $519,500 26 98 C07 2,240 1,187 $520,619,336 $438,601 $372,000 26 99 C08 3,111 1,730 $676,553,307 $391,071 $348,750 23 99 C09 608 340 $395,463,808 $1,163,129 $822,500 27 99 C10 1,553 902 $655,497,499 $726,716 $592,150 20 100 C11 578 363 $202,826,235 $558,750 $520,000 23 99 C12 852 409 $595,022,176 $1,454,822 $1,180,000 30 98 C13 1,207 648 $271,567,510 $419,086 $366,250 26 99 C14 3,301 1,800 $849,816,375 $472,120 $373,000 25 99 C15 2,354 1,254 $555,520,757 $442,999 $365,250 24 99 TOTAL 28,867 15,384 $8,513,002,148 $553,367 $402,500 24 99 10 TORONTO REAL ESTATE BOARD
- 11. SINGLE FAMILY CENTRAL BREAKDOWN - NOVEMBER 2010 Central District Detached Houses Semi-Detached Houses Area Act Sales Av. Price Med. Price % S-A Av. % List Area Act Sales Av. Price Med. Price % S-A Av.% List C01 9 4 $625,250 $604,500 44.4 98 C01 37 11 $729,791 $701,200 29.7 101 C02 35 14 $856,886 $828,700 40.0 96 C02 28 15 $852,733 $680,000 53.6 101 C03 62 24 $735,792 $530,000 38.7 96 C03 10 5 $407,700 $420,000 50.0 98 C04 101 55 $1,147,212 $1,001,000 54.5 98 C04 6 5 $665,600 $691,000 83.3 100 C06 53 24 $665,454 $600,500 45.3 97 C06 1 1 $403,500 $403,500 100.0 101 C07 77 27 $699,370 $610,000 35.1 98 C07 4 6 $459,283 $462,100 150.0 100 C08 1 - - - - - C08 14 10 $717,870 $684,000 71.4 100 C09 28 17 $2,225,324 $1,681,000 60.7 98 C09 2 3 $1,203,333 $1,350,000 150.0 97 C10 44 24 $1,163,063 $918,250 54.6 101 C10 7 14 $760,177 $664,750 200.0 103 C11 8 16 $1,090,253 $1,042,000 200.0 101 C11 3 5 $631,600 $672,000 166.7 98 C12 91 21 $1,909,229 $1,403,000 23.1 99 C12 - - - - - - C13 14 9 $623,678 $575,000 64.3 97 C13 10 5 $340,200 $345,000 50.0 99 C14 64 37 $1,006,162 $891,100 57.8 97 C14 - - - - - - C15 31 26 $754,989 $708,250 83.9 100 C15 8 15 $437,100 $443,000 187.5 100 Condo Apartment Link Area Act Sales Av. Price Med. Price % S-A Av. % List Area Act Sales Av. Price Med. Price % S-A Av.% List C01 851 329 $387,347 $346,000 38.7 98 C01 - - - - - - C02 114 31 $692,945 $510,000 27.2 97 C02 - - - - - - C03 26 9 $771,278 $700,000 34.6 97 C03 - - - - - - C04 39 17 $369,376 $335,000 43.6 96 C04 - - - - - - C06 17 10 $268,500 $264,500 58.8 96 C06 - - - - - - C07 106 63 $324,762 $314,900 59.4 97 C07 2 1 $412,000 $412,000 50.0 98 C08 223 138 $365,824 $341,000 61.9 98 C08 - - - - - - C09 27 13 $499,308 $440,000 48.2 97 C09 - - - - - - C10 103 40 $457,655 $437,500 38.8 99 C10 - - - - - - C11 30 18 $181,217 $150,500 60.0 96 C11 - - - - - - C12 18 3 $427,667 $353,000 16.7 96 C12 - - - - - - C13 73 24 $268,204 $259,950 32.9 97 C13 - - - - - - C14 200 129 $362,059 $336,000 64.5 98 C14 - - - - - - C15 110 48 $304,744 $293,500 43.6 97 C15 - 1 $493,000 $493,000 - 99 Condo Townhouse Detached Condo Area Act Sales Av. Price Med. Price % S-A Av. % List Area Act Sales Av. Price Med. Price % S-A Av.% List C01 34 25 $414,172 $370,000 73.5 99 C01 - - - - - - C02 12 3 $526,467 $570,000 25.0 98 C02 - - - - - - C03 1 - - - - - C03 - - - - - - C04 4 4 $305,500 $304,500 100.0 99 C04 - - - - - - C06 1 1 $298,750 $298,750 100.0 96 C06 - - - - - - C07 20 6 $324,417 $323,750 30.0 97 C07 1 - - - - - C08 16 3 $317,000 $336,000 18.8 101 C08 - - - - - - C09 4 4 $999,250 $879,500 100.0 95 C09 - - - - - - C10 7 4 $591,725 $567,450 57.1 101 C10 1 - - - - - C11 4 3 $271,667 $326,000 75.0 97 C11 - - - - - - C12 3 3 $404,500 $400,000 100.0 98 C12 - - - - - - C13 5 1 $250,000 $250,000 20.0 97 C13 - - - - - - C14 34 13 $544,268 $566,500 38.2 97 C14 - - - - - - C15 38 23 $303,178 $298,000 60.5 97 C15 - - - - - - TORONTO REAL ESTATE BOARD 11
- 12. SINGLE FAMILY CENTRAL BREAKDOWN - NOVEMBER 2010 Central District Co-op Apartment Attached/Row/Townhouse Area Act Sales Av. Price Med. Price % S-A Av. % List Area Act Sales Av. Price Med. Price % S-A Av. % List C01 1 - - - - - C01 24 13 $567,692 $545,000 54.2 96 C02 5 2 $274,000 $274,000 40.0 97 C02 11 8 $930,625 $754,000 72.7 100 C03 9 1 $130,000 $130,000 11.1 96 C03 1 2 $830,000 $830,000 200.0 98 C04 5 1 $62,500 $62,500 20.0 71 C04 7 - - - - - C06 - - - - - - C06 1 - - - - - C07 - 1 $325,000 $325,000 - 96 C07 3 4 $484,375 $477,750 133.3 97 C08 1 1 $144,000 $144,000 100.0 103 C08 8 8 $573,875 $617,000 100.0 96 C09 5 2 $582,500 $582,500 40.0 100 C09 - - - - - - C10 2 - - - - - C10 1 1 $859,000 $859,000 100.0 100 C11 1 - - - - - C11 2 1 $582,750 $582,750 50.0 100 C12 - - - - - - C12 - - - - - - C13 1 - - - - - C13 2 2 $531,000 $531,000 100.0 99 C14 1 1 $184,000 $184,000 100.0 97 C14 6 2 $786,500 $786,500 33.3 99 C15 - - - - - - C15 - - - - - - North District Current Month: November 2010 Area Active New Sales $ Volume Avg Price Med Price Avg DOM Avg %List N01 115 71 46 $22,045,989 $479,261 $366,350 34 98 N02 177 111 90 $38,674,568 $429,717 $377,500 33 97 N03 241 147 152 $74,841,913 $492,381 $412,250 33 97 N04 145 98 82 $45,975,938 $560,682 $500,500 29 98 N05 161 84 75 $45,178,209 $602,376 $548,000 36 97 N06 164 81 71 $35,132,500 $494,824 $405,000 41 98 N07 160 95 105 $39,728,473 $378,366 $372,000 31 98 N08 431 257 182 $96,611,992 $530,835 $469,950 32 98 N10 132 74 55 $27,691,716 $503,486 $480,000 23 99 N11 307 216 188 $98,163,315 $522,145 $453,900 32 98 N12 98 51 37 $16,635,000 $449,595 $433,000 30 98 N13 84 16 9 $6,321,000 $702,333 $510,000 75 95 N14 156 31 17 $11,787,000 $693,353 $550,000 65 94 N15 77 20 23 $9,052,200 $393,574 $319,000 63 96 N16 136 31 30 $13,326,450 $444,215 $372,500 62 96 N17 226 79 63 $16,529,200 $262,368 $272,000 57 97 N18 125 44 28 $9,359,500 $334,268 $325,000 64 97 N19 160 58 37 $11,249,950 $304,053 $260,000 55 97 N20 32 4 2 $1,147,000 $573,500 $573,500 41 98 N21 46 14 9 $3,185,500 $353,944 $315,000 90 97 N22 95 26 7 $3,371,000 $481,571 $353,000 55 93 N23 218 49 39 $10,157,600 $260,451 $258,000 63 97 N24 114 28 12 $3,649,800 $304,150 $250,000 74 95 TOTAL 3,600 1,685 1,359 $639,815,813 $470,799 $420,000 38 97 12 TORONTO REAL ESTATE BOARD
- 13. North District North District North District 80 Days on Market 80 Sales Active Listing Ratio 60 60 40 40 20 20 0 0 Nov Dec Jan Feb Mar Apr May Jun Jul Aug Sep Oct Nov Nov Dec Jan Feb Mar Apr May Jun Jul Aug Sep Oct Nov 2009 2010 2009 2010 Year-to-Date: November 2010 Area Listed Sales $ Volume Avg Price Med Price Avg DOM Avg %List N01 1,166 648 $365,769,946 $564,460 $512,500 25 99 N02 1,732 930 $451,455,904 $485,436 $420,000 26 98 N03 3,459 1,998 $1,005,491,854 $503,249 $439,950 25 99 N04 1,921 1,018 $541,672,090 $532,094 $512,250 23 99 N05 1,569 764 $419,801,084 $549,478 $523,500 27 98 N06 1,423 830 $400,809,875 $482,903 $417,750 29 98 N07 1,958 1,302 $493,160,551 $378,772 $354,500 25 98 N08 4,257 2,272 $1,174,138,671 $516,786 $471,289 25 98 N10 1,469 741 $361,916,981 $488,417 $462,000 23 99 N11 4,302 2,533 $1,320,226,108 $521,210 $471,000 24 99 N12 828 465 $216,113,648 $464,761 $418,500 29 98 N13 325 121 $88,352,542 $730,186 $615,000 77 96 N14 571 229 $156,119,538 $681,745 $575,000 47 96 N15 526 287 $122,091,030 $425,404 $375,000 44 97 N16 647 326 $136,833,930 $419,736 $373,500 51 97 N17 1,407 783 $223,363,135 $285,266 $263,000 43 97 N18 719 389 $131,257,036 $337,422 $316,000 42 98 N19 814 473 $140,434,770 $296,902 $267,000 51 97 N20 137 67 $29,853,600 $445,576 $392,000 64 96 N21 173 76 $25,600,800 $336,853 $326,500 68 97 N22 394 180 $55,428,400 $307,936 $268,500 63 97 N23 941 416 $116,274,449 $279,506 $258,000 56 97 N24 445 151 $39,928,342 $264,426 $225,200 66 95 TOTAL 31,183 16,999 $8,016,094,284 $471,563 $425,000 30 98 TORONTO REAL ESTATE BOARD 13
- 14. SINGLE FAMILY NORTH BREAKDOWN - NOVEMBER 2010 North District Detached Houses Semi-Detached Houses Area Act Sales Av. Price Med. Price % S-A Av. % List Area Act Sales Av. Price Med. Price % S-A Av. % List N01 50 17 $744,118 $615,000 34.0 97 N01 3 2 $509,444 $509,444 66.7 97 N02 82 32 $595,312 $545,009 39.0 98 N02 1 1 $418,800 $418,800 100.0 99 N03 106 57 $769,366 $715,000 53.8 97 N03 3 7 $459,429 $460,000 233.3 97 N04 91 54 $641,706 $592,500 59.3 98 N04 5 10 $396,160 $360,000 200.0 98 N05 142 54 $677,724 $608,000 38.0 97 N05 1 4 $401,725 $396,000 400.0 97 N06 125 46 $568,352 $472,900 36.8 97 N06 2 10 $334,130 $334,000 500.0 100 N07 116 64 $434,247 $425,000 55.2 98 N07 18 12 $318,292 $314,250 66.7 98 N08 307 110 $624,390 $530,000 35.8 97 N08 26 32 $418,709 $421,000 123.1 98 N10 63 28 $598,135 $570,000 44.4 98 N10 2 6 $405,833 $407,250 300.0 102 N11 152 89 $678,385 $580,000 58.6 98 N11 15 21 $421,628 $420,000 140.0 100 N12 74 31 $475,355 $455,000 41.9 98 N12 8 1 $355,000 $355,000 12.5 99 N13 84 9 $702,333 $510,000 10.7 95 N13 - - - - - - N14 147 14 $768,143 $612,500 9.5 94 N14 - 2 $421,500 $421,500 - 91 N15 74 18 $436,039 $376,100 24.3 96 N15 - - - - - - N16 122 25 $481,310 $435,000 20.5 96 N16 1 1 $181,000 $181,000 100.0 97 N17 210 57 $266,418 $278,500 27.1 97 N17 6 2 $269,750 $269,750 33.3 98 N18 109 20 $366,750 $360,000 18.4 97 N18 5 1 $307,500 $307,500 20.0 96 N19 97 27 $332,520 $295,000 27.8 97 N19 6 1 $229,000 $229,000 16.7 97 N20 32 2 $573,500 $573,500 6.3 98 N20 - - - - - - N21 45 8 $374,938 $373,500 17.8 98 N21 1 1 $186,000 $186,000 100.0 96 N22 83 5 $588,200 $490,000 6.0 93 N22 2 - - - - - N23 214 37 $264,259 $261,000 17.3 97 N23 - - - - - - N24 106 11 $316,527 $250,000 10.4 94 N24 1 - - - - - Condo Apartment Link Area Act Sales Av. Price Med. Price % S-A Av. % List Area Act Sales Av. Price Med. Price % S-A Av. % List N01 34 9 $255,300 $252,000 26.5 96 N01 1 1 $550,000 $550,000 100.0 104 N02 82 47 $307,404 $285,000 57.3 97 N02 3 - - - - - N03 97 57 $265,347 $262,000 58.8 97 N03 4 - - - - - N04 28 2 $221,500 $221,500 7.1 97 N04 - - - - - - N05 - - - - - - N05 5 1 $415,000 $415,000 20.0 98 N06 13 1 $345,000 $345,000 7.7 99 N06 3 1 $335,000 $335,000 33.3 97 N07 9 2 $252,000 $252,000 22.2 100 N07 2 1 $275,000 $275,000 50.0 97 N08 53 9 $311,556 $325,000 17.0 98 N08 - - - - - - N10 51 3 $297,863 $300,088 5.9 99 N10 9 15 $437,423 $431,500 166.7 99 N11 93 32 $343,275 $297,244 34.4 98 N11 6 7 $431,384 $427,188 116.7 98 N12 7 - - - - - N12 - - - - - - N13 - - - - - - N13 - - - - - - N14 7 1 $190,000 $190,000 14.3 95 N14 - - - - - - N15 - 1 $180,000 $180,000 - 95 N15 - - - - - - N16 5 - - - - - N16 2 2 $300,350 $300,350 100.0 97 N17 3 2 $165,500 $165,500 66.7 96 N17 1 1 $240,000 $240,000 100.0 98 N18 2 2 $183,000 $183,000 100.0 97 N18 8 5 $270,200 $280,000 62.5 98 N19 11 1 $170,000 $170,000 9.1 98 N19 2 1 $180,000 $180,000 50.0 95 N20 - - - - - - N20 - - - - - - N21 - - - - - - N21 - - - - - - N22 - - - - - - N22 6 1 $240,000 $240,000 16.7 94 N23 - - - - - - N23 - - - - - - N24 - - - - - - N24 - - - - - - 14 TORONTO REAL ESTATE BOARD
- 15. SINGLE FAMILY NORTH BREAKDOWN - NOVEMBER 2010 North District Condo Townhouse Detached Condo Area Act Sales Av. Price Med. Price % S-A Av. % List Area Act Sales Av. Price Med. Price % S-A Av. % List N01 26 15 $320,327 $320,000 57.7 98 N01 - - - - - - N02 7 6 $445,333 $435,000 85.7 97 N02 - - - - - - N03 14 14 $341,163 $359,000 100.0 98 N03 - - - - - - N04 4 3 $382,500 $400,000 75.0 98 N04 - - - - - - N05 1 - - - - - N05 - - - - - - N06 10 4 $469,500 $467,000 40.0 98 N06 - - - - - - N07 3 10 $243,100 $240,000 333.3 98 N07 - - - - - - N08 5 3 $299,833 $270,000 60.0 98 N08 - - - - - - N10 6 3 $351,333 $350,000 50.0 97 N10 - - - - - - N11 18 13 $347,308 $348,000 72.2 98 N11 1 - - - - - N12 1 1 $225,000 $225,000 100.0 98 N12 - - - - - - N13 - - - - - - N13 - - - - - - N14 2 - - - - - N14 - - - - - - N15 - - - - - - N15 - - - - - - N16 4 1 $152,000 $152,000 25.0 99 N16 - - - - - - N17 1 - - - - - N17 - - - - - - N18 - - - - - - N18 - - - - - - N19 5 - - - - - N19 20 3 $270,500 $286,500 15.0 96 N20 - - - - - - N20 - - - - - - N21 - - - - - - N21 - - - - - - N22 - - - - - - N22 - - - - - - N23 - - - - - - N23 - - - - - - N24 4 1 $168,000 $168,000 25.0 99 N24 - - - - - - Co-op Apartment Attached/Row/Townhouse Area Act Sales Av. Price Med. Price % S-A Av. % List Area Act Sales Av. Price Med. Price % S-A Av. % List N01 - - - - - - N01 1 2 $362,250 $362,250 200.0 100 N02 - - - - - - N02 2 4 $521,450 $515,250 200.0 98 N03 - - - - - - N03 17 17 $463,000 $461,000 100.0 99 N04 - - - - - - N04 17 13 $443,976 $430,000 76.5 99 N05 - - - - - - N05 12 16 $409,949 $400,250 133.3 99 N06 - - - - - - N06 11 9 $343,222 $340,000 81.8 99 N07 - - - - - - N07 12 16 $306,697 $312,000 133.3 98 N08 - - - - - - N08 40 28 $386,675 $384,750 70.0 98 N10 - - - - - - N10 1 - - - - - N11 - - - - - - N11 22 26 $400,515 $390,000 118.2 99 N12 - - - - - - N12 8 4 $329,750 $327,500 50.0 99 N13 - - - - - - N13 - - - - - - N14 - - - - - - N14 - - - - - - N15 - - - - - - N15 3 4 $255,875 $245,500 133.3 98 N16 - - - - - - N16 2 1 $360,000 $360,000 50.0 95 N17 - - - - - - N17 5 1 $232,900 $232,900 20.0 99 N18 - - - - - - N18 1 - - - - - N19 - - - - - - N19 19 4 $220,350 $217,750 21.1 99 N20 - - - - - - N20 - - - - - - N21 - - - - - - N21 - - - - - - N22 - - - - - - N22 4 1 $190,000 $190,000 25.0 96 N23 - - - - - - N23 4 2 $190,000 $190,000 50.0 96 N24 - - - - - - N24 3 - - - - - TORONTO REAL ESTATE BOARD 15
- 16. District Totals New Active Listed Sales $ Volume Avg Price Med Price Avg DOM Avg Month Grand Total 8,642 15,813 N/A 6,510 2,851,573,240 438,030 366,000 33 98 Year N/A N/A 148,958 81,894 35,324,617,497 431,346 365,000 27 98 Annual Summary - Single Family Year *Number of Sales *Average Price Year *Number of Sales *Average Price 1976 19,025 $61,389 2009 1977 20,512 $64,559 January 2,670 $343,632 1978 21,184 $67,333 February 4,120 $361,305 1979 23,466 $70,830 March 6,171 $362,050 1980 26,017 $75,694 April 8,107 $385,641 1981 29,625 $90,203 May 9,589 $395,609 1982 25,336 $95,496 June 10,955 $403,972 1983 30,046 $101,626 July 9,967 $395,414 1984 31,905 $102,318 August 8,035 $387,921 1985 45,509 $109,094 September 8,196 $406,877 1986 52,919 $138,925 October 8,476 $423,559 1987 43,475 $189,105 November 7,446 $418,460 1988 49,381 $229,635 December 5,541 $411,931 1989 38,960 $273,698 1990 26,779 $255,020 Total** 87,308 $395,460 1991 38,144 $234,313 1992 41,703 $214,971 2010 1993 38,990 $206,490 January 4,986 $409,058 1994 44,237 $208,921 February 7,291 $431,509 1995 39,273 $203,028 March 10,430 $434,696 1996 55,779 $198,150 April 10,898 $437,600 1997 58,014 $211,307 May 9,470 $446,593 1998 55,344 $216,815 June 8,442 $435,034 1999 58,957 $228,372 July 6,564 $420,482 2000 58,343 $243,255 August 6,232 $411,012 2001 67,612 $251,508 September 6,310 $427,329 2002 74,759 $275,231 October 6,681 $443,729 2003 78,898 $293,067 November 6,510 $438,030 2004 83,501 $315,231 2005 84,145 $335,907 Year-to-Date** 81,894 $431,346 2006 83,084 $351,941 2007 93,193 $376,236 2008 74,552 $379,347 * Due to District revisions, caution should be exercised when undertaking historical comparisons. Please refer to appropriate maps. **This figure may not equal the sum of all monthly totals, as the year-to-date total reflects sales reported in error and deals that have fallen through since January 1st. Single Family Dwelling Sales Comparison Sales Active Listings Average Price 15000 500000 35000 13500 30000 12000 425000 10500 25000 9000 20000 7500 350000 6000 15000 4500 10000 275000 3000 5000 1500 0 0 200000 Nov Dec Jan Feb Mar Apr May Jun Jul Aug Sep Oct Nov Nov Dec Jan Feb Mar Apr May Jun Jul Aug Sep Oct Nov 2000 2001 2002 2003 2004 2005 2006 2007 2008 2009 2010 2009 2010 2009 2010 16 TORONTO REAL ESTATE BOARD