1. PAYOLA
Payola is a web framework for analyzing and visualizing
Linked Data. It enables users to build their own instances
of LDVM pipelines. Payola provides an LDVM analyzer
editor in which SPARQL queries and custom plugins can be
combined.
Firstly, the user defines a set of data sources such as
SPARQL endpoints or RDF files as input data and then
connects other plugins to them. Join and Union plugins
enable users to analyze a dataset created from multiple
datasets stored in separate SPARQL endpoints. It is also
possible to transform results of an analyzer with a custom
transformer. When the pipeline is evaluated, the user can
choose a visualizer to see the results in various forms.
Throughout the LDVM pipeline all data is RDF and the user
can download the results in a form of an RDF file.
Payola also offers collaborative features. A user is able to
create an analyzer and share it with the rest of the Payola
users. That enables them to run such an analyzer as well
as to create a new analytical plugin, which is based on that
analyzer. As analytical plugins have parameters that affect
their behavior, a new analyzer-based plugin may also have
parameters, which can be chosen from the parameters of
the plugins of the original analyzer. This feature supports
formation of an ecosystem where expert users create ana-
lyzers for those who are less experienced. Combining
those analyzers into new ones enables even inexperienced
users to create a complex analyzer with less effort.
It is possible to extend Payola with custom plugins for
analysis and visualization. For instance, a user is allowed
to upload a code snippet of a new analytical plugin via our
web interface. The framework compiles the code and inte-
grates the created plugin immediately into the application.
The latest Payola version offers a one-click solution for
presenting results of an LDVM pipeline in a chosen visu-
alizer. When an LDVM pipeline is created, it is assigned a
unique URL. When a user accesses such a URL, Payola
automatically loads the pipeline and creates the desired vi-
sualization. To speed things up, it implements caching of
analyzer results so that it can serve more users in a shorter
time without repeated analysis evaluation.
JIŘÍ HELMICH (1,2)
, JAKUB KLÍMEK (3,2)
, MARTIN NEČASKÝ (1)
1 Charles University in Prague, Faculty of Mathematics and Physics
Malostranské nám. 25, 118 00 Praha 1, Czech Republic
{helmich, necasky}@ksi.mff.cuni.cz
2 University of Economics, Prague
Nám. W. Churchilla 4, 130 67 Praha 3, Czech Republic
3 Czech Technical University in Prague, Faculty of Information Technology
Thákurova 9, 160 00 Praha 6, Czech Republic
klimek@fit.cvut.cz
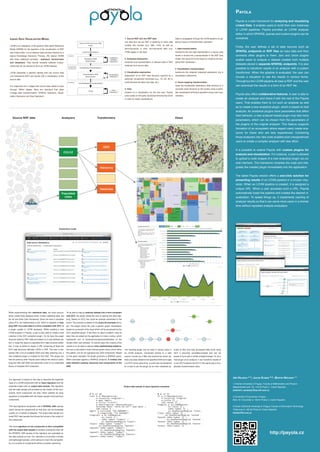
LINKED DATA VISUALIZATION MODEL
LDVM is an adaptation of the general Data State Reference
Model (DSRM) for the specifics of the visualization of RDF
and Linked Data. It is an abstract data process inspired by a
typical Knowledge Discovery Process. We extend DSRM
with three additional concepts - analyzers, transformers
and visualizers. They denote reusable software compo-
nents that can be chained to form an LDVM instance.
LDVM resembles a pipeline starting with raw source data
(not necessarily RDF) and results with a visualization of the
source data.
It is organized into 4 stages that source data needs to pass
through. Within stages, there are operators that allow
in-stage data transformations. SPARQL Operators, Visual-
ization Operators and View Operators.
http://payola.cz
Source RDF and non-RDF
Data
Analytical RDF
Abstraction
Data Transformation
Visualization RDF
Abstraction
View
Visualization Transformation
Visual Mapping Transformation
Visualization
Operators
View
Operators
Analytical
SPARQL
Operators
Analyzer
Visualizer
Visualization
Transformer
1. Source RDF and non-RDF data
raw data that can be RDF or adhering to other data
models and formats (e.g. XML, CSV) as well as
semi-structured or even non-structured data (e.g.
HTML pages or raw text).
2. Analytical abstraction
extraction and representation of relevant data in RDF
obtained from source data.
3. Visualization abstraction
preparation of an RDF data structure required by a
particular visualization technique (e.g., 1D, 2D, 3D or
multi-dimensional data, tree data, etc.)
4. View
creation of a visualization for the end user. Payola
uses variety of 3rd party JavaScript libraries like D3JS
in order to create visualizations.
Data is propagated through the LDVM pipeline by ap-
plying 3 types of transformation operators:
1. Data transformation
transforms the raw data represented in a source data
model or format into a representation in the RDF data
model; the result forms the base for creating the ana-
lytical RDF abstraction.
2. Visualization transformation
transforms the obtained analytical abstraction into a
visualization abstraction.
3. Visual mapping transformation
maps the visualization abstraction data structure to a
concrete visual structure on the screen using a partic-
ular visualization technique specified using a set of pa-
rameters.
ARES
Business
Entities
COI.CZ
Geocoordi
nates
Institution
s of public
power
(OVM)
Consolida
ted Law
NUTS
codes
LAU
regions
Demogra
phy
Budgets
Exchange
rates
CPV 2008
Elections
results
Research
projects
Czech
Public
Contracts
Court
decisions
RUIAN
TED
Public
Contracts
OVM
Agendas
Governmental
Business-entities
Geographical
Statistical
COI.CZ
Populated
cities
Hierarchy
DataCube
GEO
Source RDF data Analyzers Transformers Views
The resulting plugin can be used in various ways in
an LDVM analyzer. Connected directly to a data
source it works as a filter and transformer which se-
lects only data related to the specified DSD and maps
it to DCV at the same time. It could also be beneficial
for a user to use the plugin as an inner analytical op-
erator to filter and map processed data since using
DCV it becomes snowflake-shaped and can be
easier to work with in further analytical steps. Or, as a
final plugin of an analyzer, it can transform results of
a non-DCV analysis into DCV in the same way a visu-
alization transformation does.
While experimenting with statistical data, we have encoun-
tered Linked Data datasets which contain statistical data, but
do not use Data Cube Vocabulary. Since we have a visualizer
using DCV, we implemented a tool, which is capable of map-
ping RDF non-cube data to a form compliant with DCV as
a plugin usable in LDVM analyzers. While creating a new
LDVM analyzer in Payola, a user is also able to create a new
instance of the DCV analytical plugin. On its input the plugin
recieves arbitrary RDF data and based on a user-defined pat-
tern, it maps the data to a specified DCV data structure defini-
tion. A user is asked to supply a URL containing at least one
DCV data structure definition (DSD) in RDF. The user is pre-
sented with a list of available DSDs and after selecting one, a
new analytical plugin is created for this DSD. This plugin can
then be used by other Payola users without the need for speci-
fying the URL with DSD and becomes a part of our extensible
library of reusable DCV analyzers.
To be able to map an arbitrary dataset into a form compliant
with DCV, the plugin needs the user to specify the data map-
ping. Based on DCV, this could be partially automated in the
future. The process is based on the query-by-example princi-
ple. The plugin shows the user a generic graph visualization
based on a preview of the input which will be processed by the
DCV analytical plugin. It lets them to select a pattern: step by
step, they are asked by the application to mark a vertex, which
represents one of dimensions/measures/attributes of the
chosen DSD (red vertices). To narrow down the volume of the
results or to be able to specify more sophisticated patterns,
the user is also able to mark vertices (green ones), which refine
the pattern, but do not represent any DSD component. Based
on the given example, the plugin produces a SPARQL query.
When executed against a SPARQL endpoint, it creates new
links between existing resources and components of the
DSD.
Our approach is based on the idea to describe the expected
input of a LDVM component with an input signature and the
expected output with an output data sample. The signature
and the data sample are provided by the creator of the com-
ponent. Each component can then check whether its input
signature is compatible with the output sample of the previous
component.
The input signature comprises a set of SPARQL ASK queries
which should be inexpensive so that they can be evaluated
quickly on a number of datasets. The output data sample is a
small RDF data sample that shows the format of the output of
the component.
The input signature of one component is then compatible
with the output data sample of another component when all
the SPARQL ASK queries of the signature are evaluated on
the data sample as true. Our rationale is to provide a simple
and lightweight solution, which allows to check the compatibil-
ity of a number of components without complex reasoning.
Output data sample & input signature examples
Exploration mode