
Empfohlen
Weitere ähnliche Inhalte
Was ist angesagt?
Was ist angesagt? (20)
Andere mochten auch
Andere mochten auch (20)
Ähnlich wie Du pont analysis
Ähnlich wie Du pont analysis (20)
Mehr von jennna
Du pont analysis
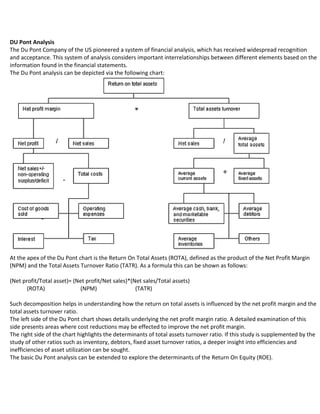
- 1. DU Pont Analysis The Du Pont Company of the US pioneered a system of financial analysis, which has received widespread recognition and acceptance. This system of analysis considers important interrelationships between different elements based on the information found in the financial statements. The Du Pont analysis can be depicted via the following chart: At the apex of the Du Pont chart is the Return On Total Assets (ROTA), defined as the product of the Net Profit Margin (NPM) and the Total Assets Turnover Ratio (TATR). As a formula this can be shown as follows: (Net profit/Total asset)= (Net profit/Net sales)*(Net sales/Total assets) (ROTA) (NPM) (TATR) Such decomposition helps in understanding how the return on total assets is influenced by the net profit margin and the total assets turnover ratio. The left side of the Du Pont chart shows details underlying the net profit margin ratio. A detailed examination of this side presents areas where cost reductions may be effected to improve the net profit margin. The right side of the chart highlights the determinants of total assets turnover ratio. If this study is supplemented by the study of other ratios such as inventory, debtors, fixed asset turnover ratios, a deeper insight into efficiencies and inefficiencies of asset utilization can be sought. The basic Du Pont analysis can be extended to explore the determinants of the Return On Equity (ROE).
- 2. Return on equity= Asset turnover * Net profit margin*leverage (Net profit/Equity)= (Net profit/Sales)*(Sales/Total assets)*(Total assets/Equity) (ROE) (NPM) (TATR) 1/(1-DR) Where DR is the debt ratio= debt (D)/assets (A) Breaking ROE into these three parts allows evaluation of how well one can manage the company’s assets, expenses, and debt. A manager has basically three ways of improving operating performance in terms of ROA and ROE. These are: • Increase capital asset turnover • Increase operating profit margins • Change financial leverage Each of these primary drivers is impacted by the specific decisions on cost control, efficiency productivity, marketing choices etc. Importance of Dupont Analysis Any decision affecting the product prices, per unit costs, volume or efficiency has an impact on the profit margin or turnover ratios. Similarly any decision affecting the amount and ratio of debt or equity used will affect the financial structure and the overall cost of capital of a company. Therefore, these financial concepts are very important to evaluate as every business is competing for limited capital resources. Understanding the interrelationships among the various ratios such as turnover ratios, leverage, and profitability ratios helps companies to put their money areas where the risk adjusted return is the maximum.