Weitere ähnliche Inhalte Ähnlich wie Toronto Real Estate Market Starts 2013 on Positive Note Ähnlich wie Toronto Real Estate Market Starts 2013 on Positive Note (17) Kürzlich hochgeladen (20) 1. For All TREB Member Inquiries:
(416) 443-8152
For All Media/Public Inquiries:
January 2013 (416) 443-8158
Economic Indicators Positive Start to 2013 TorontoMLS Sales Activity1,7
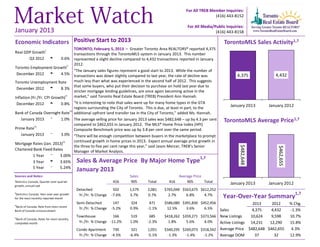
TORONTO, February 5, 2013 – Greater Toronto Area REALTORS® reported 4,375
Real GDP Growthi transactions through the TorontoMLS system in January 2013. This number
Q3 2012 t 0.6% represented a slight decline compared to 4,432 transactions reported in January
2012.
Toronto Employment Growthi i
“The January sales figures represent a good start to 2013. While the number of
December 2012 t 4.5% transactions was down slightly compared to last year, the rate of decline was 4,375 4,432
Toronto Unemployment Rate much less than what was experienced in the second half of 2012. This suggests
that some buyers, who put their decision to purchase on hold last year due to
December 2012 u 8.3%
stricter mortgage lending guidelines, are once again becoming active in the
Inflation (Yr./Yr. CPI Growth)
ii market,” said Toronto Real Estate Board (TREB) President Ann Hannah.
December 2012 t 0.8% “It is interesting to note that sales were up for many home types in the GTA
regions surrounding the City of Toronto. This is due, at least in part, to the
January 2013 January 2012
iii
Bank of Canada Overnight Rate additional upfront land transfer tax in the City of Toronto,” added Ms. Hannah.
January 2013 q 1.0% The average selling price for January 2013 sales was $482,648 – up by 4.3 per cent TorontoMLS Average Price1,7
iv
compared to $462,655 in January 2012. The MLS® Home Price Index (HPI)
Prime Rate Composite Benchmark price was up by 3.8 per cent over the same period.
January 2013 q 3.0% “There will be enough competition between buyers in the marketplace to prompt
iv continued growth in home prices in 2013. Expect annual average price growth in
Mortgage Rates (Jan. 2013)
the three to five per cent range this year,” said Jason Mercer, TREB’s Senior
$482,648
$462,655
Chartered Bank Fixed Rates Manager of Market Analysis.
1 Year q 3.00%
1,7
3 Year u 3.65% Sales & Average Price By Major Home Type
5 Year q 5.24%
January 2013
Sources and Notes: Sales Average Price
i
Statistics Canada, Quarter-over-quarter 416 905 Total 416 905 Total January 2013 January 2012
growth, annualized
Detached 502 1,579 2,081 $765,049 $563,675 $612,252
ii
Statistics Canada, Year-over-year growth 1,7
for the most recently reported month
Yr./Yr. % Change -7.6% 3.7% 0.7% 2.7% 6.8% 4.7% Year-Over-Year Summary
Semi-Detached 147 324 471 $586,080 $391,830 $452,456 2013 2012 % Chg.
iii
Bank of Canada, Rate from most recent
Yr./Yr. % Change -5.2% 0.9% -1.1% 12.5% 3.6% 6.5% Sales 4,375 4,432 -1.3%
Bank of Canada announcement
iv
Townhouse 166 519 685 $418,262 $359,271 $373,566 New Listings 10,624 9,598 10.7%
Bank of Canada, Rates for most recently
completed month Yr./Yr. % Change -11.2% 1.0% -2.3% 1.8% 5.6% 4.0% Active Listings 14,231 12,290 15.8%
Condo Apartment 730 321 1,051 $340,295 $269,073 $318,542 Average Price $482,648 $462,655 4.3%
Yr./Yr. % Change -4.5% -6.4% -5.1% -1.3% -1.4% -1.2% Average DOM 37 32 12.9%
2. Toronto Real Estate Board
SALES BY PRICE RANGE AND HOUSE TYPE1,7 JANUARY 2013
Price Range Detached Semi-Detached Att/Row/Twnhouse Condo Townhouse Condo Apt Link Co-op Apt Det Condo Co-ownership Apt Total
$0 to $99,999 2 0 1 2 12 0 0 0 0 17
$100,000 to $199,999 27 9 2 31 156 0 4 0 1 230
$200,000 to $299,999 164 38 44 102 369 14 1 3 1 736
$300,000 to $399,999 328 145 148 124 302 21 0 0 1 1,069
$400,000 to $499,999 408 178 116 27 130 23 0 1 0 883
$500,000 to $599,999 379 48 37 14 36 11 0 0 0 525
$600,000 to $699,999 248 24 11 3 22 6 0 0 0 314
$700,000 to $799,999 174 10 10 4 11 0 0 0 0 209
$800,000 to $899,999 96 7 3 2 5 0 0 0 0 113
$900,000 to $999,999 60 4 0 3 4 0 0 0 0 71
$1,000,000 to $1,249,999 92 5 1 0 1 0 0 0 0 99
$1,250,000 to $1,499,999 38 0 0 0 2 0 0 0 0 40
$1,500,000 to $1,749,999 20 1 0 0 1 0 0 0 0 22
$1,750,000 to $1,999,999 20 1 0 0 0 0 0 0 0 21
$2,000,000 + 25 1 0 0 0 0 0 0 0 26
Total Sales 2,081 471 373 312 1,051 75 5 4 3 4,375
Share of Total Sales 47.6% 10.8% 8.5% 7.1% 24.0% 1.7% 0.1% 0.1% 0.1% -
Average Price $612,252 $452,456 $411,757 $327,908 $318,542 $415,062 $141,000 $301,250 $220,333 $482,648
SALES BY PRICE RANGE AND HOUSE TYPE1,7 YEAR-TO-DATE, 2013
Price Range Detached Semi-Detached Att/Row/Twnhouse Condo Townhouse Condo Apt Link Co-op Apt Det Condo Co-ownership Apt Total
$0 to $99,999 2 0 1 2 12 0 0 0 0 17
$100,000 to $199,999 27 9 2 31 156 0 4 0 1 230
$200,000 to $299,999 164 38 44 102 369 14 1 3 1 736
$300,000 to $399,999 328 145 148 124 302 21 0 0 1 1,069
$400,000 to $499,999 408 178 116 27 130 23 0 1 0 883
$500,000 to $599,999 379 48 37 14 36 11 0 0 0 525
$600,000 to $699,999 248 24 11 3 22 6 0 0 0 314
$700,000 to $799,999 174 10 10 4 11 0 0 0 0 209
$800,000 to $899,999 96 7 3 2 5 0 0 0 0 113
$900,000 to $999,999 60 4 0 3 4 0 0 0 0 71
$1,000,000 to $1,249,999 92 5 1 0 1 0 0 0 0 99
$1,250,000 to $1,499,999 38 0 0 0 2 0 0 0 0 40
$1,500,000 to $1,749,999 20 1 0 0 1 0 0 0 0 22
$1,750,000 to $1,999,999 20 1 0 0 0 0 0 0 0 21
$2,000,000 + 25 1 0 0 0 0 0 0 0 26
Total Sales 2,081 471 373 312 1,051 75 5 4 3 4,375
Share of Total Sales 47.6% 10.8% 8.5% 7.1% 24.0% 1.7% 0.1% 0.1% 0.1% -
Average Price $612,252 $452,456 $411,757 $327,908 $318,542 $415,062 $141,000 $301,250 $220,333 $482,648
Page 3 July 2010
Market Watch, January 2013 2
3. Toronto Real Estate Board
ALL HOME TYPES, JANUARY 2013
SUMMARY OF EXISTING HOME TRANSACTIONS
ALL TREB AREAS
Number of Sales Dollar Volume1 Average Price1 Median Price1 New Listings2 SNLR (Trend) 8 Active Listings3 Mos. Inv. (Trend)9 Avg. SP/LP 4 Avg. DOM5
TREB Total 4,375 $2,111,585,195 $482,648 $412,500 10,624 53.5% 14,231 2.6 98% 37
Halton Region 340 $187,032,388 $550,095 $472,000 729 56.7% 983 2.5 98% 36
Burlington 55 $27,282,749 $496,050 $455,000 106 58.7% 164 2.7 98% 34
Halton Hills 57 $24,370,911 $427,560 $420,000 124 63.7% 177 2.4 98% 38
Milton 106 $48,370,728 $456,328 $440,950 218 56.1% 221 2.0 98% 28
Oakville 122 $87,008,000 $713,180 $604,000 281 54.1% 421 2.9 97% 41
Peel Region 1,008 $433,997,267 $430,553 $386,000 2,332 52.5% 3,002 2.4 97% 36
Brampton 431 $176,057,665 $408,486 $379,000 1,002 51.6% 1,246 2.3 97% 34
Caledon 34 $18,236,992 $536,382 $486,250 114 51.4% 222 4.0 97% 52
Mississauga 543 $239,702,610 $441,441 $395,000 1,216 53.3% 1,534 2.4 97% 36
City of Toronto 1,559 $791,751,646 $507,859 $413,500 4,207 50.6% 5,736 2.7 98% 37
! TURN PAGE FOR CITY OF TORONTO
TABLES OR CLICK HERE:
York Region 821 $480,658,630 $585,455 $523,888 1,984 52.7% 2,666 2.5 97% 38
Aurora 42 $22,574,050 $537,477 $465,000 126 60.1% 155 2.2 98% 38
E. Gwillimbury 21 $9,493,300 $452,062 $405,000 41 58.0% 76 3.2 97% 32
Georgina 44 $13,241,259 $300,938 $282,500 83 65.5% 141 3.0 98% 47
King 10 $5,219,900 $521,990 $488,950 58 42.9% 136 6.3 96% 74
Markham 204 $122,314,812 $599,582 $554,000 458 51.9% 621 2.4 97% 42
Newmarket 65 $29,790,932 $458,322 $436,000 139 68.9% 146 1.5 98% 27
Richmond Hill 182 $124,324,586 $683,102 $635,400 415 48.3% 508 2.5 97% 40
Vaughan 211 $132,268,604 $626,865 $565,000 547 50.4% 698 2.6 97% 35
Whitchurch-Stouffville 42 $21,431,187 $510,266 $476,750 117 49.2% 185 3.4 97% 30
Durham Region 508 $169,495,248 $333,652 $315,000 1,056 64.3% 1,280 2.0 98% 29
Ajax 96 $34,174,772 $355,987 $339,700 168 66.6% 164 1.5 99% 25
Brock 9 $2,384,900 $264,989 $218,000 33 44.8% 91 7.4 95% 65
Clarington 89 $25,164,079 $282,742 $273,000 172 68.0% 203 2.0 98% 31
Oshawa 124 $33,665,142 $271,493 $250,000 243 66.3% 271 1.8 98% 27
Pickering 59 $23,814,855 $403,642 $382,500 142 61.9% 162 1.9 98% 28
Scugog 16 $6,094,400 $380,900 $341,500 47 52.7% 85 4.5 98% 61
Uxbridge 11 $5,331,600 $484,691 $435,000 34 54.4% 87 4.3 98% 46
Whitby 104 $38,865,500 $373,707 $344,000 217 65.4% 217 1.6 99% 26
Dufferin County 27 $8,266,200 $306,156 $290,000 74 72.5% 107 2.3 98% 41
Orangeville 27 $8,266,200 $306,156 $290,000 74 72.5% 107 2.3 98% 41
Simcoe County 112 $40,383,816 $360,570 $327,875 242 59.5% 457 3.7 97% 64
Adjala-Tosorontio 8 $4,296,888 $537,111 $474,000 18 50.5% 50 6.3 96% 59
Bradford West Gwillimbury 40 $15,799,138 $394,978 $367,500 74 60.2% 99 2.5 98% 42
Essa 9 $2,596,500 $288,500 $286,500 23 57.5% 50 4.6 96% 112
Innisfil 22 $7,336,990 $333,500 $322,500 67 56.0% 140 4.4 96% 86
New Tecumseth 33 $10,354,300 $313,767 $262,500 60 67.1% 118 3.0 97% 63
Page 3 July 2010
Market Watch, January 2013 3
4. Toronto Real Estate Board
ALL HOME TYPES, JANUARY 2013
SUMMARY OF EXISTING HOME TRANSACTIONS
CITY OF TORONTO MUNICIPAL BREAKDOWN
1 1 1 2 8 3 4 5
Number of Sales Dollar Volume Average Price Median Price New Listings SNLR (Trend) Active Listings Mos. Inv. (Trend)9 Avg. SP/LP Avg. DOM
TREB Total 4,375 $2,111,585,195 $482,648 $412,500 10,624 53.5% 14,231 2.6 98% 37
City of Toronto Total 1,559 $791,751,646 $507,859 $413,500 4,207 50.6% 5,736 2.7 98% 37
Toronto West 392 $169,200,851 $431,635 $390,500 1,056 53.7% 1,467 2.7 98% 39
Toronto W01 17 $7,683,400 $451,965 $340,000 65 50.6% 78 2.6 98% 38
Toronto W02 37 $20,129,200 $544,032 $575,000 60 64.4% 70 1.4 101% 32
Toronto W03 39 $16,263,000 $417,000 $415,000 61 65.8% 82 1.8 99% 36
Toronto W04 33 $13,344,200 $404,370 $358,900 83 56.9% 137 2.7 97% 50
Toronto W05 48 $18,880,850 $393,351 $411,000 115 56.2% 192 2.9 97% 44
Toronto W06 48 $20,646,189 $430,129 $371,500 277 40.0% 390 4.1 96% 43
Toronto W07 14 $9,228,250 $659,161 $590,625 32 66.7% 30 1.4 100% 17
Toronto W08 69 $35,517,202 $514,742 $480,000 207 53.8% 268 2.7 99% 35
Toronto W09 37 $13,559,700 $366,478 $360,000 59 55.4% 72 2.8 97% 41
Toronto W10 50 $13,948,860 $278,977 $256,450 97 53.4% 148 2.8 97% 42
Toronto Central 706 $428,047,371 $606,299 $435,000 2,208 45.6% 3,080 3.2 98% 39
Toronto C01 186 $82,689,050 $444,565 $380,000 649 41.3% 977 3.8 97% 38
Toronto C02 26 $26,714,300 $1,027,473 $767,500 127 43.4% 202 4.0 97% 44
Toronto C03 17 $10,388,388 $611,082 $437,500 70 55.0% 92 2.3 101% 14
Toronto C04 44 $46,251,447 $1,051,169 $937,500 147 49.9% 183 2.6 99% 23
Toronto C06 14 $8,197,900 $585,564 $454,950 45 50.4% 62 2.8 95% 48
Toronto C07 62 $32,457,088 $523,501 $388,000 179 44.1% 231 3.2 98% 39
Toronto C08 63 $28,168,388 $447,117 $380,000 192 47.3% 272 3.0 98% 48
Toronto C09 13 $19,258,000 $1,481,385 $1,095,000 55 53.5% 65 2.7 100% 23
Toronto C10 35 $19,363,045 $553,230 $479,000 77 58.3% 80 1.9 99% 30
Toronto C11 24 $12,653,170 $527,215 $315,750 65 54.1% 87 2.5 100% 46
Toronto C12 14 $25,775,900 $1,841,136 $1,525,000 81 39.7% 137 4.7 95% 40
Toronto C13 37 $24,259,900 $655,673 $495,000 97 55.2% 116 2.2 97% 34
Toronto C14 99 $56,164,000 $567,313 $425,000 249 41.5% 356 3.4 97% 50
Toronto C15 72 $35,706,795 $495,928 $454,500 175 47.3% 220 3.0 97% 39
Toronto East 461 $194,503,424 $421,916 $389,000 943 57.1% 1,189 2.1 99% 32
Toronto E01 36 $21,247,900 $590,219 $565,000 93 59.4% 106 1.6 102% 26
Toronto E02 25 $18,432,900 $737,316 $648,000 67 58.5% 66 1.5 100% 11
Toronto E03 51 $26,531,000 $520,216 $506,000 112 58.5% 101 1.6 100% 20
Toronto E04 70 $25,094,368 $358,491 $390,000 115 58.3% 150 2.2 97% 33
Toronto E05 41 $15,245,488 $371,841 $332,500 67 59.5% 90 1.8 98% 33
Toronto E06 16 $6,894,600 $430,913 $403,000 35 53.7% 38 1.8 97% 35
Toronto E07 46 $16,460,888 $357,845 $286,000 80 52.8% 141 2.7 102% 49
Toronto E08 35 $15,326,830 $437,909 $350,000 87 55.3% 114 2.6 95% 29
Toronto E09 57 $17,939,850 $314,734 $295,000 132 56.2% 157 2.5 98% 33
Toronto E10 28 $13,617,600 $486,343 $465,750 68 58.2% 103 2.1 99% 40
Toronto E11 56 $17,712,000 $316,286 $295,000 87 56.1% 123 2.4 97% 40
Page 3 July 2010
Market Watch, January 2013 4
5. Toronto Real Estate Board
ALL HOME TYPES, YEAR-TO-DATE 2013
SUMMARY OF EXISTING HOME TRANSACTIONS
ALL TREB AREAS
Number of Sales Dollar Volume1 Average Price1 Median Price1 New Listings2 Avg. SP/LP 4 Avg. DOM5
TREB Total 4,375 $2,111,585,195 $482,648 $412,500 10,624 98% 37
Halton Region 340 $187,032,388 $550,095 $472,000 729 98% 36
Burlington 55 $27,282,749 $496,050 $455,000 106 98% 34
Halton Hills 57 $24,370,911 $427,560 $420,000 124 98% 38
Milton 106 $48,370,728 $456,328 $440,950 218 98% 28
Oakville 122 $87,008,000 $713,180 $604,000 281 97% 41
Peel Region 1,008 $433,997,267 $430,553 $386,000 2,332 97% 36
Brampton 431 $176,057,665 $408,486 $379,000 1,002 97% 34
Caledon 34 $18,236,992 $536,382 $486,250 114 97% 52
Mississauga 543 $239,702,610 $441,441 $395,000 1,216 97% 36
City of Toronto 1,559 $791,751,646 $507,859 $413,500 4,207 98% 37
! TURN PAGE FOR CITY OF TORONTO
TABLES OR CLICK HERE:
York Region 821 $480,658,630 $585,455 $523,888 1,984 97% 38
Aurora 42 $22,574,050 $537,477 $465,000 126 98% 38
E. Gwillimbury 21 $9,493,300 $452,062 $405,000 41 97% 32
Georgina 44 $13,241,259 $300,938 $282,500 83 98% 47
King 10 $5,219,900 $521,990 $488,950 58 96% 74
Markham 204 $122,314,812 $599,582 $554,000 458 97% 42
Newmarket 65 $29,790,932 $458,322 $436,000 139 98% 27
Richmond Hill 182 $124,324,586 $683,102 $635,400 415 97% 40
Vaughan 211 $132,268,604 $626,865 $565,000 547 97% 35
Whitchurch-Stouffville 42 $21,431,187 $510,266 $476,750 117 97% 30
Durham Region 508 $169,495,248 $333,652 $315,000 1,056 98% 29
Ajax 96 $34,174,772 $355,987 $339,700 168 99% 25
Brock 9 $2,384,900 $264,989 $218,000 33 95% 65
Clarington 89 $25,164,079 $282,742 $273,000 172 98% 31
Oshawa 124 $33,665,142 $271,493 $250,000 243 98% 27
Pickering 59 $23,814,855 $403,642 $382,500 142 98% 28
Scugog 16 $6,094,400 $380,900 $341,500 47 98% 61
Uxbridge 11 $5,331,600 $484,691 $435,000 34 98% 46
Whitby 104 $38,865,500 $373,707 $344,000 217 99% 26
Dufferin County 27 $8,266,200 $306,156 $290,000 74 98% 41
Orangeville 27 $8,266,200 $306,156 $290,000 74 98% 41
Simcoe County 112 $40,383,816 $360,570 $327,875 242 97% 64
Adjala-Tosorontio 8 $4,296,888 $537,111 $474,000 18 96% 59
Bradford West Gwillimbury 40 $15,799,138 $394,978 $367,500 74 98% 42
Essa 9 $2,596,500 $288,500 $286,500 23 96% 112
Innisfil 22 $7,336,990 $333,500 $322,500 67 96% 86
New Tecumseth 33 $10,354,300 $313,767 $262,500 60 97% 63
Page 3 July 2010
Market Watch, January 2013 5
6. Toronto Real Estate Board
ALL HOME TYPES, YEAR-TO-DATE 2013
SUMMARY OF EXISTING HOME TRANSACTIONS
CITY OF TORONTO MUNICIPAL BREAKDOWN
1 1 1 2 4 5
Number of Sales Dollar Volume Average Price Median Price New Listings Avg. SP/LP Avg. DOM
TREB Total 4,375 $2,111,585,195 $482,648 $412,500 10,624 98% 37
City of Toronto Total 1,559 $791,751,646 $507,859 $413,500 4,207 98% 37
Toronto West 392 $169,200,851 $431,635 $390,500 1,056 98% 39
Toronto W01 17 $7,683,400 $451,965 $340,000 65 98% 38
Toronto W02 37 $20,129,200 $544,032 $575,000 60 101% 32
Toronto W03 39 $16,263,000 $417,000 $415,000 61 99% 36
Toronto W04 33 $13,344,200 $404,370 $358,900 83 97% 50
Toronto W05 48 $18,880,850 $393,351 $411,000 115 97% 44
Toronto W06 48 $20,646,189 $430,129 $371,500 277 96% 43
Toronto W07 14 $9,228,250 $659,161 $590,625 32 100% 17
Toronto W08 69 $35,517,202 $514,742 $480,000 207 99% 35
Toronto W09 37 $13,559,700 $366,478 $360,000 59 97% 41
Toronto W10 50 $13,948,860 $278,977 $256,450 97 97% 42
Toronto Central 706 $428,047,371 $606,299 $435,000 2,208 98% 39
Toronto C01 186 $82,689,050 $444,565 $380,000 649 97% 38
Toronto C02 26 $26,714,300 $1,027,473 $767,500 127 97% 44
Toronto C03 17 $10,388,388 $611,082 $437,500 70 101% 14
Toronto C04 44 $46,251,447 $1,051,169 $937,500 147 99% 23
Toronto C06 14 $8,197,900 $585,564 $454,950 45 95% 48
Toronto C07 62 $32,457,088 $523,501 $388,000 179 98% 39
Toronto C08 63 $28,168,388 $447,117 $380,000 192 98% 48
Toronto C09 13 $19,258,000 $1,481,385 $1,095,000 55 100% 23
Toronto C10 35 $19,363,045 $553,230 $479,000 77 99% 30
Toronto C11 24 $12,653,170 $527,215 $315,750 65 100% 46
Toronto C12 14 $25,775,900 $1,841,136 $1,525,000 81 95% 40
Toronto C13 37 $24,259,900 $655,673 $495,000 97 97% 34
Toronto C14 99 $56,164,000 $567,313 $425,000 249 97% 50
Toronto C15 72 $35,706,795 $495,928 $454,500 175 97% 39
Toronto East 461 $194,503,424 $421,916 $389,000 943 99% 32
Toronto E01 36 $21,247,900 $590,219 $565,000 93 102% 26
Toronto E02 25 $18,432,900 $737,316 $648,000 67 100% 11
Toronto E03 51 $26,531,000 $520,216 $506,000 112 100% 20
Toronto E04 70 $25,094,368 $358,491 $390,000 115 97% 33
Toronto E05 41 $15,245,488 $371,841 $332,500 67 98% 33
Toronto E06 16 $6,894,600 $430,913 $403,000 35 97% 35
Toronto E07 46 $16,460,888 $357,845 $286,000 80 102% 49
Toronto E08 35 $15,326,830 $437,909 $350,000 87 95% 29
Toronto E09 57 $17,939,850 $314,734 $295,000 132 98% 33
Toronto E10 28 $13,617,600 $486,343 $465,750 68 99% 40
Toronto E11 56 $17,712,000 $316,286 $295,000 87 97% 40
Page 3 July 2010
Market Watch, January 2013 6
7. Toronto Real Estate Board
DETACHED HOUSES, JANUARY 2013
Industrial Leasing
SUMMARY OF EXISTING HOME TRANSACTIONS
ALL TREB AREAS
Sales1 Dollar Volume1 Average Price1 Median Price1 New Listings2 Active Listings3 Avg. SP/LP 4 Avg. DOM5
TREB Total 2,081
- $1,274,097,168
- $612,252
- $526,000
- 5,042
- 6,779
- 97%
- 36
-
Halton Region 216 $140,504,038 $650,482 $545,500 457 690 97% 39
Burlington 28 $17,185,049 $613,752 $537,500 62 118 99% 35
Halton Hills 44 $20,008,411 $454,737 $429,500 101 154 98% 41
Milton 57 $30,527,078 $535,563 $520,000 123 137 98% 30
Oakville 87
- $72,783,500
- $836,592
- $671,000
- 171
- 281
- 96%
- 45
-
Peel Region 421 $239,144,700 $568,040 $515,000 1,105 1,491 97% 35
Brampton 228 $110,050,845 $482,679 $461,000 599 783 97% 36
Caledon 28 $15,668,002 $559,572 $520,000 99 204 97% 56
Mississauga 165
- $113,425,853
- $687,429
- $619,000
- 407
- 504
- 97%
- 31
-
City of Toronto 502 $384,054,373 $765,049 $610,000 1,251 1,469 98% 31
! TURN PAGE FOR CITY OF TORONTO
TABLES OR CLICK HERE:
- - - - - - - -
York Region 491 $343,240,743 $699,065 $645,000 1,203 1,660 97% 38
Aurora 25 $15,637,000 $625,480 $584,000 73 96 97% 36
E. Gwillimbury 18 $8,409,400 $467,189 $417,500 38 73 97% 31
Georgina 40 $12,336,000 $308,400 $300,000 78 136 98% 48
King 7 $3,986,900 $569,557 $503,000 57 123 96% 71
Markham 99 $77,748,086 $785,334 $710,000 207 268 97% 42
Newmarket 46 $22,828,432 $496,270 $486,000 97 108 98% 27
Richmond Hill 112 $95,917,988 $856,411 $759,500 240 300 97% 40
Vaughan 116 $90,447,049 $779,716 $672,500 324 412 96% 36
Whitchurch-Stouffville 28
- $15,929,888
- $568,925
- $540,000
- 89
- 144
- 97%
- 26
-
Durham Region 345 $127,671,798 $370,063 $347,000 778 991 98% 29
Ajax 52 $20,895,072 $401,828 $391,000 112 113 99% 24
Brock 9 $2,384,900 $264,989 $218,000 32 89 95% 65
Clarington 64 $19,576,729 $305,886 $298,500 122 157 98% 35
Oshawa 90 $27,652,342 $307,248 $287,500 185 202 98% 24
Pickering 38 $17,574,355 $462,483 $439,000 90 104 99% 24
Scugog 13 $5,351,400 $411,646 $357,000 45 84 98% 72
Uxbridge 10 $4,984,100 $498,410 $450,000 30 75 98% 42
Whitby 69
- $29,252,900
- $423,955
- $412,000
- 162
- 167
- 99%
- 23
-
Dufferin County 18 $6,126,800 $340,378 $319,000 55 83 98% 35
Orangeville 18
- $6,126,800
- $340,378
- $319,000
- 55
- 83
- 98%
- 35
-
Simcoe County 88 $33,354,716 $379,031 $358,250 193 395 97% 69
Adjala-Tosorontio 8 $4,296,888 $537,111 $474,000 18 50 96% 59
Bradford West Gwillimbury 27 $11,644,938 $431,294 $440,000 47 78 97% 46
Essa 9 $2,596,500 $288,500 $286,500 19 45 96% 112
Innisfil 22 $7,336,990 $333,500 $322,500 64 137 96% 86
New Tecumseth 22 $7,479,400 $339,973 $291,000 45 85 97% 66
Page 3 July 2010
Market Watch, January 2013 7
8. Toronto Real Estate Board
DETACHED HOUSES, JANUARY 2013
Industrial Leasing
SUMMARY OF EXISTING HOME TRANSACTIONS
CITY OF TORONTO MUNICIPAL BREAKDOWN
Sales1 Dollar Volume1 Average Price1 Median Price1 New Listings2 Active Listings3 Avg. SP/LP 4 Avg. DOM5
TREB Total 2,081 $1,274,097,168 $612,252 $526,000 5,042 6,779 97% 36
City of Toronto Total 502 $384,054,373 $765,049 $610,000 1,251 1,469 98% 31
Toronto West 148 $88,175,461 $595,780 $541,500 334 394 98% 31
Toronto W01 1 $1,210,000 $1,210,000 $1,210,000 9 12 97% 15
Toronto W02 11 $7,347,000 $667,909 $646,000 19 23 98% 38
Toronto W03 19 $8,667,000 $456,158 $432,000 34 42 99% 33
Toronto W04 17 $9,508,800 $559,341 $483,000 41 56 97% 37
Toronto W05 17 $9,979,500 $587,029 $560,000 32 38 97% 39
Toronto W06 11 $5,391,989 $490,181 $505,000 38 48 97% 26
Toronto W07 8 $6,205,500 $775,688 $682,000 21 21 101% 12
Toronto W08 29 $22,669,212 $781,697 $690,000 80 84 100% 22
Toronto W09 15 $8,639,500 $575,967 $552,000 24 31 97% 41
Toronto W10 20 $8,556,960 $427,848 $403,750 36 39 96% 30
Toronto Central 154 $185,173,356 $1,202,424 $996,500 517 646 98% 30
Toronto C01 2 $1,992,000 $996,000 $996,000 5 11 91% 60
Toronto C02 8 $11,604,300 $1,450,538 $1,086,250 23 23 98% 37
Toronto C03 9 $6,825,888 $758,432 $635,000 44 59 101% 8
Toronto C04 33 $41,531,418 $1,258,528 $1,182,000 101 115 99% 21
Toronto C06 7 $5,972,000 $853,143 $850,000 20 28 94% 52
Toronto C07 18 $16,499,550 $916,642 $793,500 64 87 97% 35
Toronto C08 - - - - 1 4 - -
Toronto C09 8 $15,672,000 $1,959,000 $1,987,500 23 27 101% 16
Toronto C10 3 $3,041,000 $1,013,667 $910,000 15 15 99% 30
Toronto C11 5 $6,260,000 $1,252,000 $1,130,000 23 21 101% 38
Toronto C12 10 $22,045,000 $2,204,500 $2,227,500 65 104 95% 36
Toronto C13 11 $14,476,000 $1,316,000 $920,000 25 31 96% 41
Toronto C14 20 $23,361,700 $1,168,085 $1,131,000 64 77 96% 33
Toronto C15 20 $15,892,500 $794,625 $763,000 44 44 97% 31
Toronto East 200 $110,705,556 $553,528 $477,500 400 429 99% 32
Toronto E01 13 $8,429,900 $648,454 $639,000 24 19 103% 25
Toronto E02 13 $10,314,900 $793,454 $768,000 27 25 98% 12
Toronto E03 31 $17,715,000 $571,452 $510,000 72 63 99% 20
Toronto E04 39 $17,186,256 $440,673 $437,500 45 45 97% 33
Toronto E05 10 $6,357,800 $635,780 $626,500 19 21 99% 32
Toronto E06 14 $6,287,600 $449,114 $423,500 29 33 97% 37
Toronto E07 11 $6,956,300 $632,391 $588,000 16 23 107% 72
Toronto E08 14 $10,384,750 $741,768 $488,500 45 50 95% 24
Toronto E09 22 $9,050,550 $411,389 $403,750 52 47 99% 21
Toronto E10 17 $10,682,500 $628,382 $595,000 42 62 99% 46
Toronto E11 16 $7,340,000 $458,750 $435,000 29 41 96% 46
Page 3 July 2010
Market Watch, January 2013 8
9. Toronto Real Estate Board
SEMI-DETACHED HOUSES, JANUARY 2013
Industrial Leasing
SUMMARY OF EXISTING HOME TRANSACTIONS
ALL TREB AREAS
Sales1 Dollar Volume1 Average Price1 Median Price1 New Listings2 Active Listings3 Avg. SP/LP 4 Avg. DOM5
TREB Total 471
- $213,106,595
- $452,456
- $420,000
- 789
- 749
- 99%
- 26
-
Halton Region 25 $10,414,550 $416,582 $409,000 42 37 99% 26
Burlington 5 $2,241,900 $448,380 $465,000 5 3 99% 31
Halton Hills 4 $1,443,200 $360,800 $374,150 7 6 99% 33
Milton 10 $4,081,450 $408,145 $402,000 21 19 99% 20
Oakville 6- $2,648,000
- $441,333
- $415,000
- 9- 9- 99%
- 28
-
Peel Region 192 $75,708,090 $394,313 $385,301 311 310 98% 29
Brampton 101 $36,129,523 $357,718 $362,501 175 174 98% 29
Caledon 3 $1,211,000 $403,667 $415,000 6 5 99% 20
Mississauga 88
- $38,367,567
- $435,995
- $437,250
- 130
- 131
- 98%
- 29
-
City of Toronto 147 $86,153,767 $586,080 $515,000 252 234 100% 22
! TURN PAGE FOR CITY OF TORONTO
TABLES OR CLICK HERE:
- - - - - - - -
York Region 64 $29,700,988 $464,078 $479,500 120 109 99% 26
Aurora 4 $1,758,900 $439,725 $445,000 6 4 100% 27
E. Gwillimbury 1 $425,000 $425,000 $425,000 1 2 97% 18
Georgina - - - - 1 2 - -
King - - - - - - - -
Markham 16 $7,685,888 $480,368 $488,950 31 24 99% 17
Newmarket 8 $2,992,000 $374,000 $378,000 20 17 99% 27
Richmond Hill 5 $2,517,400 $503,480 $490,000 10 11 98% 42
Vaughan 23 $11,398,500 $495,587 $487,000 42 40 98% 26
Whitchurch-Stouffville 7- $2,923,300
- $417,614
- $415,500
- 9- 9- 99%
- 35
-
Durham Region 34 $8,766,600 $257,841 $226,000 50 41 99% 25
Ajax 9 $3,128,700 $347,633 $345,200 13 8 100% 14
Brock - - - - - - - -
Clarington 1 $208,000 $208,000 $208,000 6 6 99% 13
Oshawa 15 $2,970,400 $198,027 $198,000 17 18 97% 37
Pickering 1 $406,000 $406,000 $406,000 4 5 98% 6
Scugog 2 $463,000 $231,500 $231,500 2 - 100% 3
Uxbridge - - - - - - - -
Whitby 6- $1,590,500
- $265,083
- $257,750
- 8- 4- 100%
- 24
-
Dufferin County 2 $488,400 $244,200 $244,200 4 5 100% 43
Orangeville 2
- $488,400
- $244,200
- $244,200
- 4
- 5
- 100%
- 43
-
Simcoe County 7 $1,874,200 $267,743 $274,000 10 13 98% 41
Adjala-Tosorontio - - - - - - - -
Bradford West Gwillimbury 4 $1,199,200 $299,800 $302,600 7 5 99% 10
Essa - - - - 2 2 - -
Innisfil - - - - - - - -
New Tecumseth 3 $675,000 $225,000 $225,000 1 6 97% 83
Page 3 July 2010
Market Watch, January 2013 9
10. Toronto Real Estate Board
SEMI-DETACHED HOUSES, JANUARY 2013
Industrial Leasing
SUMMARY OF EXISTING HOME TRANSACTIONS
CITY OF TORONTO MUNICIPAL BREAKDOWN
Sales1 Dollar Volume1 Average Price1 Median Price1 New Listings2 Active Listings3 Avg. SP/LP 4 Avg. DOM5
TREB Total 471 $213,106,595 $452,456 $420,000 789 749 99% 26
City of Toronto Total 147 $86,153,767 $586,080 $515,000 252 234 100% 22
Toronto West 41 $20,503,850 $500,094 $461,000 73 84 100% 23
Toronto W01 1 $529,000 $529,000 $529,000 1 2 100% 17
Toronto W02 11 $6,676,900 $606,991 $587,500 15 10 104% 24
Toronto W03 10 $4,938,000 $493,800 $469,500 20 23 100% 19
Toronto W04 1 $442,500 $442,500 $442,500 3 8 92% 60
Toronto W05 10 $4,142,550 $414,255 $412,500 23 29 97% 21
Toronto W06 3 $1,825,000 $608,333 $625,000 5 7 95% 28
Toronto W07 - - - - - 1 - -
Toronto W08 - - - - - - - -
Toronto W09 2 $851,900 $425,950 $425,950 2 1 98% 40
Toronto W10 3 $1,098,000 $366,000 $365,000 4 3 101% 6
Toronto Central 50 $35,854,229 $717,085 $625,000 77 69 98% 24
Toronto C01 11 $9,586,000 $871,455 $750,000 15 13 96% 35
Toronto C02 4 $5,168,000 $1,292,000 $1,187,500 12 13 98% 18
Toronto C03 5 $2,773,500 $554,700 $437,500 9 9 101% 26
Toronto C04 1 $805,029 $805,029 $805,029 5 4 105% 6
Toronto C06 - - - - - 1 - -
Toronto C07 4 $2,059,000 $514,750 $517,500 1 1 98% 43
Toronto C08 4 $3,405,000 $851,250 $852,500 3 3 98% 28
Toronto C09 - - - - - - - -
Toronto C10 3 $2,020,000 $673,333 $681,000 4 2 105% 6
Toronto C11 4 $2,940,000 $735,000 $735,000 6 2 100% 6
Toronto C12 - - - - 1 1 - -
Toronto C13 6 $2,912,000 $485,333 $476,750 6 4 98% 34
Toronto C14 1 $688,000 $688,000 $688,000 1 - 106% 8
Toronto C15 7 $3,497,700 $499,671 $490,000 14 16 97% 15
Toronto East 56 $29,795,688 $532,066 $477,500 102 81 101% 20
Toronto E01 15 $9,278,000 $618,533 $570,000 25 21 103% 30
Toronto E02 8 $5,880,000 $735,000 $628,000 20 15 101% 11
Toronto E03 11 $6,194,700 $563,155 $550,000 21 13 105% 10
Toronto E04 5 $2,163,000 $432,600 $445,000 10 7 98% 9
Toronto E05 - - - - 2 3 - -
Toronto E06 1 $375,000 $375,000 $375,000 3 2 99% 4
Toronto E07 5 $2,128,488 $425,698 $426,800 5 4 98% 36
Toronto E08 - - - - - - - -
Toronto E09 2 $683,500 $341,750 $341,750 2 1 96% 7
Toronto E10 3 $1,048,000 $349,333 $329,000 6 5 99% 16
Toronto E11 6 $2,045,000 $340,833 $330,000 8 10 97% 33
Page 3 July 2010
Market Watch, January 2013 10
11. Toronto Real Estate Board
CONDOMINIUM TOWNHOUSES, JANUARY 2013
Industrial Leasing
SUMMARY OF EXISTING HOME TRANSACTIONS
ALL TREB AREAS
Sales1 Dollar Volume1 Average Price1 Median Price1 New Listings2 Active Listings3 Avg. SP/LP 4 Avg. DOM5
TREB Total 312
- $102,307,388
- $327,908
- $315,000
- 649
- 826
- 98%
- 39
-
Halton Region 20 $6,687,400 $334,370 $312,500 53 59 98% 37
Burlington 7 $2,669,000 $381,286 $355,000 15 14 97% 33
Halton Hills 3 $864,000 $288,000 $256,000 4 4 97% 35
Milton 6 $1,830,400 $305,067 $306,750 12 10 99% 35
Oakville 4- $1,324,000
- $331,000
- $333,500
- 22
- 31
- 97%
- 51
-
Peel Region 111 $34,305,888 $309,062 $305,000 234 253 97% 36
Brampton 25 $6,444,400 $257,776 $250,000 54 64 98% 34
Caledon - - - - 2 2 - -
Mississauga 86
- $27,861,488
- $323,971
- $319,500
- 178
- 187
- 97%
- 36
-
City of Toronto 110 $39,338,712 $357,625 $328,000 229 341 98% 42
! TURN PAGE FOR CITY OF TORONTO
TABLES OR CLICK HERE:
- - - - - - - -
York Region 38 $14,662,988 $385,868 $363,250 75 93 98% 41
Aurora 4 $1,686,400 $421,600 $417,450 11 12 96% 33
E. Gwillimbury - - - - - - - -
Georgina - - - - - - - -
King - - - - - - - -
Markham 16 $6,628,688 $414,293 $391,000 35 42 98% 44
Newmarket 2 $627,500 $313,750 $313,750 4 6 98% 38
Richmond Hill 12 $4,271,900 $355,992 $350,950 11 17 98% 46
Vaughan 4 $1,448,500 $362,125 $358,750 13 15 98% 20
Whitchurch-Stouffville -
- -
- -
- -
- 1- 1- -
- -
-
Durham Region 30 $6,668,900 $222,297 $223,500 50 71 97% 43
Ajax 3 $858,000 $286,000 $265,000 10 18 99% 41
Brock - - - - 1 2 - -
Clarington 1 $152,000 $152,000 $152,000 4 5 101% 7
Oshawa 11 $1,529,000 $139,000 $118,000 14 21 96% 41
Pickering 9 $2,523,000 $280,333 $280,000 18 19 97% 42
Scugog - - - - - - - -
Uxbridge 1 $347,500 $347,500 $347,500 - 3 94% 85
Whitby 5- $1,259,400
- $251,880
- $220,000
- 3- 3- 98%
- 48
-
Dufferin County 2 $368,500 $184,250 $184,250 3 5 97% 72
Orangeville 2
- $368,500
- $184,250
- $184,250
- 3
- 5
- 97%
- 72
-
Simcoe County 1 $275,000 $275,000 $275,000 5 4 98% 13
Adjala-Tosorontio - - - - - - - -
Bradford West Gwillimbury 1 $275,000 $275,000 $275,000 4 2 98% 13
Essa - - - - - - - -
Innisfil - - - - - - - -
New Tecumseth - - - - 1 2 - -
Page 3 July 2010
Market Watch, January 2013 11
12. Toronto Real Estate Board
CONDOMINIUM TOWNHOUSES, JANUARY 2013
Industrial Leasing
SUMMARY OF EXISTING HOME TRANSACTIONS
CITY OF TORONTO MUNICIPAL BREAKDOWN
Sales1 Dollar Volume1 Average Price1 Median Price1 New Listings2 Active Listings3 Avg. SP/LP 4 Avg. DOM5
TREB Total 312 $102,307,388 $327,908 $315,000 649 826 98% 39
City of Toronto Total 110 $39,338,712 $357,625 $328,000 229 341 98% 42
Toronto West 33 $10,007,500 $303,258 $315,000 69 109 98% 47
Toronto W01 3 $892,500 $297,500 $317,000 3 5 97% 36
Toronto W02 4 $2,072,000 $518,000 $360,500 8 11 102% 48
Toronto W03 1 $260,000 $260,000 $260,000 1 7 98% 4
Toronto W04 2 $640,000 $320,000 $320,000 6 11 98% 76
Toronto W05 7 $1,453,900 $207,700 $210,000 12 24 96% 91
Toronto W06 3 $1,319,800 $439,933 $379,400 4 11 100% 34
Toronto W07 - - - - 2 2 - -
Toronto W08 3 $1,276,300 $425,433 $408,000 13 17 100% 38
Toronto W09 3 $1,050,000 $350,000 $340,000 3 1 97% 15
Toronto W10 7 $1,043,000 $149,000 $120,000 17 20 95% 30
Toronto Central 37 $18,154,500 $490,662 $415,000 98 126 97% 38
Toronto C01 11 $4,753,000 $432,091 $415,000 22 29 97% 37
Toronto C02 - - - - 4 8 - -
Toronto C03 - - - - 2 4 - -
Toronto C04 - - - - 5 5 - -
Toronto C06 - - - - 1 3 - -
Toronto C07 3 $1,204,000 $401,333 $406,000 10 10 98% 66
Toronto C08 1 $332,000 $332,000 $332,000 8 12 98% 76
Toronto C09 1 $997,000 $997,000 $997,000 3 2 98% 16
Toronto C10 4 $2,381,900 $595,475 $587,450 6 4 98% 22
Toronto C11 1 $169,000 $169,000 $169,000 1 3 97% 60
Toronto C12 2 $1,699,900 $849,950 $849,950 3 3 95% 26
Toronto C13 3 $1,188,000 $396,000 $408,500 6 6 97% 34
Toronto C14 5 $3,036,700 $607,340 $698,000 11 19 97% 49
Toronto C15 6 $2,393,000 $398,833 $378,250 16 18 96% 27
Toronto East 40 $11,176,712 $279,418 $287,500 62 106 98% 41
Toronto E01 1 $410,500 $410,500 $410,500 5 14 95% 46
Toronto E02 1 $290,000 $290,000 $290,000 1 4 97% 12
Toronto E03 - - - - 1 1 - -
Toronto E04 9 $2,507,800 $278,644 $275,000 13 13 97% 38
Toronto E05 9 $2,822,300 $313,589 $332,000 10 10 98% 45
Toronto E06 - - - - - - - -
Toronto E07 4 $1,250,000 $312,500 $299,000 4 6 102% 28
Toronto E08 2 $322,900 $161,450 $161,450 4 12 90% 38
Toronto E09 3 $650,712 $216,904 $242,000 6 15 96% 44
Toronto E10 2 $478,000 $239,000 $239,000 8 14 98% 53
Toronto E11 9 $2,444,500 $271,611 $261,500 10 17 98% 47
Page 3 July 2010
Market Watch, January 2013 12