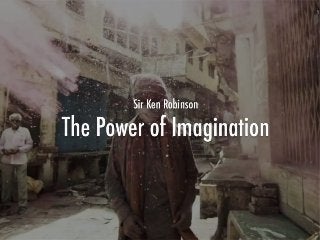
A BOLT Diagram: The Power of Imagination by Sir Ken Robinson

Maximilian Journey created an extraordinary rendering of one of Sir Ken Robinson’s talk on Education: “The Power of Imagination“. (http://www.youtube.com/watch?v=ywtLnd3xOVU&feature=youtu.be) Sir Ken Robinson’s Insight is so crisp and so detailed that I felt creating a BOLT diagram of its content would be a great way to show how BOLT works, how it can be used to help communicate, align insight and ultimately reach the desired outcomes. One of the key originalities of BOLT diagrams is that they capture “states” (a.k.a. outcomes) and the lifecycle that ties them together. This presentation shows brilliantly how simple changes in the endeavor of being educated can make a huge difference into the outcomes for society at large. This 5 min talk delivers a powerful “Call to action” message, which can be represented in a single page diagram. However, that kind of transformation is massive and present its own challenges: limited amount of resources, very large amount of people involved over fragmented periods of time, even the topology is a challenge. All these characteristics are common to most if not all non-profit efforts. This is why it is important to be able to communicate and align everyone’s insight to respond effectively to a call to action and reach the desired outcomes. This is, I believe, what BOLT can deliver.

Recommended
Recommended
More Related Content
Recently uploaded
Recently uploaded (20)
Featured
Featured (20)
A BOLT Diagram: The Power of Imagination by Sir Ken Robinson
- 2. The Power of Imagination • This is one of the most beautiful presentation I have seen, • I’d like to show you how we can use BOLT to communicate Sir Robinson’s Insight and respond to his call to “move”
- 3. You can see the construction of this diagram with the voice over of the talk here.
- 5. Insight • This presentation’s Insight is so crisp, • It’s analysis so fundamental • There are probably few people that would not want to do at least one thing about it
- 6. But ... How do we go about it? • The kind of transformation Sir Robinson is talking about is massive, • It is easy to understand “Why” you want to do something ...
- 7. But, it’s not easy to see what to do or how… • Every transition, every relationship in the BOLT diagram is itself a large and risky endeavor • The only way to successfully deliver his vision on such a massive scale is to start by aligning our insight to be able to federate a vast amount of collective intelligence
- 8. BOLT helps identify What to do... Focus on Outcomes Focus on the path And how you can help guide that path
- 9. BOLT helps identify What to do... (cont’d) Focus on breaking unwanted dependencies Focus on introducing new elements and grow new relationships To reach new outcomes
- 10. When executing on delivering a vision • The problem is that any transition or relationship missing or not working properly can jeopardize the entire effort • This is why aligning our Insight is so critical to cooperate and reach desired outcomes • This is where BOLT can help tremendously
- 11. source: Jeffrey Friedl's Blog This is how we “moved” since the dawn of times...