Calibration workbook
•Download as XLS, PDF•
0 likes•332 views

Automatically shows measurement errors and plots them on a chart.

Recommended
Recommended
More Related Content
Viewers also liked
Viewers also liked (13)
More from ISA Interchange
More from ISA Interchange (20)
Recently uploaded
Recently uploaded (20)
Calibration workbook
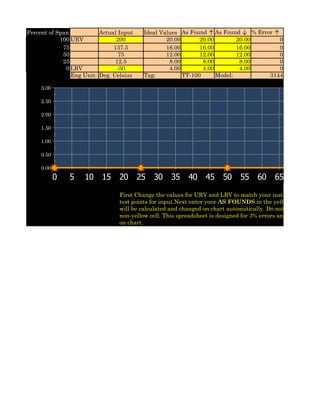
- 1. Percent of Span Actual Input Ideal Values As Found ↑ As Found ↓ % Error ↑ 100 URV 200 20.00 20.00 20.00 0 75 137.5 16.00 16.00 16.00 0 50 75 12.00 12.00 12.00 0 25 12.5 8.00 8.00 8.00 0 0 LRV -50 4.00 4.00 4.00 0 Eng Unit: Deg. Celsius Tag: TT-100 Model: 3144 3.00 2.50 2.00 1.50 1.00 0.50 0.00 0 5 10 15 20 25 30 35 40 45 50 55 60 65 70 75 First Change the values for URV and LRV to match your instrument. This p test points for input.Next enter your AS FOUNDS in the yellow cells. . Full will be calculated and changed on chart automatically. Do not change formu non-yellow cell. This spreadsheet is designed for 3% errors and below to disp on chart.
- 3. % Error ↓ Max FS Error ↑ 0 0 0 Max FS Error ↓ 0 0 0 Max FS Error 0 0 Serial# 78943365 % Error ↑ % Error ↓ 60 65 70 75 80 85 90 95 100 h your instrument. This provides your in the yellow cells. . Full Scale Error lly. Do not change formulas in any errors and below to display properly
- 5. Input Span Ideal Values Found ↑ Found ↓ As As URV 200 20 20.00 20.00 137.5 16 16.00 16.00 75 12 12.00 12.00 12.5 8 8.00 8.00 LRV -50 4 4.00 4.00 20.0 18.0 16.0 14.0 Ideal V 12.0 As Fou As Fou 10.0 8.0 6.0 4.0 -100 -50 0 50 100 150 200
- 6. Measurement Error ↑% Measurement Error ↓% 0.00 0.00 0.00 0.00 0.00 0.00 0.00 0.00 0.00 0.00 Ideal Values As Found ↑ As Found ↓ 50 100 150 200 250