2. 148 L. KOESTLER et al.
in the context of water services, and how it should be interpreted in
terms of successful development aid. Then it will look at the problems
and challenges with the main current indicator of success: access to
water. Lastly, it proposes a new indicator to measure the progress in the
development of water supply services, water-person-years (WPY), and
analyses how the use of this indicator could change the dynamics and
improve the results of development aid in the water sector.
Sustainability of water installations
In order to understand the current situation, it is necessary to look at
the context of water supply projects. Most governments, especially
in Africa, receive significant proportions of their budgets from richer
nations. The money comes either as aid or as grants, and is normal-
ly subject to some sort of conditionality. The flow of finance from
the North to the South has emerged into its own sector with its own
rules. Since there are other values in addition to capitalism and profit
that guide decisions and investments in this sector, it becomes neces-
sary to look at what factors are decisive for decision making. In other
words, what are the goals that the aid business wants to achieve? How
are they measured? On what conditions is the aid allocated?
The overall goal should be to provide water services to a maximum
The overall goal number of people over a maximum period of time. One of the main
should be to key concepts in the aid sector is therefore ‘sustainability’. The term
provide water ‘sustainable development’ was first defined in the Brundtland Report
services to a of 1987 as: meeting the needs of the present without compromising
maximum number the ability of future generations to meet their own needs (Brundtland
1987), and this focus should be kept in mind. If we are to build a
of people over a
‘sustainable’ water supply scheme, we are therefore to put in place
maximum period of infrastructure that can serve today’s generation, but also give the pos-
time sibility for future generations to get water. Assuming the water source
is long lasting, it is, however, clear that all technological installations
and construction materials have their limits. It is impossible to put
in place a technology today that will last for 30 years without main-
tenance, repair and replacement. The challenge therefore lies in how
the technology is maintained.
From experience, in the context of a rural water project in a de-
Technologies
veloping country, the following factors ensure good operation and
will not last for maintenance:
30 years without
• appropriateness of the project;
maintenance and
• technology;
repair • funding;
• motivation;
• knowledge.
April 2010 Waterlines Vol. 29 No. 2
3. INCENTIVES FOR OPERATION AND MAINTENANCE SPENDING 149
It can be seen that technology is only one point on a list that most-
ly consists of factors related to implementation approaches, manage-
ment models and institutional contexts. What becomes clear is that
the environment in which the water infrastructure is embedded is de-
cisive for how it will be maintained in future; hence how sustainable
it will become. The following paragraphs will show how the current
environment generally does not ensure the above-mentioned factors;
on the contrary, it provides incentives to work against them.
The sorry state of water infrastructure today
To start with it is necessary to look at the results on the ground. What
The RWSN
is the state of the water infrastructure that has been constructed in
estimated in 2007 developing countries in the current environment? When moving
that 34 per cent of around in rural areas in sub-Saharan Africa, the frequent sight of an
all handpumps in abandoned handpump is a constant reminder of how maintenance
sub-Saharan Africa systems have failed. The Rural Water Supply Network (RWSN) esti-
are not working mated in 2007 that 34 per cent of all handpumps in sub-Saharan Af-
rica are not working (RWSN, 2007). According to other sources, 90
per cent of the handpumps installed in Africa break down within the
third year of operation (WATSAN Consult, http://www.handpump.
org/afri_pump/index.htm). This number might be high and has not
been confirmed, but it gives an indication of the magnitude of the
problem we are faced with. Recent studies from Asia show a similar
picture: 30 per cent of all new water supplies in some areas of East
Timor break down in the first year of operation (Bond et al., 2009).
Luckily, there are a number of positive examples, too, such as a large
water scheme in western Tanzania where, after some 10 years, around
70 per cent of the water supply systems are still working (NORAD,
2007). However, it is still clear that there is a general weakness in the
current environment and project approach concerning operation and
maintenance. At the same time, these general figures are only rough
estimates, and country figures are dramatically different. It is difficult
to capture the extent to which water infrastructure is not working
Governments for several reasons. First, NGOs and donors are reluctant to report on
often do not have projects that are ‘failures’ and not successes for fear of losing fund-
numbers on non- ing or recognition. Second, governments often do not have numbers
functioning water on non-functioning water systems because of a lack of monitoring
systems and reporting structures, lack of capacity and funding for monitoring
and evaluation, and fear of displeasing donors. For example, when 46
random water points (out of 1,462 registered water points in total)
were visited in the Ugandan district of Kanungu from October 2008
to May 2009, only 40 per cent were functional to the extent that
people could draw water from the point. The official functionality for
Kanungu district, however, is 78 per cent.
Waterlines Vol. 29 No. 2 April 2010
4. 150 L. KOESTLER et al.
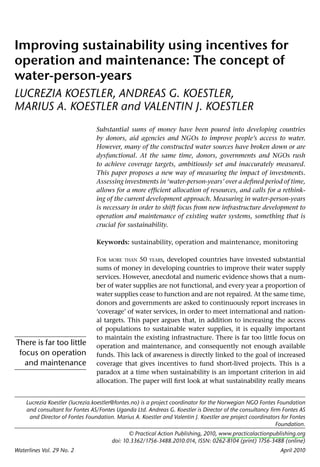
The initial investment is significant compared with the cost of maintaining a handpump. Water well drilling in
western Tanzania in 1995 and an abandoned handpump in Kanungu, Uganda (2008)
A third problem is the criteria and indicators used to measure func-
tionality. According to the sector performance framework in Uganda,
a water point is not functional if it is not working at the time of
spot-check (MWE, 2008). However, in practice government officials
in Uganda only rate a water point as non-functional if the technol-
ogy is beyond repair. This means that if a handpump lacks one spare
part and can be potentially repaired, it still counts as ‘functional’. A
handpump can have been out of order waiting for the spare part for
three weeks, or for three years, and it is still reported as functional.
It is dangerous to
There is no general international consensus on how to measure func-
use functionality tionality, because if a water point is inspected on a spot-check basis,
as a proxy for this does not give any indication of whether the water point will be
sustainability repaired in the near future or not at all. In other words, it is danger-
ous to use functionality as a proxy for sustainability, since the other
elements of sustainability such as motivation to repair the water sup-
ply infrastructure are not taken into account. Any water technology
breaks down once in a while, so a short breakdown does not mean
the water supply is not sustainable. Other indicators used are down-
times, which give a better picture of sustainability because it can in-
dicate how good and effective the maintenance system is. However,
this is time-consuming and costly to measure. In conclusion, official
functionality rates are therefore not very reliable, and the real rates
are likely to be lower.
The myth of the self-sustaining community
One of the explanations for the low rates of functional water systems
can be found in the management approach that dominates water
projects in the developing world: community management. The ap-
proach was first introduced in the 1980s as a response to the failure of
April 2010 Waterlines Vol. 29 No. 2
5. INCENTIVES FOR OPERATION AND MAINTENANCE SPENDING 151
local governments to provide effective services. It quickly became an
attractive approach for donors, because it puts the receiving commu-
nity in focus, is based on cost recovery and aims to make projects self-
sustaining. The approach has many merits and, if implemented well,
it can have positive outcomes. However, in one area the approach
normally fails: in producing enough funds for long-term operation
Full cost recovery and maintenance of water supplies. Cost recovery means in practice
in water supply that the water-users pay for operation and maintenance (and some-
services is extremely times also capital) costs through water tariffs or other arrangements.
hard to achieve However, full cost recovery in water supply services is extremely hard
to achieve. Even utilities that serve large populations and benefit from
economies of scale can struggle to recover their costs. Water services
have the characteristic that they require high spending on construc-
tion and maintenance of large infrastructure, but at the same time
water is a social good and governments put in place laws and tariff
caps in order to ensure basic services for all. Even if many private
companies successfully provide urban water supplies, they often ben-
efit from some kind of subsidy or economies of scale. In rural settings
in developing countries, neither of these is available. In addition,
poor communications and road networks make inputs such as power,
chemicals and spares more expensive and the purchasing power of
rural populations is low. All this makes it doubtful that a rural village
can recover all costs for long-term operation and maintenance from
water sales, not to speak of recovering the capital investment.
In addition to funding for operation and maintenance, commu-
nity management relies on community members in order to manage
and maintain the water point in future. This requires knowledge
and motivation. It was thought that with enough initial training
in management and technical maintenance, the community would
It is now accepted start a learning process and through experience it would be fully ca-
that communities pable of maintaining the water system in future. For the last decade,
are not able to scholars and practitioners have increasingly recognized the need
manage their for a support mechanism. It is now accepted among scholars and
practitioners that communities are not able to manage their water
water supplies
supplies independently, but that they need a 20 per cent support to
independently their 80 per cent contribution (Carter, 2002). This means that the
community needs support both in terms of continuous training and
follow up, and through financial means. This is because a commu-
nity will only take full ownership of a technology as long as it feels it
has the knowledge and capacity to do so. As many developing coun-
tries are going through decentralization processes, the most natural
entity to take on this responsibility of support is local government.
However, in many countries financial authority has not yet been
transferred to the lower administrative levels, and there is a general
lack of capacity and resources in local government structures. Some
Waterlines Vol. 29 No. 2 April 2010
6. 152 L. KOESTLER et al.
countries such as Uganda experiment with institutional support
mechanisms that support communities independently of local gov-
ernment through ‘umbrella’ organizations (Koestler, 2008). How-
ever, the approach still needs improvement before it can be scaled
up. Other solutions, such as contracting long-term maintenance out
Most communities to the private sector, are also being tried out in some countries, but
in developing only in isolated cases (Harvey and Reed, 2004). In practice, there
countries are still is therefore merely a theoretical awareness of the need for back-up
left alone after the support, and few initiatives are tested on the ground. Consequently,
project period is most communities in developing countries are still left alone after
the project period is over, something that translates into a high rate
over
of non-functional water supplies.
Both the lack of focus on operation and maintenance and the
implementation of a management system that does not ensure sus-
tainability can be traced back to the general context of aid spending
and hence the targets and objectives that matter in development aid
for water. There is a general reluctance to accept the real meaning of
sustainability and make sure interventions and projects are designed
for longer periods of time. Community management is not a wrong
approach per se, but has shown limited results as it is currently imple-
Only long-term mented with a short intervention and no long-term support. Why
involvement have donors, NGOs and governments not learned, after all these
brings us closer to years, that only long-term involvement brings us closer to the devel-
sustainable water opment goal: to supply more people with water over a longer period
of time? One of the reasons for this is the excessive focus on coverage
supplies
as an indicator for progress.
Measuring coverage
Coverage is normally expressed as the percentage of a population that
has access to sustainable and safe water supply. Although there are
other indicators used to measure the output of development inter-
ventions such as the ‘sustainability snapshot’ and the ‘equity distri-
bution indicator’ (Sugden, 2003), coverage is by far the most common
and the one used for the Millennium Development Goals (MDGs).
Based on the MDGs, countries have formulated their own targets, and
the most common indicator used is coverage. The indicator is useful
and should be considered; however, there are several problems related
to it.
First, the indicator has no time aspect. This means that it only
gives a ‘snapshot’ of reality at a certain time. When data is collected
periodically, comparisons can be made and trends identified. How-
ever, what does ‘coverage’ say about the service level in a country?
Coverage is affected by many factors, especially population growth.
In countries such as Uganda, where population growth is extremely
April 2010 Waterlines Vol. 29 No. 2
7. INCENTIVES FOR OPERATION AND MAINTENANCE SPENDING 153
high (2.692 per cent) (CIA World Factbook, https://www.cia.gov/li-
brary/publications/the-world-factbook/), developments in infrastruc-
ture are struggling to follow the pace of population growth. This
means that the coverage figure can drop from one year to another,
not because there are fewer water supply schemes, but because the
population has increased. In addition, it does not take into account
how sustainable the water supplies are.
Second, there is no simple way to calculate and collect coverage
There is no simple
data, and countries use a number of different methods. In Mali, they
way to calculate currently use two different methods to calculate coverage and dif-
and collect ferences are large; for rural water supplies the general method gave
coverage data a coverage figure of 69.9 per cent whereas the detailed method gave
only 60.1 per cent (DNH, 2008). In Uganda, WaterAid found that the
number of people actually having access to clean, safe water is prob-
In Uganda, the ably grossly overestimated, because of the crude methods for estimat-
number with access ing the number of people using each water point. The method used
to clean water is in Uganda assumes that 300 people use a handpump, and that peo-
probably grossly ple within a radius of 1.5 km have ‘easy access’ to this water supply.
overestimated However, this is unlikely in reality since many communities in rural
areas are small and dispersed, and 1.5 km is a considerable distance
to carry water (Sinclair, 2004). If these official numbers were applied
in Kanungu district (western Uganda), for example, the coverage rate
would be 150 per cent. In order to avoid this, the government caps
the numbers so that they do not exceed the total population of a
given sub-county, a method that again gives skewed results. In addi-
tion, the method of calculation in Uganda assumes a functionality
rate of 80 per cent and, as mentioned before, this is unlikely to be the
case (Sinclair, 2004).
Third, the data used to calculate coverage at a national level is often
As for functionality,
wrong. A study carried out in Wakiso and Tororo districts in Uganda
there is a general in 2004 by WaterAid showed that the districts had about twice as
lack of reporting, many water points as was captured in the national water database
monitoring (Kanyesigye et al., 2004). As for functionality, there is a general lack of
and evaluation reporting, monitoring and evaluation procedures that ensure a flow
procedures of information from the lowest administrative levels to the national
level. If calculation methods or updating procedures are adjusted,
there is always a danger that the new coverage figure will be lower
than the current one, and since increase in coverage is an important
indicator used to measure performance, this can affect funding to the
district or the national government in future. Therefore, there are
often conflicts between district and national governments; national
governments accuse the districts of quoting lower figures of coverage
in order to get more funding. After such a conflict, Kanungu district
chose to do its own calculation and survey of water points using ques-
tionnaires distributed to local leaders. This gave a figure of 67 per cent
Waterlines Vol. 29 No. 2 April 2010
8. 154 L. KOESTLER et al.
coverage instead of the 91 per cent quoted by the government (MWE,
2008). Other monitoring mechanisms such as the Joint Monitoring
Programme are not based on government figures but on household
surveys. This shows that there is a lack of coordination and also a
political connotation to the coverage figures that makes it difficult to
know which number is closest to the situation on the ground.
Wrong incentives – wrong priorities
In addition to the unsystematic calculation methods and the lack of
The focus has been
adequate data, the use of coverage as a development indicator in the
on building new first place is problematic. When local and national governments are
infrastructure to continuously asked to report on increased coverage, focus is on build-
cover as many new ing new infrastructure in order to cover as many new people as pos-
people as possible sible each year. An example from Uganda shows what this means in
each year practice. In Uganda, donors and the government have implemented
a sector-wide approach (SWAp). Donors contribute to a basket fund,
and this money is channelled through government to the districts in
the form of a ‘conditional grant’. The districts have to follow strict
guidelines to spend the conditional grant and only 8 per cent of it
is earmarked ‘rehabilitation’. Of the remainder, 72 per cent is for the
construction of new water supplies, and the rest is for community
activities, monitoring and evaluation (MWE, 2000). This shows how
the government is investing heavily in new water supply systems in
order to reach its coverage targets. The performance of the district in
NGOs wanting the previous year and the coverage is also used in order to allocate the
conditional grants for next year. This means that a district with a high
to give a water
coverage will receive less money the following year because the gov-
supply system ernment wants to prioritize districts with low coverage. In practice a
should realize that district with high coverage will have even less money for operation
the project puts and maintenance, despite the fact that it has more water supply infra-
an extra financial structure to maintain. Each NGO or donor that wants to ‘give’ a water
burden on the supply system to a district government should realize that the project
puts an extra financial burden on the district for operation and main-
district for O&M
tenance, and the financial means for this are extremely limited.
As a consequence, governments cannot be counted on financially
for operation and maintenance. NGOs and local governments also
tend to assume that sufficient revenue will be generated locally from
within the community, something that has proved to be difficult
in practice. It is therefore not surprising that such a high number
of water supply structures in the developing world are out of order;
there is simply no money to pay for operation and maintenance. No
technology is completely maintenance free and, even if well main-
tained, every technology or infrastructure will require replacement
April 2010 Waterlines Vol. 29 No. 2
9. INCENTIVES FOR OPERATION AND MAINTENANCE SPENDING 155
of certain parts after some time. Non-functional systems are often
blamed on a weak enabling environment, wrong technology, wrong
management model, lack of local ownership, bad implementation or
If people had absence of supply chains. However, if there was money allocated for
enough money to operation and maintenance, all these obstacles could be overcome. If
buy spares, supply there was a flow of money from governments, donors and communi-
chains would be ties for operation and maintenance, institutions to take care of this
would emerge. If people had enough money to buy spares, supply
created
chains would be created (Oyo, 2002). During a recent study looking
at management models for rural water supplies in Uganda, the con-
clusion was that no type of management model or support mecha-
nism worked if there was no money for operation and maintenance
(Koestler, 2008).
A bad investment
Why is it so hard to convince donors that money for operation and
maintenance is important? This question becomes even more surpris-
ing when the economic arguments are taken into account. Driven by
the wish to increase coverage figures, donors have invested in an ut-
terly inefficient way. This is shown in Figure 1, where the thin curves
represent individual projects and the thick curve is the cumulative
number of people with access to water. It is clear that as long as the
individual projects break down after a few years, the overall goal is
never achieved. At the same time, the investment spent on water in-
It is much cheaper frastructure is significant. The fact that populations continue to have
to maintain systems access to water should therefore be valued as much as the fact that
for a given number new populations gain access to water. In economic terms, it is much
of people than to cheaper to maintain systems for a given number of people than to
construct new ones, but the same objective is achieved; people have
construct new ones
access to safe water.
This can easily be demonstrated through an example looking at
the cost of installing and maintaining a borehole with a handpump.
The cost of a new borehole with a handpump in sub-Saharan Africa is
between US$5,000 and $15,000. Using the average, for an investment
of $10,000, 300 people get access to safe water, using the Ugandan
standard figure. According to research done by the French handpump
provider Vergnet Hydro in West-Africa, about $35 is needed on aver-
age per year in order to maintain a handpump (Ndingambaye, 2008).
Using this figure of $35 per year, it means that with $10,000, about
280 handpumps could be maintained in a year. This gives us 280 ×
300 = 84,000 people. In other words, instead of 300 people gaining
access, 84,000 people continue to have access to water in that particu-
lar year, for the same price.
Waterlines Vol. 29 No. 2 April 2010
10. 156 L. KOESTLER et al.
Figure 1. Persons with access to water over time using a short-term approach
focusing on new infrastructure
This effect is multiplied if the access is maintained over time. Being
The coverage
a static indicator, the coverage indicator does not take into account
indicator does not the number of people that will get water every year in future from
take into account the new water system, if it is kept functional. It is therefore necessary
the number of to add a time aspect to the coverage figure when allocating funds,
people that will get and we call the indicator ‘water-person-years’ (WPY) (Koestler et al.,
water every year in 2009). This indicator tells us how many people get access to water
from year one and each year throughout the lifetime of the infrastruc-
future
ture, and makes it possible to express the impact of an investment in
a cumulative way, over a period of time.
Thinking in water-person-years
The easiest way to explain this concept is to look at a simple example:
an organization has in total 300 units of money to spend on water
supply, and the investment cost of each supply is 100 units for a vil-
lage of 1,000 people. To simplify, the 100 units include both hardware
and software costs, where the relative distribution will depend on lo-
cal settings. For this example, we also assume a constant population
and that money today has the same value tomorrow. According to
April 2010 Waterlines Vol. 29 No. 2
11. INCENTIVES FOR OPERATION AND MAINTENANCE SPENDING 157
the approach used today, the main goal of the implementing orga-
nization will be a quick increase in coverage. It will therefore con-
struct three water systems for 100 units each in three villages of 1,000
people each. The total cost is 300 units. However, without any mon-
ey reserved for follow up, operation and maintenance, each water
system can be assumed to break down after about 3 years. The total
water-person-years this investment gives is therefore:
3 villages × 1,000 people × 3 years = 9,000 WPY
If the organization instead focused on one village and constructed
one water system for 100 units, and set aside 10 per cent of the invest-
ment cost (10 units) for operation and maintenance each year for the
next 20 years, the result looks like this:
1 village × 1,000 people × 20 years = 20,000 WPY
The example shows that the impact of the investment is more than
Thinking in water- doubled (20,000 WPY instead of 9,000 WPY) if enough money is al-
person-years, a located for operation and maintenance. Thinking in water-person-
maintained system years, a water system maintained should be even more valuable than
should be even a new system constructed. This is because for each additional year that
more valuable than the infrastructure lasts, the capital cost per delivered WPY diminishes,
hence increasing the effectiveness of the initial investment. In addi-
a new system
tion, if the system is properly designed, it will serve even more people
in future due to population growth. Figure 2 shows how a consider-
ably higher access figure is achieved over time if projects are made
sustainable and funding is allocated to operation and maintenance.
It also shows how the resources spent on water projects stand in rela-
tion to the outcome; the people with access to water over time.
What are the implications of the calculations above? The goal of
donors and governments should be to supply as many people as
possible with water over time with a certain amount of money. This
means simply making a good investment and allocating resources in
Donors should an efficient way. According to the result of the small exercise above,
allow for operation donors should, therefore, value the fact that a water system has been
and maintenance, maintained and run for an additional year as much as the construc-
even if this is less tion of a new system. Donors and governments should allow for
prestigious than money spent on operation and maintenance, even if this is less pres-
tigious than commissioning new infrastructure projects and requires
new projects
long-term thinking and commitment. In economic terms, therefore,
focus should shift from only new people supplied to people supplied
in general, regardless of whether it is from a new or an existing in-
frastructure. It is only by allocating resources in this way that they
will have the highest potential impact and the projects will be truly
sustainable.
Waterlines Vol. 29 No. 2 April 2010
12. 158 L. KOESTLER et al.
Figure 2. Persons with access to water over time using a long-term approach
focusing on operation and maintenance
The WPY concept in practice
Introducing WPY as an indicator for development projects would
Introducing this
have profound impacts on the way development work is carried out
indicator would in the water sector. It would most certainly bring countries closer to
have profound their development objective: more people have access to sustainable
impacts on the way water supply services. It would also have implications on how NGOs,
work is carried out donors, governments and the private sector would work.
in the water sector For NGOs, thinking in WPY means that it is necessary to make a
long-term commitment for each water project. This stands in sharp
contrast to common practice today, where NGOs use project cycles of
1–3 years, maximum five years, and there is a clear focus on new infra-
structure. It would make it much harder for an NGO to start a project
in an area, because it would mean a presence in that area for a long
period of time. Hence the ‘entry barrier’ for an NGO to start activities
in a certain area would be high. Once the NGO is present, it will be
incentivized to carry out more projects in the same area in order to
benefit from economies of scale. This would lead to fewer NGOs in
each area, but NGOs that are specialized in the local context because
April 2010 Waterlines Vol. 29 No. 2
13. INCENTIVES FOR OPERATION AND MAINTENANCE SPENDING 159
of the experience gathered over time. For NGOs this would represent
a number of challenges, especially the fact that a long-term commit-
ment is necessary. For the beneficiaries, it would mean better and
more appropriate projects because of the specialization of the NGO; it
would mean fewer NGOs and organizations to relate to and there are
many potential benefits of ‘clustering’ NGOs such as shared experi-
ences, better coordination in one area and easier relations with local
government. It also makes scaling up easier, because projects are more
easily replicated in the same geographical area. In certain ways, we are
already moving slowly in this direction through the involvement of
community-based organizations (CBOs) or grassroots organizations
that are considered more ‘permanent’ than international NGOs, and
are increasingly used as partner organizations that carry out the work
in the field. However, even if the CBO is more permanent, without
funding the long-term impact of the CBO is also limited.
For donors, thinking in WPY would mean longer commitments of
For donors,
funding. Currently, donors often decide one year at a time how much
thinking in WPY they are giving, depending on national budgets, the global economic
would mean longer climate and politics. When NGOs are funded through donors, they
commitments of also need to work on limited project periods. For example, the Nor-
funding wegian Agency for Development (NORAD) allocates money for some
NGOs only on a yearly basis. Projects are normally funded over three
years, five years maximum. The application process also clearly de-
mands an ‘exit strategy’. Based on the experiences from communi-
ties and water supplies discussed above, an exit strategy after a three
year project will in many cases lead to a swift breakdown of the wa-
ter supply. The initial reaction of donors is often to reject long-term
commitment. At the same time, when looking back in time, most
international donors have been present in developing countries over
The SWAp is a long period of time. NORAD has been active in Mozambique since
actually a step in 1977 (www.norad.no). The French Agency for Development (AFD)
the direction of started its activities in Benin even before independence, in 1956
commitments for (www.afd.fr). In addition, donors are increasingly coordinating their
longer periods of support and making it more predictable for national governments
through sector coordination programmes and the progress towards
time
SWAps. The SWAp is actually a step in the direction of commitments
for longer periods of time, since it gives government a leadership
role and aligns donors around targets and strategic plans. Even if do-
nors change their contributions from year to year, it puts in place
a favourable environment for long-term thinking. A second trend
that is also favourable to a long-term perspective is the move from a
project approach to a programme approach. This has been a funda-
mental theme in many sector coordination processes, and is widely
recommended by literature. These examples show that there is a gen-
eral understanding about the need for long-term commitments and
Waterlines Vol. 29 No. 2 April 2010
14. 160 L. KOESTLER et al.
solutions, however the process is too slow and too many water systems
will break down before the communities will feel the difference.
For national governments, thinking in WPY would dramatically
change policies, strategies, sector documents and programmes, and
sector finance. It would require a review of funding mechanisms such
as the conditional grants in Uganda, and it would set new priorities
and identify new focus areas of intervention. Eventually, it would
have a profound impact on the access of populations to sustainable
water supply, over time. However, the impact on the ground would
largely depend on funding, and the fact that donors embrace the
same objectives and strategies.
For the private sector, increased spending on operation and main-
tenance will mean a new business opportunity. Funds from donors,
NGOs and local governments can be used to support communities
directly; however several countries are already experimenting with
using the private sector for operation and maintenance services. In
Madagascar, handpump suppliers are paid by NGOs and local gov-
ernment not only to supply and install the pump, but also to keep
a certain number of pumps in an area running and functional over
Using the private a certain period of time. In Angola, a water company is responsible
sector can be for several hundred handpumps in an area. A local operator collects
more efficient money from the community and does routine maintenance, and the
than providing company provides maintenance services for larger repairs (Harvey
services through and Reed, 2004). Using the private sector can be more efficient than
providing services through local government structure since the pri-
local government
vate sector is often more flexible and able to adapt quickly to user
structures demands. Such initiatives can be expanded and as long as there is a
demand and money to pay for a service, the private sector can easily
be mobilized to take on a new role.
Conclusion
In conclusion, WPY is a powerful tool that can be used by govern-
ments, donors and NGOs to justify long-term funding and higher
budget allocations for operation and maintenance. The indicator
should be used alongside existing indicators such as coverage and
functionality. It is clear that the indicator needs some adaptation to
reality, such as taking into account population growth and the value
of money spent today versus its future value. The indicator will also
suffer the same weaknesses as functionality and coverage if data col-
lection methods and updating of databases are not improved. In addi-
tion, it is clear that corruption, dysfunctional government structures,
lack of human resources and slow decentralization processes are chal-
lenges that cannot be overcome just with more funding for operation
April 2010 Waterlines Vol. 29 No. 2
15. INCENTIVES FOR OPERATION AND MAINTENANCE SPENDING 161
and maintenance. However, it is hoped that through increased focus
on real sustainability, adequate systems, structures and institutions
can come into existence. These could be semi-autonomous mainte-
nance units or private companies working on service contracts, it
could be the local water utility being paid for maintaining the rural
water supplies in the area, or a local community group contracted to
carry out maintenance of a number of handpumps. The solutions are
many, what is needed is for the donor community, the NGOs and the
governments to be given the right incentives to allocate resources in
a more sustainable way, and one way to do this is to use water-person-
years as an indicator.
References
Bond, M., Biscoe, P.T. and Whalen, M. (2009) Human Resource Capacity in the
Water, Sanitation and Hygiene Sector in East Timor (Draft), DFID, London.
Brundtland, G. (ed.) (1987) Our Common Future: The World Commission on Envi-
ronment and Development, Oxford University Press, Oxford, UK.
Carter, R. (2002) ‘Beyond the community’, contribution to Beyond the Commu-
nity E-conference on Scaling up Community Management of Water Supply [online],
available from: http://www.jiscmail.ac.uk/lists/WSSCMANP.html [accessed 4
November 2009].
DNH (Direction Nationale de l’Hydraulique) (2008) Rapport d’Activités de la
Direction Nationale de l’Hydraulique au Titre de l’Annee 2008, Direction Natio-
nale de l’Hydraulique, Mali.
Harvey, P. and Reed, B. (2004) Rural Water Supply in Africa: Building Blocks for
Handpump Sustainability, WEDC, Loughborough University, UK.
Kanyesigye, J., Anguria, J., Niwagaba, E. and Williamson, T. (2004) Are National
Water and Sanitation Objectives Reached on the Ground? A Review of Service Deliv-
ery, Planning Monitoring and Evaluation in Tororo and Wakiso Districts, Discussion
Paper, WaterAid Uganda.
Koestler, A.G., Koestler, M.A. and Koestler, L. (2009) ‘Coverage as a misleading
development goal: The concept of water-person-years’, Water, sanitation and
hygiene: Sustainable development and multisectoral approaches, 34th WEDC Inter-
national Conference, Addis Ababa, Ethiopia.
Koestler, L. (2008) Private Sector Involvement in Rural Water Supply: Case Studies
from Uganda, Msc Project, WEDC, Loughborough University, UK.
Ministry of Water and Environment (MWE) (2000) Rural Water and Sanitation
Implementation Strategy and Investment Plan, Ministry of Water and Environ-
ment, Government of Uganda, Uganda.
MWE (2008) Water and Sanitation Sector Performance Report 2008, Ministry of
Water and Environment, Government of Uganda, Uganda.
Ndingambaye, P. (2008) Enquiry Report on the Operating Costs of the Vergnet
Hydraulic Pumps in Chad, Ministry of the Environment, Water and Halieutical
Resources, Chad.
Waterlines Vol. 29 No. 2 April 2010
16. 162 L. KOESTLER et al.
NORAD (2007) Fiction, Facts and Future: Executive Summary of Report on Norad’s
Assistance to Water Supply and Sanitation Development in Tanzania and Kenya
during the 70’s, 80’s and 90’s, prepared by Tranor Int. Ltd for NORAD, Oslo,
Norway.
Oyo, A. (2002) Creating Successful Private Sector Supply Chains: A Resource Guide
for Rural Water Supply and Sanitation Practitioners, Water and Sanitation Pro-
gram, Washington, DC.
RWSN (2007) Handpump Data: Selected Countries in Sub-Saharan Africa [online],
Rural Water Supply Network, St Gallen, Switzerland, available from: www.
rwsn.ch [accessed 5 November 2009].
Sinclair, P. (2004) Scaling-up Rural Water Supply Coverage in Uganda: Can The
Ambitious Targets Be Achieved? IRC International Water and Sanitation Centre,
The Netherlands.
Sugden, S. (2003) Indicators for the Water Sector: Examples from Malawi, Field-
work Report, WaterAid, London.
April 2010 Waterlines Vol. 29 No. 2