

Empfohlen
Weitere ähnliche Inhalte
Andere mochten auch
Andere mochten auch (20)
Ähnlich wie Nike corporation
Ähnlich wie Nike corporation (20)
Mehr von Nazish Sohail LION
Mehr von Nazish Sohail LION (16)
Kürzlich hochgeladen
Kürzlich hochgeladen (20)
Nike corporation
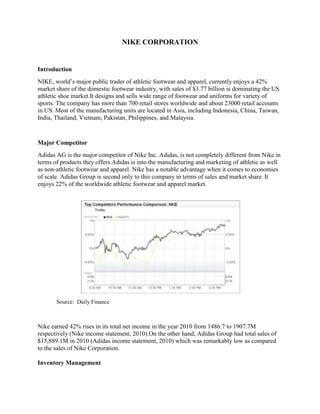
- 1. NIKE CORPORATION Introduction NIKE, world’s major public trader of athletic footwear and apparel, currently enjoys a 42% market share of the domestic footwear industry, with sales of $3.77 billion is dominating the US athletic shoe market.It designs and sells wide range of footwear and uniforms for variety of sports. The company has more than 700 retail stores worldwide and about 23000 retail accounts in US. Most of the manufacturing units are located in Asia, including Indonesia, China, Taiwan, India, Thailand, Vietnam, Pakistan, Philippines, and Malaysia. Major Competitor Adidas AG is the major competitor of Nike Inc. Adidas, is not completely different from Nike in terms of products they offers.Adidas is into the manufacturing and marketing of athletic as well as non-athletic footwear and apparel. Nike has a notable advantage when it comes to economies of scale. Adidas Group is second only to this company in terms of sales and market share. It enjoys 22% of the worldwide athletic footwear and apparel market. Source: Daily Finance Nike earned 42% rises in its total net income in the year 2010 from 1486.7 to 1907.7M respectively (Nike income statement, 2010).On the other hand, Adidas Group had total sales of $15,889.1M in 2010 (Adidas income statement, 2010) which was remarkably low as compared to the sales of Nike Corporation. Inventory Management
- 2. Nike’s inventory turnover ratio is 4.4 (Nike Inc,NYSE:NKE)which exceeds the industry average of 4.34 (Weygandt, 1996). A slight Reduction in the inventory level is required. Inventory turnover management will benefit Nike greater cash flows, reduced storage costs and less product spoilage. It can also reduce Nike’s inventory of out-of fashion shoes and clothing. Nike employed MRP software helps the store managers to keep the track of the materials to be purchased through an online exchange result in significant cost and time saving to the company (Shah, 2009). Demand Forecasting Nike’s global operations were divided into 5 geographical regions which made the Supply Chain practices at Nike highly inadequate. Nike implemented the Supply Chain Software to forecast the demands. Its main purpose was to match the supplies with demand. But the company announced fall in company profits in the third quarter of fiscal year 2001 blaming entirely the supply chain software implemented in June 2000. The system of demand management was a collective effort of over hundreds of information specialists within the company. It was designed to run the future program of Nike introduced by Nike in 1970’s to manage the inventory more efficiently. The system managed the retail partners of Nike who placed the orders six month prior to the delivery date. Trying to forecast too far out ahead, was the major reason of this system’s failure, followed by inadequate information and centralized processes. The software company reengineered the existing processes at Nike and by the end of 2003 the processes made considerable progress. Nike shifted its focus to SAP and ERP system which depends on order and invoices than. Current system at Nike closely monitors the movement of goods from raw materials to the finished products. Nike converted its supply chain processes from make –to-sell to make-to-order that resulted in the record sales in 2005. Logistics Logistics at Nike is of multiplex nature which involves three product lines; footwear, apparel and equipment that are managed via four company’s logistics service providers’ network within four regions. This setup is a collaborative process between the regions and Nike’s logistic group. APL Logistics and Maersk Logistics are responsible for all the processes ranging from handling to unloading of cargo and the collection of documents.Nike controls its logistics in- house rather than outsourcing to the third party.Large volume of cargo is shipped directly to the customers than to Nike facilities in US region, making Nike in constant contact with customers regarding dates and freight movement.
- 3. References Adidas: Income statement (2010). Retrieved on May 20, 2011 from http://www.hoovers.com/company/adidas_AG/stjyti-1-1njea5.html Dogiamis, G. &Vijayashanker, N. (2009) Adidas: Sprinting Ahead of Nike, Retrieved on May 20, 2011 from http://www.mcafee.cc/Classes/BEM106/Papers/2009/Adidas.pdf Dunsen V. S. (1998). The Manufacturing Practices of the Footwear Industry: Nike vs. the Competition, UNC - Chapel Hill, INTS 092 Dw Staff, (2006).EU Approves Adidas-Reebok Merger Retried on May 20, 2011 from http://www.dw-world.de/dw/article/0,,1870303,00.html Harps, H. L., (2004). Nike maintains control, inbound logistics, Retrieved on May 25, 2011 from http://www.inboundlogistics.com/articles/features/0704_feature01.shtml Holmes, S. (2006). Adidas’ World Cup Shutout: U.S. Fans of Soccer’s Big Event Will See Only Adidas Ads on Television. Nike’s Response: A MySpace-style Site for Soccer Nuts. Business Week, pp. 106-107 Karnitschnig, Matthew & Kang.(2005, August). Leap Forward: For Adidas, Reebok Deal Capps Push to Broaden Urban Appeal; Known for Its Engineering, German Company takes on Nike in Lifestyle Market; Teaming Up with Missy Elliot. Wall Street Journal, p. A1 Konicki, S. (2001). Lower Profit At Nike Blamed On i2 Software, Information Week. Retrieved on May 25, 2011 from http://www.informationweek.com/news/6505024 Nike (NKE) stock quote, Retrieved on May 20, 2011 from http://www.wikinvest.com/wiki/Nike_%28NKE%29 Nike Stock Performance, Daily Finance Retrieved on May 20, 2011 from http://www.dailyfinance.com/company/nike-inc/nke/nys/top-competitors Nike: Income statement (2010). Retrieved on May 20, 2011 from http://www.hoovers.com/company/NIKE_Inc/rcthci-1-1njea5.html Nike Inc,NYSE:NKE| ratios and returns, www.Forbes.com. Retrieved on May 20, 2011 from http://finapps.forbes.com/finapps/jsp/finance/compinfo/Ratios.jsp?tkr=NKE Shah, J. (2009, May). Supply Chain Management: Text and Cases, Prentice Hall Weygandt, J. J., Kieso, D. E., &Kell, W. G. (1996). Accounting Principles (4th ed.). New York, Chichester, Brisbane, Toronto, Singapore: John Wiley & Sons, Inc.