SlideShare ist ein Scribd-Unternehmen logo
1 von 6
SUMMARY OF STATEMENT OF PROFIT AND LOSS, AS RESTATED

                                                                                                                 (Rs. in million)
                          Quarter         Quarter         Year            Year            Year            Year           Year
                          ended      ended      ended      ended      ended      ended      ended
                          30.06.2009 30.06.2008 31.03.2009 31.03.2008 31.03.2007 31.03.2006 31.03.2005
INCOME
Sales                         19,020.73       23,126.63       71,397.19       59,653.05       52,850.89    54,705.79       38,415.38
Income from
Transportation                   297.58          251.62        1,017.30        1,166.43        1,041.16       796.07           742.99
Other Income                   2,063.15        1,556.04        9,371.75        6,770.01        5,334.94     3,639.29         1,904.26
Other adjustments         -                     -461.35         -407.47          365.15          872.90     1,110.72           117.71
Total Income                  21,381.46       24,472.93       81,378.77       67,954.63       60,099.89    60,251.87       41,180.35
EXPENDITURE
Increase/(Decrease)
In Stock                        -146.07          -10.25         130.01          -220.57          22.12       -113.70            -69.09
Production,
Transportation & Other
Expenditure                    9,717.27       10,399.39       39,612.49       35,648.89       30,439.30    27,048.70       21,100.61
Provision against
debts, advances and
other provisions/write-
offs                            178.44          277.90         3,711.98        1,334.07        1,927.05     1,121.73           676.77
Depletion                       527.63          578.75         2,087.64        2,174.80        1,776.52     1,881.23         1,733.86
Depreciation                    511.47          205.72         1,680.79          918.60          818.34     1,432.38           561.61
Interest & Debt
Charges                            9.02          14.23           87.44          343.64          139.55       161.87            166.51
Exchange
Loss/(Gain)                      -60.83          -49.30          -61.51          39.21           11.24           -9.72              -0.62
VRS
Compensation written
off                       -               -               -               -               -                  299.62                 99.87
Other Adjustments         -                      633.38          213.93          570.65           84.94     1,701.95          607.15
Total Expenditure             10,736.94       12,049.81       47,462.77       40,809.29       35,219.06    33,524.05       24,876.68
Profit for the
period / year                 10,644.52       12,423.12       33,916.00       27,145.34       24,880.83    26,727.82       16,303.66
Prior Period items        -               -                      46.30           11.32           -54.56          16.16          -72.23
Profit Before Tax             10,644.52       12,423.12       33,869.70       27,134.02       24,826.27    26,743.98       16,231.44
Provision for
Taxation:
- Current Tax
(Including Wealth Tax)         3,157.60        4,345.84       11,848.43        8,510.26        7,380.30     9,249.59         5,454.79
- Tax for earlier
years                     -               -               -                       2.63             0.93       66.24                 85.21
- Deferred Tax                   90.00          125.84          343.07          706.83         1,020.18      497.85                 74.60
- Fringe Benefit
Tax                       -                      19.25           61.36           25.00           25.00           31.00
3,247.60         4,490.93       12,252.86        9,244.71        8,426.41         9,844.67    5,614.60
Profit After Tax as per
audited statement of
accounts                                     7,396.92         7,932.19       21,616.84       17,889.31       16,399.86        16,899.31   10,616.84
Adjustments on
account of :
a) Changes in
Accounting Policies                      -                -              -               -               -                     2,060.73      51.27
b) Other Adjustments
and Prior Period Items                   -                    1,094.73         943.51          -150.28       -1,478.06        -1,192.94     608.30
c) Current Tax Impact
on Adjustments                           -                    (248.14)         -251.85           67.50         468.21           443.97      -316.94
d) Deferred Tax                                                                                 -10.56          13.90           159.84      -151.02
Impact on Adjustments                    -                -              -
Total of Adjustments
after tax impact                         -                -                    691.66           -93.34         -995.95         1,471.60     191.61
Profit after Tax as
Restated                                 -                     846.59        22,308.50       17,795.97       15,403.91        18,370.91   10,808.45
BALANCE
AVAILABLE FOR
APPROPRIATION, AS
RESTATED                                     7,396.92         8,778.78       22,308.50       17,795.97       15,403.91        18,370.91   10,808.45
APPROPRIATIONS:
Interim Dividends                        -                -                   3,210.07        2,675.06        3,959.08         3,959.08    1,284.03
Tax on Interim
Dividends                                -                -                    545.55          454.63          555.26           555.26      172.19
Final Dividend
(Proposed)                               -                -                   3,317.01        3,210.07        1,605.03         1,712.04    2,140.04
Tax on Proposed
Dividend                                 -                -                    563.73          545.55          272.78           240.11      300.14
Transfer to General
Reserve                                  -                -                  14,672.14       10,910.68        9,011.76        11,904.42    6,912.05
Balance of Profit
and Loss Account                             7,396.92         8,778.78 -        -         -         -
TOTAL                                        7,396.92         8,778.78 22,308.50 17,795.97 15,403.91 18,370.91                            10,808.45

Notes :
1. The above statement should be read with the Notes on Adjustments made for Restated Financial Statements (Annexure IVA),
Notes on Adjustments not made for Restated Financial Statements (Annexure IVB), Auditors' qualifications and treatment in
Restated Financial information (Annexure IV C), Significant Accounting Policies (Annexure V A) and Other Notes on Restated
Financial Statements (Annexure V B).
2. The reconciliation between the Audited and Restated accumulated Profit and Loss balance is given in Notes on Adjustments
made for Restated Financial Statements (Annexure IV A.)


3. Negative figures have been shown in brackets.


http://www.investingmantra.com
SUMMARY OF STATEMENT OF ASSETS AND LIABILITIES, AS RESTATED

                                                                                                        (Rs. in million)
                    As at            As at            As at            As at         As at         As at        As at
                    30.06.2009 30.06.2008 31.03.2009 31.03.2008 31.03.2007 31.03.2006 31.03.2005
FIXED ASSETS
Gross Block           29,997.21        23,432.45        29,720.38        23,227.74     21,889.06     20,951.83    18,846.29
Less:                 19,078.75        16,515.43        18,382.62        16,146.60     15,521.36     14,892.21    12,844.28
Accumulated
Depreciation
Net Block             10,918.46         6,917.02        11,337.75         7,081.14      6,367.70      6,059.62      6,002.01
Capital Work           3,441.93         6,751.99         3,185.88         6,445.53      5,301.18      3,118.45      2,368.65
in progress
                      14,360.38        13,669.01        14,523.63        13,526.67     11,668.89      9,178.07      8,370.66
PRODUCING
PROPERTIES
Gross Cost            48,671.68        44,583.54        47,660.05        43,036.14     38,440.81     35,563.95    32,270.90
Less:                 22,973.15        20,936.64        22,445.53        20,357.88     18,183.08     16,406.56    14,578.49
Depletion
Net Cost              25,698.53        23,646.90        25,214.51        22,678.26     20,257.72     19,157.39    17,692.41
PRE-                   7,549.33         4,298.44         5,622.87         4,481.08      3,885.96      2,260.16      1,298.20
PRODUCING
PROPERTIES
INVESTMENTS            6,430.41         4,886.60         4,886.61         4,886.61      4,075.45      4,301.53      1,819.31
CURRENT
ASSETS,LOANS
AND ADVANCES
Inventories            5,009.56         4,888.96         5,009.95         4,508.95      4,080.24      3,989.46      2,607.82
Sundry                 7,337.35         7,166.78         4,047.34         5,608.54      3,726.98      5,286.78      5,513.46
debtors
Cash and              65,685.51        59,526.66        60,700.08        42,808.25     32,756.96     31,015.02    18,640.39
Bank Balances
Interest               1,666.57         1,160.99         3,517.23         2,150.37      1,453.67      1,094.13       596.32
/Dividend accrued
Term Deposits /
Investments
Loans and             11,801.05         6,209.28        10,443.95         6,069.83     12,805.41      4,458.75      9,260.39
Advances
                      91,500.03 78,952.66 83,718.55 61,145.93                          54,823.26     45,844.13    36,618.38
Total Assets        1,45,538.67 1,25,453.61 1,33,966.18 1,06,718.55                    94,711.28     80,741.28    65,798.96
LIABILITIES
AND
PROVISIONS
Secured Loans                 4.03           850.21            27.02      1,048.85      7,090.08      1,550.24        950.00
Unsecured                   512.50           675.00           537.50        700.00      1,050.00      1,400.00      1,861.61
Loans
Current               16,357.37        16,622.52        14,636.65        11,127.39      7,948.92      8,964.25      5,612.11
Liabilities
Provisions                         18,854.84        11,251.57        15,866.09         6,114.57        2,373.38         2,596.66        3,445.39
                                   35,728.74        29,399.30        31,067.26        18,990.81       18,462.37        14,511.15       11,869.12
DEFERRED TAX                        9,088.25         8,781.01         9,013.88         8,670.80        8,038.39         7,004.31        7,309.97
LIABILITY (NET)
WELL                    14.57                               11.41         14.57            11.41            10.72             10.00         0.00
ABANDONMENT
SINKING FUND
Total Liabilities   44,831.55                       38,191.71        40,095.71        27,673.02       26,511.49        21,525.46       19,179.09
NET WORTH         1,00,707.11                       87,261.90        93,870.47        79,045.53       68,199.79        59,215.82       46,619.87
REPRESENTED
BY
Share Capital        2,140.04                         2,140.04        2,140.04         2,140.04         2,140.04            2,140.04    2,140.04
Reserves and        98,567.07                       85,121.86        91,730.43        76,905.49       66,059.75        57,075.78       44,479.83
Surplus
                                1,00,707.11         87,261.90        93,870.47        79,045.53       68,199.79        59,215.82       46,619.87


Notes :


1.The above statement should be read with the Notes on Adjustments made for Restated Financial Statements(Annexure IVA),
Notes on Adjustments not made for Restated Financial Statements (Annexure IVB), Auditors' qualifications and treatment in
Restated Financial Informations (Annexure IV C), Significant Accounting Policies (Annexure VA) and Other Notes on Restated
Financial Statements (Annexure VB).


2.Reserve and Surplus comprises entirely General Reserve.


http://www.investingmantra.com
SUMMARY OF STATEMENT OF CASH FLOW, AS RESTATED

                                                                                                           (Rs. in million)
                            Quarter         Quarter      Year         Year           Year           Year            Year
                            ended      ended      ended      ended      ended      ended      ended
                            30.06.2009 30.06.2008 31.03.2009 31.03.2008 31.03.2007 31.03.2006 31.03.2005
Cash flow from
operating activities :
Profit before tax               10,644.52    12,423.12    33869.70     27,134.02      24,826.27      26,743.98       16,231.44
Adjustments (See
Annexure IVA)               -                 1,094.73      943.51      (150.28) (1,478.06)            867.79            659.57
Restated Profit Before
Tax                             10,644.52    13,517.85    34813.21     26983.74       23348.21       27611.77         16891.01
Adjustment for :
- Depreciation                    511.47       205.72      1628.24       971.15         818.34        (144.60)           588.98
- Depletion                       527.63       578.75      2087.64      2,174.80       1,776.52       1,750.25         1,749.35
- Provision for leave
encashment                         -20.51      109.88       191.93       329.45             71.65          45.45              18.55
- Foreign Exchange
(Gain)/Loss                        -60.83       49.03       (61.51)          39.21          11.24          (9.72)          (0.62)
- Provision for Post
retirement medical
benefits                             6.95        22.22        23.42      86.39       9.62      59.23     320.01
- Interest                           9.02        14.23        87.44     343.64     139.55     161.87     166.51
- Interest Income               -1,489.11      -940.53    (6141.79) (4,421.34) (3,188.70) (2,006.17) (1,399.87)
- Dividend Income                   -4.44       -31.79     (443.39)   (496.79)   (173.76)   (154.40)    (79.92)
-Other provision,
adjustment and write
offs                        -                  559.91      2585.02      3,025.07       2,513.65        799.28 (1,298.17)
                                 (519.82)      567.42       (43.00)      2051.58        1978.12        501.19      64.83
Operating profit before
working capital changes         10124.70     14085.27     34770.21     29035.32       25326.33       28112.95         16955.84
Adjustment for Changes
in WC
- Debtors                       (3290.01)    (1518.17)      1561.20 (1,881.56)   1,559.80               226.68           425.51
- Loans & Advances                 328.54    (1059.68)    (4374.12)   6,735.58 (8,346.66)             4,801.64           834.96
- Inventories                        0.40     (380.01)     (501.00)     (428.71)        (90.78) (1,381.64)             (235.41)
- Sundry Creditors &
other current liabilities        2596.75      6162.12      3509.26      3,178.47 (1,015.33)           3,352.14         2,722.22
Net Changes in
Working Capital                  (364.32)     3204.26       195.34      7,603.78 (7,892.97)           6,998.82         3,747.28
Cash generated from
operation                        9760.38     17289.53     34,965.55    36,639.10      17,433.36      35,111.77       20,703.12
Direct Taxes paid (Net
of Refund)                      (1381.38)     (424.66)    (5264.68) (8,756.19) (7,406.23) (9,222.79) (5,940.47)
Net cash flow from
operating activities
A'                                          8378.99          16864.87         29,700.87   27,882.91    10,027.14          25,888.99   14,762.65
Cash flow from
investing activities :
Purchase of Fixed
Assets (Net)                               (3286.31)         (1875.92)        (8495.99) (9,492.01) (9,370.32) (6,108.39) (6,283.27)
Investment Made                          (1543.80) -                      -            (4,228.37)      (0.02) (2,482.17)
Interest received                          1489.11            1935.54          5026.56   3,717.12   2,718.37    1,515.87               1,234.57
Dividend received                             4.44              31.79           443.39     496.79     173.76      154.40                  79.92
Investment Realised                    -           -                      -              3,417.22 -          -                           426.54
Net cash flow from
investing activities 'B'                   (3336.56)            91.41 (3,026.04) (6,089.25) (6,478.22) (6,920.30) (4,542.23)
Cash flow from
financing activities :
Repayment of
borrowings                                   (47.99)          (223.64)        (1184.33) (7,434.84)       (740.77)          (441.89)    (374.11)
Proceeds from
borrowings                             -                 -                -               1,043.62   5,539.83     600.24     589.71
Interest paid                                   (9.02)         (14.23)          (87.44)   (343.65)   (139.55)   (161.87)   (166.51)
Dividend paid                          -                 -                    (6420.13) (4,280.09) (5,671.12) (5,735.13) (2,996.06)
Tax on dividend                        -                 -                    (1091.10)   (727.41)   (795.37)   (855.40)   (391.55)
Net cash flow from
financing activities 'C'                     (57.01)          (237.87) (8,783.00) (11,742.37) (1,806.98) (6,594.05) (3,338.52)
Net Increase in cash
and cash equivalents
(A+B+C)                                     4985.43          16718.41         17,891.83   10,051.29     1,741.94          12,374.63    6,881.90
Cash and Cash
equivalent at the
beginning of the year                      60700.08          42808.25         42808.25    32,756.96    31,015.02          18,640.39   11,758.49
Cash and Cash
equivalent at the end
of the year                                65685.51          59526.66         60700.08    42808.25      32756.96          31015.02    18640.39
Components of Cash
and Cash equivalents:
Cash & Cheques
in Hand                                         23.59           22.80            16.11       10.60          10.01            13.04         7.21
Balance with
scheduled banks
Current Account                              337.60            397.81           851.24     1,488.95        883.94          1,130.88     404.68
Term Deposits                              65324.31          59106.05         59832.73    41,308.70    31,863.01          29,871.10   18,228.50
                                           65685.51          59526.66         60700.08    42,808.25    32,756.96          31,015.02   18,640.39


Notes :
1. The Cash Flow Statement has been prepared under indirect method as set out in Accounting Standard 3 (AS 3) Cash Flow
Statement    issued by the Institute of Chartered Accountants of India.


2. Cash outflows have been shown in brackets.


http://www.investingmantra.com

Weitere ähnliche Inhalte

Was ist angesagt?

Big_Lots_AR2001FSO
Big_Lots_AR2001FSOBig_Lots_AR2001FSO
Big_Lots_AR2001FSOfinance50
 
delta air line Reconciliations 2002
delta air line Reconciliations 2002delta air line Reconciliations 2002
delta air line Reconciliations 2002finance13
 
dover 3Q06_Earnings
dover 3Q06_Earningsdover 3Q06_Earnings
dover 3Q06_Earningsfinance30
 
Bnm condicion financiera bajo administracion SBS
Bnm   condicion financiera bajo administracion SBSBnm   condicion financiera bajo administracion SBS
Bnm condicion financiera bajo administracion SBSgonzaloromani
 
state street corp stt_finrev02
state street corp stt_finrev02state street corp stt_finrev02
state street corp stt_finrev02finance23
 
dover Q308_Supplement
dover Q308_Supplementdover Q308_Supplement
dover Q308_Supplementfinance30
 
tjx Annual Reports1998
tjx Annual Reports1998tjx Annual Reports1998
tjx Annual Reports1998finance14
 
capital one Printer Friendly Version of the Financial Supplement
capital one Printer Friendly Version of the Financial Supplementcapital one Printer Friendly Version of the Financial Supplement
capital one Printer Friendly Version of the Financial Supplementfinance13
 
delta air line 2006 sep
delta air line 2006 sepdelta air line 2006 sep
delta air line 2006 sepfinance13
 
allstate Financial Section 1999
allstate Financial Section 1999allstate Financial Section 1999
allstate Financial Section 1999finance7
 
Banco Nuevo Mundo - Activos Rentables Sistema Banca Comercial Peru nov 2000 o...
Banco Nuevo Mundo - Activos Rentables Sistema Banca Comercial Peru nov 2000 o...Banco Nuevo Mundo - Activos Rentables Sistema Banca Comercial Peru nov 2000 o...
Banco Nuevo Mundo - Activos Rentables Sistema Banca Comercial Peru nov 2000 o...gonzaloromani
 
05. Basic Hotel's Accounting by Dino Leonandri-STP Trisakti
05. Basic Hotel's Accounting  by Dino Leonandri-STP Trisakti05. Basic Hotel's Accounting  by Dino Leonandri-STP Trisakti
05. Basic Hotel's Accounting by Dino Leonandri-STP TrisaktiDINOLEONANDRI
 
dover Q208_Supplement_r232g32g32g
dover Q208_Supplement_r232g32g32gdover Q208_Supplement_r232g32g32g
dover Q208_Supplement_r232g32g32gfinance30
 

Was ist angesagt? (14)

Big_Lots_AR2001FSO
Big_Lots_AR2001FSOBig_Lots_AR2001FSO
Big_Lots_AR2001FSO
 
delta air line Reconciliations 2002
delta air line Reconciliations 2002delta air line Reconciliations 2002
delta air line Reconciliations 2002
 
dover 3Q06_Earnings
dover 3Q06_Earningsdover 3Q06_Earnings
dover 3Q06_Earnings
 
Bnm condicion financiera bajo administracion SBS
Bnm   condicion financiera bajo administracion SBSBnm   condicion financiera bajo administracion SBS
Bnm condicion financiera bajo administracion SBS
 
state street corp stt_finrev02
state street corp stt_finrev02state street corp stt_finrev02
state street corp stt_finrev02
 
dover Q308_Supplement
dover Q308_Supplementdover Q308_Supplement
dover Q308_Supplement
 
tjx Annual Reports1998
tjx Annual Reports1998tjx Annual Reports1998
tjx Annual Reports1998
 
Cipla 20-09-2010
Cipla   20-09-2010Cipla   20-09-2010
Cipla 20-09-2010
 
capital one Printer Friendly Version of the Financial Supplement
capital one Printer Friendly Version of the Financial Supplementcapital one Printer Friendly Version of the Financial Supplement
capital one Printer Friendly Version of the Financial Supplement
 
delta air line 2006 sep
delta air line 2006 sepdelta air line 2006 sep
delta air line 2006 sep
 
allstate Financial Section 1999
allstate Financial Section 1999allstate Financial Section 1999
allstate Financial Section 1999
 
Banco Nuevo Mundo - Activos Rentables Sistema Banca Comercial Peru nov 2000 o...
Banco Nuevo Mundo - Activos Rentables Sistema Banca Comercial Peru nov 2000 o...Banco Nuevo Mundo - Activos Rentables Sistema Banca Comercial Peru nov 2000 o...
Banco Nuevo Mundo - Activos Rentables Sistema Banca Comercial Peru nov 2000 o...
 
05. Basic Hotel's Accounting by Dino Leonandri-STP Trisakti
05. Basic Hotel's Accounting  by Dino Leonandri-STP Trisakti05. Basic Hotel's Accounting  by Dino Leonandri-STP Trisakti
05. Basic Hotel's Accounting by Dino Leonandri-STP Trisakti
 
dover Q208_Supplement_r232g32g32g
dover Q208_Supplement_r232g32g32gdover Q208_Supplement_r232g32g32g
dover Q208_Supplement_r232g32g32g
 

Andere mochten auch

Thangamayil Jwellery
Thangamayil JwelleryThangamayil Jwellery
Thangamayil JwelleryKunal
 
MBL Infrastructure IPO
MBL Infrastructure IPOMBL Infrastructure IPO
MBL Infrastructure IPOKunal
 
Graham Newman 1946 Letter
Graham Newman 1946 LetterGraham Newman 1946 Letter
Graham Newman 1946 LetterKunal
 
Employment Testing Implementation Challenges
Employment Testing Implementation ChallengesEmployment Testing Implementation Challenges
Employment Testing Implementation Challengesguesta045c6
 
Jubilant Foods Ipo
Jubilant Foods IpoJubilant Foods Ipo
Jubilant Foods IpoKunal
 
The Park Kochi, Kerela
The Park Kochi, KerelaThe Park Kochi, Kerela
The Park Kochi, KerelaLotus
 
Sirpur House
Sirpur HouseSirpur House
Sirpur HouseLotus
 
Spa for Park Kochi Kerela
Spa for Park Kochi KerelaSpa for Park Kochi Kerela
Spa for Park Kochi KerelaLotus
 
Presentatie groep 3
Presentatie groep 3Presentatie groep 3
Presentatie groep 3therealniels
 
Bgm Accordant General June2010 V2.02
Bgm Accordant General June2010 V2.02Bgm Accordant General June2010 V2.02
Bgm Accordant General June2010 V2.02Adept Space
 
Sdt Brochure V2.0
Sdt Brochure V2.0Sdt Brochure V2.0
Sdt Brochure V2.0Adept Space
 
Lez. 1 I.S.U. (2)
Lez. 1 I.S.U. (2)Lez. 1 I.S.U. (2)
Lez. 1 I.S.U. (2)skz
 
Diapos brades août_2012
Diapos brades août_2012Diapos brades août_2012
Diapos brades août_2012F_Chanelle_K
 
Presentation senfinances enda
Presentation senfinances endaPresentation senfinances enda
Presentation senfinances endaF_Chanelle_K
 
Midlife Crisis In Women Pp
Midlife Crisis In Women PpMidlife Crisis In Women Pp
Midlife Crisis In Women Ppguest823438
 
Viya Home 2
Viya Home   2Viya Home   2
Viya Home 2Lotus
 
Calypso
CalypsoCalypso
CalypsoLotus
 
Rohit Bal Prive
Rohit Bal PriveRohit Bal Prive
Rohit Bal PriveLotus
 
Mehrangarh Museum Shop
Mehrangarh   Museum ShopMehrangarh   Museum Shop
Mehrangarh Museum ShopLotus
 

Andere mochten auch (20)

Triview Single Sourcing Presentation
Triview Single Sourcing PresentationTriview Single Sourcing Presentation
Triview Single Sourcing Presentation
 
Thangamayil Jwellery
Thangamayil JwelleryThangamayil Jwellery
Thangamayil Jwellery
 
MBL Infrastructure IPO
MBL Infrastructure IPOMBL Infrastructure IPO
MBL Infrastructure IPO
 
Graham Newman 1946 Letter
Graham Newman 1946 LetterGraham Newman 1946 Letter
Graham Newman 1946 Letter
 
Employment Testing Implementation Challenges
Employment Testing Implementation ChallengesEmployment Testing Implementation Challenges
Employment Testing Implementation Challenges
 
Jubilant Foods Ipo
Jubilant Foods IpoJubilant Foods Ipo
Jubilant Foods Ipo
 
The Park Kochi, Kerela
The Park Kochi, KerelaThe Park Kochi, Kerela
The Park Kochi, Kerela
 
Sirpur House
Sirpur HouseSirpur House
Sirpur House
 
Spa for Park Kochi Kerela
Spa for Park Kochi KerelaSpa for Park Kochi Kerela
Spa for Park Kochi Kerela
 
Presentatie groep 3
Presentatie groep 3Presentatie groep 3
Presentatie groep 3
 
Bgm Accordant General June2010 V2.02
Bgm Accordant General June2010 V2.02Bgm Accordant General June2010 V2.02
Bgm Accordant General June2010 V2.02
 
Sdt Brochure V2.0
Sdt Brochure V2.0Sdt Brochure V2.0
Sdt Brochure V2.0
 
Lez. 1 I.S.U. (2)
Lez. 1 I.S.U. (2)Lez. 1 I.S.U. (2)
Lez. 1 I.S.U. (2)
 
Diapos brades août_2012
Diapos brades août_2012Diapos brades août_2012
Diapos brades août_2012
 
Presentation senfinances enda
Presentation senfinances endaPresentation senfinances enda
Presentation senfinances enda
 
Midlife Crisis In Women Pp
Midlife Crisis In Women PpMidlife Crisis In Women Pp
Midlife Crisis In Women Pp
 
Viya Home 2
Viya Home   2Viya Home   2
Viya Home 2
 
Calypso
CalypsoCalypso
Calypso
 
Rohit Bal Prive
Rohit Bal PriveRohit Bal Prive
Rohit Bal Prive
 
Mehrangarh Museum Shop
Mehrangarh   Museum ShopMehrangarh   Museum Shop
Mehrangarh Museum Shop
 

Ähnlich wie Summary of Statement of Profit and Loss and Assets & Liabilities

Finance reporting analysis
Finance reporting analysisFinance reporting analysis
Finance reporting analysisKuldeep Yadav
 
financial statement analysis of Idea Cellular
financial statement analysis of Idea Cellularfinancial statement analysis of Idea Cellular
financial statement analysis of Idea CellularDeepak Srivastva
 
Basic Hotel Accounting Principles #4 Session by Dino Leonandri
Basic Hotel Accounting Principles  #4 Session by Dino LeonandriBasic Hotel Accounting Principles  #4 Session by Dino Leonandri
Basic Hotel Accounting Principles #4 Session by Dino LeonandriDINOLEONANDRI
 
Profit Loss Account Of Tata Motors
Profit Loss Account Of Tata MotorsProfit Loss Account Of Tata Motors
Profit Loss Account Of Tata Motorspurval
 
atmos enerrgy segmentinfo040408
atmos enerrgy segmentinfo040408atmos enerrgy segmentinfo040408
atmos enerrgy segmentinfo040408finance35
 
Intl Financial Highlights
Intl Financial HighlightsIntl Financial Highlights
Intl Financial Highlightsearnirgsreports
 
Bajaj finserv
Bajaj finservBajaj finserv
Bajaj finservRavi Teja
 
conoco phillips 2006Fourth Quarter
conoco phillips 2006Fourth Quarterconoco phillips 2006Fourth Quarter
conoco phillips 2006Fourth Quarterfinance1
 
conoco phillips 2004Third Quarter
conoco phillips 2004Third Quarterconoco phillips 2004Third Quarter
conoco phillips 2004Third Quarterfinance1
 
AXA Poland non life insurance companies
AXA Poland non life insurance companiesAXA Poland non life insurance companies
AXA Poland non life insurance companiesZbigniew Borys
 

Ähnlich wie Summary of Statement of Profit and Loss and Assets & Liabilities (20)

Finance reporting analysis
Finance reporting analysisFinance reporting analysis
Finance reporting analysis
 
financial statement analysis of Idea Cellular
financial statement analysis of Idea Cellularfinancial statement analysis of Idea Cellular
financial statement analysis of Idea Cellular
 
Basic Hotel Accounting Principles #4 Session by Dino Leonandri
Basic Hotel Accounting Principles  #4 Session by Dino LeonandriBasic Hotel Accounting Principles  #4 Session by Dino Leonandri
Basic Hotel Accounting Principles #4 Session by Dino Leonandri
 
Ekiti State Financial Report for the year 2015
Ekiti State Financial Report for the year 2015Ekiti State Financial Report for the year 2015
Ekiti State Financial Report for the year 2015
 
Profit Loss Account Of Tata Motors
Profit Loss Account Of Tata MotorsProfit Loss Account Of Tata Motors
Profit Loss Account Of Tata Motors
 
Credit Analysis of HCC Excel
Credit Analysis of HCC ExcelCredit Analysis of HCC Excel
Credit Analysis of HCC Excel
 
Hul p&l account
Hul p&l accountHul p&l account
Hul p&l account
 
atmos enerrgy segmentinfo040408
atmos enerrgy segmentinfo040408atmos enerrgy segmentinfo040408
atmos enerrgy segmentinfo040408
 
Rahul Mehrotra Presentation on Reliance Financial Ratio
Rahul Mehrotra Presentation on Reliance Financial RatioRahul Mehrotra Presentation on Reliance Financial Ratio
Rahul Mehrotra Presentation on Reliance Financial Ratio
 
Pantaloon 2008 2009
Pantaloon 2008 2009Pantaloon 2008 2009
Pantaloon 2008 2009
 
SSS Annual Report 2009
SSS Annual Report 2009SSS Annual Report 2009
SSS Annual Report 2009
 
Intl Financial Highlights
Intl Financial HighlightsIntl Financial Highlights
Intl Financial Highlights
 
Ekiti State Financial Report for the year 2016
Ekiti State Financial Report for the year 2016Ekiti State Financial Report for the year 2016
Ekiti State Financial Report for the year 2016
 
CMC q3 fy08
CMC q3 fy08CMC q3 fy08
CMC q3 fy08
 
Bajaj finserv
Bajaj finservBajaj finserv
Bajaj finserv
 
conoco phillips 2006Fourth Quarter
conoco phillips 2006Fourth Quarterconoco phillips 2006Fourth Quarter
conoco phillips 2006Fourth Quarter
 
Saldo a pagar
Saldo a pagarSaldo a pagar
Saldo a pagar
 
conoco phillips 2004Third Quarter
conoco phillips 2004Third Quarterconoco phillips 2004Third Quarter
conoco phillips 2004Third Quarter
 
Harpreet
HarpreetHarpreet
Harpreet
 
AXA Poland non life insurance companies
AXA Poland non life insurance companiesAXA Poland non life insurance companies
AXA Poland non life insurance companies
 

Kürzlich hochgeladen

Traction part 2 - EOS Model JAX Bridges.
Traction part 2 - EOS Model JAX Bridges.Traction part 2 - EOS Model JAX Bridges.
Traction part 2 - EOS Model JAX Bridges.Anamaria Contreras
 
8447779800, Low rate Call girls in Shivaji Enclave Delhi NCR
8447779800, Low rate Call girls in Shivaji Enclave Delhi NCR8447779800, Low rate Call girls in Shivaji Enclave Delhi NCR
8447779800, Low rate Call girls in Shivaji Enclave Delhi NCRashishs7044
 
Kenya Coconut Production Presentation by Dr. Lalith Perera
Kenya Coconut Production Presentation by Dr. Lalith PereraKenya Coconut Production Presentation by Dr. Lalith Perera
Kenya Coconut Production Presentation by Dr. Lalith Pereraictsugar
 
Investment in The Coconut Industry by Nancy Cheruiyot
Investment in The Coconut Industry by Nancy CheruiyotInvestment in The Coconut Industry by Nancy Cheruiyot
Investment in The Coconut Industry by Nancy Cheruiyotictsugar
 
(Best) ENJOY Call Girls in Faridabad Ex | 8377087607
(Best) ENJOY Call Girls in Faridabad Ex | 8377087607(Best) ENJOY Call Girls in Faridabad Ex | 8377087607
(Best) ENJOY Call Girls in Faridabad Ex | 8377087607dollysharma2066
 
8447779800, Low rate Call girls in Kotla Mubarakpur Delhi NCR
8447779800, Low rate Call girls in Kotla Mubarakpur Delhi NCR8447779800, Low rate Call girls in Kotla Mubarakpur Delhi NCR
8447779800, Low rate Call girls in Kotla Mubarakpur Delhi NCRashishs7044
 
NewBase 19 April 2024 Energy News issue - 1717 by Khaled Al Awadi.pdf
NewBase  19 April  2024  Energy News issue - 1717 by Khaled Al Awadi.pdfNewBase  19 April  2024  Energy News issue - 1717 by Khaled Al Awadi.pdf
NewBase 19 April 2024 Energy News issue - 1717 by Khaled Al Awadi.pdfKhaled Al Awadi
 
Call US-88OO1O2216 Call Girls In Mahipalpur Female Escort Service
Call US-88OO1O2216 Call Girls In Mahipalpur Female Escort ServiceCall US-88OO1O2216 Call Girls In Mahipalpur Female Escort Service
Call US-88OO1O2216 Call Girls In Mahipalpur Female Escort Servicecallgirls2057
 
Guide Complete Set of Residential Architectural Drawings PDF
Guide Complete Set of Residential Architectural Drawings PDFGuide Complete Set of Residential Architectural Drawings PDF
Guide Complete Set of Residential Architectural Drawings PDFChandresh Chudasama
 
8447779800, Low rate Call girls in Rohini Delhi NCR
8447779800, Low rate Call girls in Rohini Delhi NCR8447779800, Low rate Call girls in Rohini Delhi NCR
8447779800, Low rate Call girls in Rohini Delhi NCRashishs7044
 
MAHA Global and IPR: Do Actions Speak Louder Than Words?
MAHA Global and IPR: Do Actions Speak Louder Than Words?MAHA Global and IPR: Do Actions Speak Louder Than Words?
MAHA Global and IPR: Do Actions Speak Louder Than Words?Olivia Kresic
 
Call Us 📲8800102216📞 Call Girls In DLF City Gurgaon
Call Us 📲8800102216📞 Call Girls In DLF City GurgaonCall Us 📲8800102216📞 Call Girls In DLF City Gurgaon
Call Us 📲8800102216📞 Call Girls In DLF City Gurgaoncallgirls2057
 
Fordham -How effective decision-making is within the IT department - Analysis...
Fordham -How effective decision-making is within the IT department - Analysis...Fordham -How effective decision-making is within the IT department - Analysis...
Fordham -How effective decision-making is within the IT department - Analysis...Peter Ward
 
Organizational Structure Running A Successful Business
Organizational Structure Running A Successful BusinessOrganizational Structure Running A Successful Business
Organizational Structure Running A Successful BusinessSeta Wicaksana
 
International Business Environments and Operations 16th Global Edition test b...
International Business Environments and Operations 16th Global Edition test b...International Business Environments and Operations 16th Global Edition test b...
International Business Environments and Operations 16th Global Edition test b...ssuserf63bd7
 
8447779800, Low rate Call girls in Uttam Nagar Delhi NCR
8447779800, Low rate Call girls in Uttam Nagar Delhi NCR8447779800, Low rate Call girls in Uttam Nagar Delhi NCR
8447779800, Low rate Call girls in Uttam Nagar Delhi NCRashishs7044
 
Ten Organizational Design Models to align structure and operations to busines...
Ten Organizational Design Models to align structure and operations to busines...Ten Organizational Design Models to align structure and operations to busines...
Ten Organizational Design Models to align structure and operations to busines...Seta Wicaksana
 
8447779800, Low rate Call girls in Tughlakabad Delhi NCR
8447779800, Low rate Call girls in Tughlakabad Delhi NCR8447779800, Low rate Call girls in Tughlakabad Delhi NCR
8447779800, Low rate Call girls in Tughlakabad Delhi NCRashishs7044
 
Annual General Meeting Presentation Slides
Annual General Meeting Presentation SlidesAnnual General Meeting Presentation Slides
Annual General Meeting Presentation SlidesKeppelCorporation
 

Kürzlich hochgeladen (20)

Traction part 2 - EOS Model JAX Bridges.
Traction part 2 - EOS Model JAX Bridges.Traction part 2 - EOS Model JAX Bridges.
Traction part 2 - EOS Model JAX Bridges.
 
8447779800, Low rate Call girls in Shivaji Enclave Delhi NCR
8447779800, Low rate Call girls in Shivaji Enclave Delhi NCR8447779800, Low rate Call girls in Shivaji Enclave Delhi NCR
8447779800, Low rate Call girls in Shivaji Enclave Delhi NCR
 
Kenya Coconut Production Presentation by Dr. Lalith Perera
Kenya Coconut Production Presentation by Dr. Lalith PereraKenya Coconut Production Presentation by Dr. Lalith Perera
Kenya Coconut Production Presentation by Dr. Lalith Perera
 
Investment in The Coconut Industry by Nancy Cheruiyot
Investment in The Coconut Industry by Nancy CheruiyotInvestment in The Coconut Industry by Nancy Cheruiyot
Investment in The Coconut Industry by Nancy Cheruiyot
 
(Best) ENJOY Call Girls in Faridabad Ex | 8377087607
(Best) ENJOY Call Girls in Faridabad Ex | 8377087607(Best) ENJOY Call Girls in Faridabad Ex | 8377087607
(Best) ENJOY Call Girls in Faridabad Ex | 8377087607
 
8447779800, Low rate Call girls in Kotla Mubarakpur Delhi NCR
8447779800, Low rate Call girls in Kotla Mubarakpur Delhi NCR8447779800, Low rate Call girls in Kotla Mubarakpur Delhi NCR
8447779800, Low rate Call girls in Kotla Mubarakpur Delhi NCR
 
NewBase 19 April 2024 Energy News issue - 1717 by Khaled Al Awadi.pdf
NewBase  19 April  2024  Energy News issue - 1717 by Khaled Al Awadi.pdfNewBase  19 April  2024  Energy News issue - 1717 by Khaled Al Awadi.pdf
NewBase 19 April 2024 Energy News issue - 1717 by Khaled Al Awadi.pdf
 
Call US-88OO1O2216 Call Girls In Mahipalpur Female Escort Service
Call US-88OO1O2216 Call Girls In Mahipalpur Female Escort ServiceCall US-88OO1O2216 Call Girls In Mahipalpur Female Escort Service
Call US-88OO1O2216 Call Girls In Mahipalpur Female Escort Service
 
Guide Complete Set of Residential Architectural Drawings PDF
Guide Complete Set of Residential Architectural Drawings PDFGuide Complete Set of Residential Architectural Drawings PDF
Guide Complete Set of Residential Architectural Drawings PDF
 
8447779800, Low rate Call girls in Rohini Delhi NCR
8447779800, Low rate Call girls in Rohini Delhi NCR8447779800, Low rate Call girls in Rohini Delhi NCR
8447779800, Low rate Call girls in Rohini Delhi NCR
 
MAHA Global and IPR: Do Actions Speak Louder Than Words?
MAHA Global and IPR: Do Actions Speak Louder Than Words?MAHA Global and IPR: Do Actions Speak Louder Than Words?
MAHA Global and IPR: Do Actions Speak Louder Than Words?
 
Call Us 📲8800102216📞 Call Girls In DLF City Gurgaon
Call Us 📲8800102216📞 Call Girls In DLF City GurgaonCall Us 📲8800102216📞 Call Girls In DLF City Gurgaon
Call Us 📲8800102216📞 Call Girls In DLF City Gurgaon
 
Fordham -How effective decision-making is within the IT department - Analysis...
Fordham -How effective decision-making is within the IT department - Analysis...Fordham -How effective decision-making is within the IT department - Analysis...
Fordham -How effective decision-making is within the IT department - Analysis...
 
Organizational Structure Running A Successful Business
Organizational Structure Running A Successful BusinessOrganizational Structure Running A Successful Business
Organizational Structure Running A Successful Business
 
International Business Environments and Operations 16th Global Edition test b...
International Business Environments and Operations 16th Global Edition test b...International Business Environments and Operations 16th Global Edition test b...
International Business Environments and Operations 16th Global Edition test b...
 
Call Us ➥9319373153▻Call Girls In North Goa
Call Us ➥9319373153▻Call Girls In North GoaCall Us ➥9319373153▻Call Girls In North Goa
Call Us ➥9319373153▻Call Girls In North Goa
 
8447779800, Low rate Call girls in Uttam Nagar Delhi NCR
8447779800, Low rate Call girls in Uttam Nagar Delhi NCR8447779800, Low rate Call girls in Uttam Nagar Delhi NCR
8447779800, Low rate Call girls in Uttam Nagar Delhi NCR
 
Ten Organizational Design Models to align structure and operations to busines...
Ten Organizational Design Models to align structure and operations to busines...Ten Organizational Design Models to align structure and operations to busines...
Ten Organizational Design Models to align structure and operations to busines...
 
8447779800, Low rate Call girls in Tughlakabad Delhi NCR
8447779800, Low rate Call girls in Tughlakabad Delhi NCR8447779800, Low rate Call girls in Tughlakabad Delhi NCR
8447779800, Low rate Call girls in Tughlakabad Delhi NCR
 
Annual General Meeting Presentation Slides
Annual General Meeting Presentation SlidesAnnual General Meeting Presentation Slides
Annual General Meeting Presentation Slides
 

Summary of Statement of Profit and Loss and Assets & Liabilities

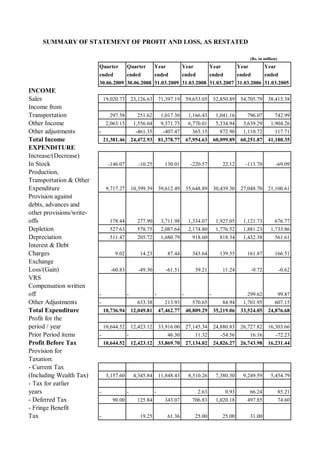
  • 1. SUMMARY OF STATEMENT OF PROFIT AND LOSS, AS RESTATED (Rs. in million) Quarter Quarter Year Year Year Year Year ended ended ended ended ended ended ended 30.06.2009 30.06.2008 31.03.2009 31.03.2008 31.03.2007 31.03.2006 31.03.2005 INCOME Sales 19,020.73 23,126.63 71,397.19 59,653.05 52,850.89 54,705.79 38,415.38 Income from Transportation 297.58 251.62 1,017.30 1,166.43 1,041.16 796.07 742.99 Other Income 2,063.15 1,556.04 9,371.75 6,770.01 5,334.94 3,639.29 1,904.26 Other adjustments - -461.35 -407.47 365.15 872.90 1,110.72 117.71 Total Income 21,381.46 24,472.93 81,378.77 67,954.63 60,099.89 60,251.87 41,180.35 EXPENDITURE Increase/(Decrease) In Stock -146.07 -10.25 130.01 -220.57 22.12 -113.70 -69.09 Production, Transportation & Other Expenditure 9,717.27 10,399.39 39,612.49 35,648.89 30,439.30 27,048.70 21,100.61 Provision against debts, advances and other provisions/write- offs 178.44 277.90 3,711.98 1,334.07 1,927.05 1,121.73 676.77 Depletion 527.63 578.75 2,087.64 2,174.80 1,776.52 1,881.23 1,733.86 Depreciation 511.47 205.72 1,680.79 918.60 818.34 1,432.38 561.61 Interest & Debt Charges 9.02 14.23 87.44 343.64 139.55 161.87 166.51 Exchange Loss/(Gain) -60.83 -49.30 -61.51 39.21 11.24 -9.72 -0.62 VRS Compensation written off - - - - - 299.62 99.87 Other Adjustments - 633.38 213.93 570.65 84.94 1,701.95 607.15 Total Expenditure 10,736.94 12,049.81 47,462.77 40,809.29 35,219.06 33,524.05 24,876.68 Profit for the period / year 10,644.52 12,423.12 33,916.00 27,145.34 24,880.83 26,727.82 16,303.66 Prior Period items - - 46.30 11.32 -54.56 16.16 -72.23 Profit Before Tax 10,644.52 12,423.12 33,869.70 27,134.02 24,826.27 26,743.98 16,231.44 Provision for Taxation: - Current Tax (Including Wealth Tax) 3,157.60 4,345.84 11,848.43 8,510.26 7,380.30 9,249.59 5,454.79 - Tax for earlier years - - - 2.63 0.93 66.24 85.21 - Deferred Tax 90.00 125.84 343.07 706.83 1,020.18 497.85 74.60 - Fringe Benefit Tax - 19.25 61.36 25.00 25.00 31.00
  • 2. 3,247.60 4,490.93 12,252.86 9,244.71 8,426.41 9,844.67 5,614.60 Profit After Tax as per audited statement of accounts 7,396.92 7,932.19 21,616.84 17,889.31 16,399.86 16,899.31 10,616.84 Adjustments on account of : a) Changes in Accounting Policies - - - - - 2,060.73 51.27 b) Other Adjustments and Prior Period Items - 1,094.73 943.51 -150.28 -1,478.06 -1,192.94 608.30 c) Current Tax Impact on Adjustments - (248.14) -251.85 67.50 468.21 443.97 -316.94 d) Deferred Tax -10.56 13.90 159.84 -151.02 Impact on Adjustments - - - Total of Adjustments after tax impact - - 691.66 -93.34 -995.95 1,471.60 191.61 Profit after Tax as Restated - 846.59 22,308.50 17,795.97 15,403.91 18,370.91 10,808.45 BALANCE AVAILABLE FOR APPROPRIATION, AS RESTATED 7,396.92 8,778.78 22,308.50 17,795.97 15,403.91 18,370.91 10,808.45 APPROPRIATIONS: Interim Dividends - - 3,210.07 2,675.06 3,959.08 3,959.08 1,284.03 Tax on Interim Dividends - - 545.55 454.63 555.26 555.26 172.19 Final Dividend (Proposed) - - 3,317.01 3,210.07 1,605.03 1,712.04 2,140.04 Tax on Proposed Dividend - - 563.73 545.55 272.78 240.11 300.14 Transfer to General Reserve - - 14,672.14 10,910.68 9,011.76 11,904.42 6,912.05 Balance of Profit and Loss Account 7,396.92 8,778.78 - - - - TOTAL 7,396.92 8,778.78 22,308.50 17,795.97 15,403.91 18,370.91 10,808.45 Notes : 1. The above statement should be read with the Notes on Adjustments made for Restated Financial Statements (Annexure IVA), Notes on Adjustments not made for Restated Financial Statements (Annexure IVB), Auditors' qualifications and treatment in Restated Financial information (Annexure IV C), Significant Accounting Policies (Annexure V A) and Other Notes on Restated Financial Statements (Annexure V B). 2. The reconciliation between the Audited and Restated accumulated Profit and Loss balance is given in Notes on Adjustments made for Restated Financial Statements (Annexure IV A.) 3. Negative figures have been shown in brackets. http://www.investingmantra.com
  • 3. SUMMARY OF STATEMENT OF ASSETS AND LIABILITIES, AS RESTATED (Rs. in million) As at As at As at As at As at As at As at 30.06.2009 30.06.2008 31.03.2009 31.03.2008 31.03.2007 31.03.2006 31.03.2005 FIXED ASSETS Gross Block 29,997.21 23,432.45 29,720.38 23,227.74 21,889.06 20,951.83 18,846.29 Less: 19,078.75 16,515.43 18,382.62 16,146.60 15,521.36 14,892.21 12,844.28 Accumulated Depreciation Net Block 10,918.46 6,917.02 11,337.75 7,081.14 6,367.70 6,059.62 6,002.01 Capital Work 3,441.93 6,751.99 3,185.88 6,445.53 5,301.18 3,118.45 2,368.65 in progress 14,360.38 13,669.01 14,523.63 13,526.67 11,668.89 9,178.07 8,370.66 PRODUCING PROPERTIES Gross Cost 48,671.68 44,583.54 47,660.05 43,036.14 38,440.81 35,563.95 32,270.90 Less: 22,973.15 20,936.64 22,445.53 20,357.88 18,183.08 16,406.56 14,578.49 Depletion Net Cost 25,698.53 23,646.90 25,214.51 22,678.26 20,257.72 19,157.39 17,692.41 PRE- 7,549.33 4,298.44 5,622.87 4,481.08 3,885.96 2,260.16 1,298.20 PRODUCING PROPERTIES INVESTMENTS 6,430.41 4,886.60 4,886.61 4,886.61 4,075.45 4,301.53 1,819.31 CURRENT ASSETS,LOANS AND ADVANCES Inventories 5,009.56 4,888.96 5,009.95 4,508.95 4,080.24 3,989.46 2,607.82 Sundry 7,337.35 7,166.78 4,047.34 5,608.54 3,726.98 5,286.78 5,513.46 debtors Cash and 65,685.51 59,526.66 60,700.08 42,808.25 32,756.96 31,015.02 18,640.39 Bank Balances Interest 1,666.57 1,160.99 3,517.23 2,150.37 1,453.67 1,094.13 596.32 /Dividend accrued Term Deposits / Investments Loans and 11,801.05 6,209.28 10,443.95 6,069.83 12,805.41 4,458.75 9,260.39 Advances 91,500.03 78,952.66 83,718.55 61,145.93 54,823.26 45,844.13 36,618.38 Total Assets 1,45,538.67 1,25,453.61 1,33,966.18 1,06,718.55 94,711.28 80,741.28 65,798.96 LIABILITIES AND PROVISIONS Secured Loans 4.03 850.21 27.02 1,048.85 7,090.08 1,550.24 950.00 Unsecured 512.50 675.00 537.50 700.00 1,050.00 1,400.00 1,861.61 Loans Current 16,357.37 16,622.52 14,636.65 11,127.39 7,948.92 8,964.25 5,612.11
  • 4. Liabilities Provisions 18,854.84 11,251.57 15,866.09 6,114.57 2,373.38 2,596.66 3,445.39 35,728.74 29,399.30 31,067.26 18,990.81 18,462.37 14,511.15 11,869.12 DEFERRED TAX 9,088.25 8,781.01 9,013.88 8,670.80 8,038.39 7,004.31 7,309.97 LIABILITY (NET) WELL 14.57 11.41 14.57 11.41 10.72 10.00 0.00 ABANDONMENT SINKING FUND Total Liabilities 44,831.55 38,191.71 40,095.71 27,673.02 26,511.49 21,525.46 19,179.09 NET WORTH 1,00,707.11 87,261.90 93,870.47 79,045.53 68,199.79 59,215.82 46,619.87 REPRESENTED BY Share Capital 2,140.04 2,140.04 2,140.04 2,140.04 2,140.04 2,140.04 2,140.04 Reserves and 98,567.07 85,121.86 91,730.43 76,905.49 66,059.75 57,075.78 44,479.83 Surplus 1,00,707.11 87,261.90 93,870.47 79,045.53 68,199.79 59,215.82 46,619.87 Notes : 1.The above statement should be read with the Notes on Adjustments made for Restated Financial Statements(Annexure IVA), Notes on Adjustments not made for Restated Financial Statements (Annexure IVB), Auditors' qualifications and treatment in Restated Financial Informations (Annexure IV C), Significant Accounting Policies (Annexure VA) and Other Notes on Restated Financial Statements (Annexure VB). 2.Reserve and Surplus comprises entirely General Reserve. http://www.investingmantra.com
  • 5. SUMMARY OF STATEMENT OF CASH FLOW, AS RESTATED (Rs. in million) Quarter Quarter Year Year Year Year Year ended ended ended ended ended ended ended 30.06.2009 30.06.2008 31.03.2009 31.03.2008 31.03.2007 31.03.2006 31.03.2005 Cash flow from operating activities : Profit before tax 10,644.52 12,423.12 33869.70 27,134.02 24,826.27 26,743.98 16,231.44 Adjustments (See Annexure IVA) - 1,094.73 943.51 (150.28) (1,478.06) 867.79 659.57 Restated Profit Before Tax 10,644.52 13,517.85 34813.21 26983.74 23348.21 27611.77 16891.01 Adjustment for : - Depreciation 511.47 205.72 1628.24 971.15 818.34 (144.60) 588.98 - Depletion 527.63 578.75 2087.64 2,174.80 1,776.52 1,750.25 1,749.35 - Provision for leave encashment -20.51 109.88 191.93 329.45 71.65 45.45 18.55 - Foreign Exchange (Gain)/Loss -60.83 49.03 (61.51) 39.21 11.24 (9.72) (0.62) - Provision for Post retirement medical benefits 6.95 22.22 23.42 86.39 9.62 59.23 320.01 - Interest 9.02 14.23 87.44 343.64 139.55 161.87 166.51 - Interest Income -1,489.11 -940.53 (6141.79) (4,421.34) (3,188.70) (2,006.17) (1,399.87) - Dividend Income -4.44 -31.79 (443.39) (496.79) (173.76) (154.40) (79.92) -Other provision, adjustment and write offs - 559.91 2585.02 3,025.07 2,513.65 799.28 (1,298.17) (519.82) 567.42 (43.00) 2051.58 1978.12 501.19 64.83 Operating profit before working capital changes 10124.70 14085.27 34770.21 29035.32 25326.33 28112.95 16955.84 Adjustment for Changes in WC - Debtors (3290.01) (1518.17) 1561.20 (1,881.56) 1,559.80 226.68 425.51 - Loans & Advances 328.54 (1059.68) (4374.12) 6,735.58 (8,346.66) 4,801.64 834.96 - Inventories 0.40 (380.01) (501.00) (428.71) (90.78) (1,381.64) (235.41) - Sundry Creditors & other current liabilities 2596.75 6162.12 3509.26 3,178.47 (1,015.33) 3,352.14 2,722.22 Net Changes in Working Capital (364.32) 3204.26 195.34 7,603.78 (7,892.97) 6,998.82 3,747.28 Cash generated from operation 9760.38 17289.53 34,965.55 36,639.10 17,433.36 35,111.77 20,703.12 Direct Taxes paid (Net of Refund) (1381.38) (424.66) (5264.68) (8,756.19) (7,406.23) (9,222.79) (5,940.47) Net cash flow from operating activities
  • 6. A' 8378.99 16864.87 29,700.87 27,882.91 10,027.14 25,888.99 14,762.65 Cash flow from investing activities : Purchase of Fixed Assets (Net) (3286.31) (1875.92) (8495.99) (9,492.01) (9,370.32) (6,108.39) (6,283.27) Investment Made (1543.80) - - (4,228.37) (0.02) (2,482.17) Interest received 1489.11 1935.54 5026.56 3,717.12 2,718.37 1,515.87 1,234.57 Dividend received 4.44 31.79 443.39 496.79 173.76 154.40 79.92 Investment Realised - - - 3,417.22 - - 426.54 Net cash flow from investing activities 'B' (3336.56) 91.41 (3,026.04) (6,089.25) (6,478.22) (6,920.30) (4,542.23) Cash flow from financing activities : Repayment of borrowings (47.99) (223.64) (1184.33) (7,434.84) (740.77) (441.89) (374.11) Proceeds from borrowings - - - 1,043.62 5,539.83 600.24 589.71 Interest paid (9.02) (14.23) (87.44) (343.65) (139.55) (161.87) (166.51) Dividend paid - - (6420.13) (4,280.09) (5,671.12) (5,735.13) (2,996.06) Tax on dividend - - (1091.10) (727.41) (795.37) (855.40) (391.55) Net cash flow from financing activities 'C' (57.01) (237.87) (8,783.00) (11,742.37) (1,806.98) (6,594.05) (3,338.52) Net Increase in cash and cash equivalents (A+B+C) 4985.43 16718.41 17,891.83 10,051.29 1,741.94 12,374.63 6,881.90 Cash and Cash equivalent at the beginning of the year 60700.08 42808.25 42808.25 32,756.96 31,015.02 18,640.39 11,758.49 Cash and Cash equivalent at the end of the year 65685.51 59526.66 60700.08 42808.25 32756.96 31015.02 18640.39 Components of Cash and Cash equivalents: Cash & Cheques in Hand 23.59 22.80 16.11 10.60 10.01 13.04 7.21 Balance with scheduled banks Current Account 337.60 397.81 851.24 1,488.95 883.94 1,130.88 404.68 Term Deposits 65324.31 59106.05 59832.73 41,308.70 31,863.01 29,871.10 18,228.50 65685.51 59526.66 60700.08 42,808.25 32,756.96 31,015.02 18,640.39 Notes : 1. The Cash Flow Statement has been prepared under indirect method as set out in Accounting Standard 3 (AS 3) Cash Flow Statement issued by the Institute of Chartered Accountants of India. 2. Cash outflows have been shown in brackets. http://www.investingmantra.com