SlideShare a Scribd company logo
1 of 12
Download to read offline
International Journal of Business and Management Invention
ISSN (Online): 2319 – 8028, ISSN (Print): 2319 – 801X
www.ijbmi.org || Volume 4 Issue 2 || February. 2015 || PP.29-40
www.ijbmi.org 29 | Page
Effects of government taxation policy on sales revenue of SME in Uasin
Gishu County, Kenya
1
Isaac Kipchirchir Kamar
1
Deputy Director (Administration and Finance), Kisii University Eldoret Campus
1
BA (Kenyatta University), MBA Strategic Management (Kisii University), PhD (Cont.)Entrepreneurship and
Innovation (Kisii University)
ABSTRACT: In Kenya, SME provide source of employment creation, innovation, competition, economic
dynamism which eventually lead to poverty alleviation and national growth. Government taxation policy is one
of the factors that constitute the SMEs‟ economic surroundings. This study sought to find out the effects of
government taxation policy on sales revenue of SME in Kenya and particularly Uasin Gishu County. In order to
achieve the purpose of this study, the specific research objective was addressed: to find out the effects of
government taxation policy on sales revenue of SME. The data for this study was collected from primary and
secondary sources. While the research instruments were questionnaire, interview and document analysis, the
study population comprised of staff and management of SME within Uasin Gishu County, Kenya who formed the
sample for the study. The explanatory research design was employed in the study. The samples for the study
were selected using stratified random and simple random sampling methods. The data from the research
instruments were coded and analyzed using the SPSS. Descriptive statistics, frequency tables, percentages,
mean and standard deviation were used to present the data, while Correlation was used to test the hypotheses.
Results of the study found statistically significant relationships between the three dimensions of government
taxation policy and sales revenue. The researcher concluded therefore that government taxation policy had a
significant impact on sales revenue of SMEs.
KEY WORDS: Taxation policy, Profitability, Growth
I. INTRODUCTION
Background Information : Taxation policy towards SME is an important issue because SME are a significant
segment of the economy, despite being individually smaller in size than larger firms. In addition, they improve
the standard of living of a majority of the population. Therefore, revenue authorities have to take all of the above
features into account when establishing the components of taxation policy that are associated with SME. Despite
the vibrancy of SME, they have a major negative characteristic: they often have an extremely short life span.
Some of the factors that lead to the winding down of SME soon after their inception are tax related, including
multiple taxation and enormous tax burdens. The perception of SME by policy makers often fails to
acknowledge their significance as a mechanism of economic growth and development. Regarding SME as
insignificant enterprises that have no impact on the economy is an oversight that can no longer be justified. This
is because SME merely require a favorable regulatory environment in which to conduct business, and they will
demonstrate their potential for profitability and growth. Thus they need to be granted a measure of flexibility in
taxation which will allow them to maximize their potential. The profitability and growth of SME can be
assessed through the parameters of sales revenue, asset accumulation, and returns on capital, therefore it is
important to find out the effect that taxation policy has on them.
According to (Holban, 2007), taxation can contribute to development and to welfare through three
sources; by generating sufficient funds for financing public services and social transfers at a high level of
quality, by offering incentive for more employment and for an efficient and lasting use of natural resources, and
by reallocation of income. However, this has to be balanced against the requirements of SME income and their
need for survival. Without sufficient profitability, SME growth will be rendered impossible. Therefore, any
prospective tax policy will have to evaluate the factors that encourage non-compliance with tax obligation by
SME. Although it has been acknowledged that taxation is a constraint on the productivity and growth of SME,
this does not mean that SME should not pay tax. Without tax revenue, governments will be unable to facilitate
the environment in which SME thrive, therefore it is in SME own best interest to pay taxes. The government has
to collect revenue in order to finance its expenditure. Income obtained from taxation of individuals and
businesses is used to run governments and to build and maintain infrastructure such as good roads, water supply,
and electricity which are essential for the smooth running of businesses. With the above in mind, the goal of the
current study sought to determine the importance of government taxation policy on profitability of SME.
Effects of government taxation policy on sales...
www.ijbmi.org 30 | Page
Statement of the Problem : Taxation is the lifeblood of government, as it provides the revenues which go
towards ensuring that government is able to fulfill its role of maintaining law and order and facilitating trade and
industry, among other duties. SME and taxation are not mutually exclusive by any means. Yet it has been noted,
in previous studies (Tomlin, 2008) that SME sacrifice funds to pay taxes, which could otherwise be invested in
business growth. This dilemma is at the crux of the issue under investigation in this study, which is: how can
government taxation policy be designed to ensure that revenue is collected from SME without taxing them so
heavily that they are unable to grow. Thus this study seeks and suggests ways and means in which taxes can be
levied on SME, without subjecting them to the tax rates of large corporations which may diminish SME
profitability.
Objective of the Study
 To find out the effects of government taxation policy on sales revenue of SME in Kenya
II. LITERATURE REVIEW
Effects of Tax Policy on Sales Revenue of SME : The majority of SME are concentrated in the service and
commercial sectors. Therefore sales revenue is the lifeblood of such enterprises. However, such firms can only
maintain sales at a high level by minimizing their operational costs, as was explained in the preceding section. If
a large proportion of SME costs are devoted to paying tax, they will be forced to shift the tax burden onto the
consumer, and this will ultimately make their goods and services uncompetitive, which will have a negative
impact on their performance and growth. The impact of high taxes on sales revenue is demonstrated by the
program of import substitution which was adopted in Kenya after independence (Republic of Kenya, 2006). The
tax regime under import substitution was a protectionist policy, intended to promote local businesses, including
SME, to produce essential goods instead of importing them. However, import substitution had a number of
unforeseen consequences, including the creation and sustaining of an anti-export bias, due to high tariff
structures and import controls that encouraged importation of inputs even where the same could be sourced
locally. This was because, ironically, import substitution sought to boost local production, yet the local cost of
capital equipment was very high (due to taxation) which forced SME to import equipment, contrary to the goals
of the program.
In addition, the import substitution process focused exclusively on producing goods for domestic
consumption, and completely ignored the importance of export markets. Indeed, the post-independence period
was characterized by high export taxes that discouraged exports and stifled economic activity. From the
foregoing it is evident that tax policy actually does have a significant effect on the sales revenue of SME. By
levying high taxes on exports and on the cost of locally procured capital equipment, local firms (including SME)
were unable to generate enough sales to facilitate their growth, leading to a slump in the SME sector, forcing it
to operate in informal channels to guarantee a level of sales turnover that would guarantee survival. The import
substitution program is credited with the successful industrialization of sub-sectors producing consumer
products such as textiles and garments, food and beverages and tobacco that became the leading manufactured
goods during the import substitution period of 1963 to 1989. From an SME standpoint the import substitution
program adversely affected sales revenue, as high taxation made the business environment hostile to SME.
Consequently, the firms which benefitted the most from the program were large corporations which were
capable of handling the tax requirements. The reluctance of SME in Kenya to formalize can partly be attributed
to the tax policies instituted under export substitution (Republic of Kenya, 2006)..
The long term effects of high taxation under import substitution also affected the sales revenue of large
corporations. Some of these effects included oversaturation of the corporate sector, with a corresponding
underdevelopment of SME, creating a gap between the largest corporations and the smallest microenterprises.
New SME are doing their best to fill this entrepreneurship gap, but tax policies that are inimical to the
generation and retention of sales revenue are forcing many of them to remain in the informal economy. Another
consequence of tax policies that limited sales revenues was that there was lack of impetus among firms, large
and small alike, to move the industrialization process beyond import substitution. This was because the high
taxation had diminished sales revenue to such an extent that firms did not have the capacity to seek export
markets, and even if they did look for markets beyond borders, they would still be hampered by high export
taxes, which would eat into their sales revenues even further. This state of affairs resulted in polarization of the
economy between the extremes of very large and very small enterprises. These two kinds of enterprises had
nothing in common, and thus the development of complementary working relationships and linkages between
corporations and Small and Medium Enterprises did not take place. The current status of the manufacturing
sector can attest to this, as it is completely dominated by large corporations, and SME are simply nonexistent. In
Effects of government taxation policy on sales...
www.ijbmi.org 31 | Page
the commercial and services sectors SME are coming up, but they avoid formalization and incorporation due to
the strain placed on their sales revenue by tax policy strictures. The absence of SME in certain sectors results in
inefficiency, high production costs and monopolistic practices, which lead to price fixing. Any SME that
attempt to compete in such a market will be unable to generate the sales revenue that they require in order to
grow (Republic of Kenya, 2006)..Finally, it is worth mentioning that SME taxpayers under the current system
of taxation are discriminated against, since the compliance requirements, cost of compliance and tax rate are the
same for both SME as well as large enterprises. Modifying the taxation rate for SME in addition to reducing the
compliance costs increases the sales revenues and profit margins of SME. It also increases the Government‟s
tax revenue, since simplified tax provisions SME historically reduce the size of the informal economy and the
number of non- complying registered taxpayers (Vasak, 2008).
Conceptual Framework
Figure 2:1 Hypothesised factors affecting sales revenue of medium sized enterprises
Independent variable Dependent variable
Source: Author Construct
This study put emphasis on the relationships between government taxation on Sales revenue of SMEs
in Kenya.
III. METHODOLOGY
Research Design : While carrying out the study, the researcher employed explanatory research design.
Explanatory study is referred to as studies that establish casual relationship between variables. Explanatory
research most often preceded by explanatory and descriptive research and the emphasis is basically on studying
a situation or a problem in order to explain the relationships between the variables. (Saunders, Lewis, Thornhill,
2007). Explanatory or a causal study is aimed at ascertaining causal relationship between variables i.e. the
relationship between government tax policy, growth and the profitability of SMEs. Since the study involves
collecting the opinions of respondents concerning a particular issue, given the above stated attributes,
explanatory research design was adopted in this study in order to establish relationship between government tax
policy, growth and the profitability of SMEs between 2009 and 2011.
Target Population :A population consists of all elements-individuals, items, or object-whose characteristics are
being studied. The population that is being studied is also called the target population. The population refers to
the group of people or study subjects who are similar in one or more ways and which forms the subject of the
study in a particular survey (Kerlinger, 2003). The target population in this research covers all SME in Uasin
Gishu County. Of all Kenya biggest city in terms of numbers of SMEs, labor force, industrial outputs, trading
and service volumes (Central Bureau of Statistics, 2010). In general, SMEs in the County may be viewed as
representative of SMEs in the country. Therefore, the target population of this study comprises of 1785 SMEs
operators mainly drawn from services (685) and manufacturing (1100) and 2 officials from the Ministry of trade
and Uasin Gishu County. This is shown in the table 1.
Government Taxation Policy
 Income Tax Policy
 Value Added Tax policy
Sales revenue
 Presumptive Tax Policy
Effects of government taxation policy on sales...
www.ijbmi.org 32 | Page
Table 1 Target population
Strata Target population
Manufacturing industry 1100
Services industry 685
Officers from the Ministry of trade 2
TOTAL 1787
Source: Uasin Gishu County in 2012
Sampling Size and Techniques : Sampling is a procedure of selecting a part of population on which research can
be conducted, which ensures that conclusions from the study can be generalized to the entire population. The
sampling criteria for this study includes the following: the SMEs is either a service or production enterprise; the
operations should involve the employment of a minimum of 20 workers; the SMEs operations must be using
power and equipment in its operation and the company must be located in Uasin Gishu County and the SMEs
must be using locally sourced raw materials as its major input. The sample size was determined using table for
determining sample size from a given population by (Krejcie and Morgan , 1970). The researcher made use of
stratified random and simple random sampling. Stratified random sampling is the process of selecting a sample
in such a way that identified subgroups in the population are represented in the sample in the same proportion as
they exist in the population (Frankel, et al, 2000), while a simple random sample is one in which each and every
member of the population has an equal and independent chance of being selected as a respondent (Frankel, et al,
2000). From the 1885 SMEs, a sample size of 188 respondents was chosen from each of the strata whereby the
target population was divided into strata, and samples of 10% of each stratum were selected. This ensured that
all the strata within the study area were included in the study and thus taking into consideration the socio-
economic dynamics of the area by spreading the sample in the whole Uasin Gishu County. Therefore in order to
arrive at a statistically valid conclusion, the researcher administered at least 180 questionnaires.
Table 2 Sample size of respondents
Strata Target population Ratio % Sample Size
SMEs (manufacturing) 1100 10 /100 110
SMEs (services) 685 10 /100 68
Officers from ministry of trade 2 2
TOTAL 1787 180
Source: Uasin Gishu County in 2012
Data Collection Instrument : The study data for the study were generated from both primary and secondary
sources. Primary data were obtained using questionnaires, personal interviews and document analysis.
Secondary sources includes: internet, textbooks, government publications, journals, libraries, archives and
government offices among others. The study is both quantitative (Questionnaire and qualitative (interview
schedule and document analysis) data. The study used the triangulation method of data collection, which usually
involves the use of two or more research instruments to collect the necessary data. This is because no single
method of data collection is perfect in itself (Okuni and Tembe, 1997).
Data Collection Methods : Data collection was conducted using questionnaire, personal interviews and
document analysis as the main data collection tool. The questions were subdivided into sections to capture the
response and details that were required. The researcher collected data from the selected respondents after
receiving permission from the Washington International University authority and government of Kenya to carry
out research in the identified area of study. The researcher before collecting data from the participant informed
the Director of each SME in advance and sought for an appointment to enable data collection. After
familiarization, data was then collected from the respondents using the three mentioned instruments. The service
of research assistant was sought to assist in the collection of the questionnaires from the respondents, while the
researcher personally distributed the questionnaire. The completed instruments were verified and collected from
the respondents within a period of fifteen days from the day of distribution. Validity and Reliability of the
Instruments : Reliability of research instruments were used to construct reliable measurement scales, to improve
existing scales, and to appraise the reliability of scales already in use. In particular, reliability aided in the design
and assessment of sum scales, that is, scales that are made up of multiple individual measurements. The
assessment of scale reliability was based on the correlations between the measurements that make up the scale,
relative to the variances of the items. In this context the definition of reliability is straightforward: a
Effects of government taxation policy on sales...
www.ijbmi.org 33 | Page
measurement is reliable if it reflects mostly true score, relative to the error. In this study, the items were
considered reliable when they yielded a reliability coefficient of 0.50 and above. This figure is usually
considered respectable and desirable for consistency levels (Koul, 2002). However, the Cronbach’s coefficient
the research instruments are not reliable and the researcher should make necessary corrections before using the
instruments to collect data. In addition, the reliability was established through the pilot-test whereby some items
were either added or dropped to enable modification of the instrument. The interview schedules were pilot tested
by using two directors of the SME within Uasin Gishu County. This was intended to establish the construct
validity of the schedules. Validity refers to the level at which a test measures what the instruments actually wish
to measure. The question on how government taxation policy affecting the profitability and growth of small and
medium enterprises in Huruma Estate, Uasin Gishu County, Kenya will be validated by adopting (Yin, 2003)
solution for validity. This includes use of multiple sources of information, to establish a chain of evidence, and
to have key informants review the report. Also, multiple sources of information will be used in the form of three
kinds of sources: literature review on previous empirical research, primary data in the form of interviews with
SME within Uasin Gishu County, Kenya and researcher direct observation. In order to perform this technique
several respondents will be asked to comment on some of the conclusions.
II. DATAANALYSIS
The data were analyzed statistically using correlation analysis, descriptive and percentage analysis
methods. The analysis was undertaken to establish the degree of relationships between some pertinent factors
and issues as well as to show the relative size or significance of each factor relative to the others. Specifically,
correlation analysis was used to test hypotheses and show the extent of relationship between taxation policy and
the sales revenue of SME; Multiple regression as a statistical technique was used to examine the way a number
of independent variables relate to one dependent variable. The Multiple Regressions Analysis was used to
determine the relationship between independent and dependent variables. The coefficient of multiple
correlations is symbolized by the correlation R which indicates the strength of the correlation between the
combination of the predictor variables and criteria variables. The analytical model for this research, which was
developed and justified in the literature review, and which ultimately, provides structure to the empirical
analysis. This analytical schema represented the model of the relationship between government tax policy and
sales revenue of SMEs. The model demonstrated how SME sales revenue is expected to be influenced by
government taxation policy. The following regression model was expressed in mathematical notation as follows:
Y= β0 + β1X1+ ε
Where Y = Government taxation policy X1= Sales revenue of SME
β= Beta.
ε = Error term
V: RESULTS AND DISCUSSION
Sales Revenue
Six items were proposed to measure the effect of government taxation policy on sales revenue of SMEs. Two
factors were extracted and accounted for up to 58.69% of the total variance explained. The Kauser –Meyer –
Olkin (0.641) and Bartlett‟s test sphericity (p<0.0001) indicated that data were adequate for factor analysis. All
factor loadings were above 0.60. The reliability coefficient for the five items extracted was 0.701 which shows
that the five items were reliable in measuring effect of taxation policy on sales revenue. Table 3 presents results
of the factor analysis of effects of taxation policy on sales revenue.
Table 3: Exploratory Factor Analysis Results for effect of Taxation Policy on Sales Revenue
Constructs and scales Loading Eigenvalues Cum.
Variance
Explained
Effect of Taxation on Sales Revenue .701* 2.443 40.721
Factor1
The regressive nature of taxes on SME reduces .805
their revenue base
Effects of government taxation policy on sales...
www.ijbmi.org 34 | Page
The uncertainty of taxes paid by SMEs interferes .833
with their inventory cycles hence breaks and
jumps in their tax Government taxation policy
on SME does not consider much the scale of
operation hence adversely affects their sales
revenue
Factor2 .626 1.078 58.690
Most SMEs do not hold portfolio in their .730
operations and are thus prone to higher risks of
taxation and hence weak sales revenue
Taxation policy fails to deal with pricing aspects .820
and hence does not focus on selling price of
SMEs and lowers sales revenue
Kaiser-Meyer-Olkin MSA: .641
Bartlett’s test of S .000
* Reliability coefficient (Cronbach‟s Alpha)
Normality of the study variables. : Statistical methods were used to examine the normality distribution of the
independent and dependent variable using SPSS. The statistical method used was the Shapiro- Wilk test. It was
used because of its versatility for small samples as well as samples sizes as large as 2000. Consequently, the test
was used to identify variables that significantly deviate from a normal distribution. As suggested by Hair et al
(2006), Significant values of the Shapiro –Wilk test greater than 0.05 indicated that the data was normally
distributed. As shown in Table 4, all the variables were normally distributed since the significant values were all
above 0.05.
Table 4: Tests of Normality
Kolmogorov-Smirnova
Shapiro-Wilk
Statistic df Sig. Statistic df Sig.
Sales Revenue .148 165 .221 .918 165 .235
a. Lilliefors Significance Correction
Sample demographic profile :The demographic characteristics analyzed for the sample of respondents
included gender, age, marital status, education level, family size, and business experience. Table 4.12 presents
summary statistics of these characteristics.
Background characteristics of the sample SMEs :Respondents were asked to provide background
characteristics pertaining to their businesses. These characteristics included; ownership, management, annual
turnover, number of employees, and range of asset size. Table 5 shows background characteristics of the sample
SMEs.
Table 5: Background Characteristics of the Sample Businesses
f %
Ownership of business partnership 10 5.8%
company 7 4.1%
sole proprietorship 155 90.1%
co-operative 0 .0%
Effects of government taxation policy on sales...
www.ijbmi.org 35 | Page
self-help group 0 .0%
Business management owner 155 90.1%
manager 7 4.1%
partners 10 5.8%
committee members 0 .0%
director 0 .0%
Annual turnover less than Ksh 10million 172 100.0%
10-100m 0 .0%
100-200m 0 .0%
over 200m 0 .0%
Number of employees less than 10 171 99.4%
10-49 1 .6%
59-199 0 .0%
over 200 0 .0%
Range of asset size less than Ksh 10million 172 100.0%
10-100m 0 .0%
100-200m 0 .0%
over 200m 0 .0%
Results shown in table 4.13 indicate that a majority of the business were sole proprietorships (90%). Most of the
business were owner managed (90.1%) with an annual turnover of less than Ksh. 10 million. Over 99% of the
business had less than 10 employees and all the sampled businesses had an asset size less than Ksh. 10 million.
4.5 Descriptive statistics of the study variables
Means and standard deviations of the independent variables were obtained. The purpose was to gauge
respondents’ compliance with government taxation policy as well as to obtain a general picture of the prevailing
status of SMEs in terms of sales revenue.
4.5.1 Respondents compliance with government taxation policy
Compliance with government taxation policy was treated as the independent variable in the present study. Three
dimensions were used to measure compliance with government taxation policy. Five items were used to
measure compliance with income tax, seven items were used to measure compliance with VAT policy, and four
items were used to measure compliance with presumptive tax policy. The responses to the items were elicited
using a 5point Likert scale.
Compliance with income tax policy
Respondents appeared to be complying with income taxation policy basing on their mean response to most
items as well as the smaller values in variations. In particular, respondents tended to agree that SMEs have
information on how much tax, where to pay and mode of payment (M=4.29, SD=0.527); that tax payable is
economical to SMEs. They however tended to disagree that SMEs pay tax when it is convenient for them to pay
(M=1.81, SD=0.975).
Compliance with VAT policy
Regarding compliance with VAT, respondents were in agreement with most items regarding compliance. They
agreed that the businesses usually charged VAT on all goods and services purchased (M=4.23, SD = 0.930); that
VAT was usually levied on part or full payment of suppliers (M=4.14, SD= 0.790); that they had VAT
compliance certificates (M=3.72, SD=1.083); that they have never been penalized for failure to submit VAT
returns (M=4.03, SD= 0.930); that most of them had installed the ETR machines ( M=4.08, SD=0.798); and that
the businesses maintain up-to date business records at all times. This means that the respondents lacked
consensus regarding this particular item.
Compliance with presumptive tax policy
On presumptive tax, respondents were particularly keen to comply with its policy. This is because as presented
in Table 4.14, most respondents found the mode of taxation under presumptive taxation quite favourable to
them.
Effects of government taxation policy on sales...
www.ijbmi.org 36 | Page
In particular, respondents strongly agreed that non requirement of returns filing under presumptive tax was an
incentive to them (M=4.59, SD=0.560); they agreed that elaborate business records are not necessary (M=4.10,
SD=0.886); that payments of levies is straight forward hence the business does not hire professional consultancy
services. Hence allows for momentary closures of business (M= 4.10, SD= 0.947). The means and standard
deviations of the independent variables of SMEs compliance with government taxation policy in terms of
operational costs, sales revenue, asset accumulation, and returns on capital were presented in Table 6 below.
Table 6: Perceived Compliance with Government Taxation Policy
Std.
Mean Deviation
Income Tax Policy
SMEs have information on how much tax, when to pay tax,
where to pay and mode of tax payment 4.29 .527
SMEs pay tax when it is convenient for them to pay 1.81 .975
The tax payable is economical to SMEs 4.33 .942
The government either increases or decreases tax rate at its own 4.44 .623
discretion
There are diverse taxes imposed on SMEs 4.01 .725
VAT Policy
The business usually charges VAT on all goods and services to
the purchaser 4.23 .920
We normally charge VAT whenever we issue a certificate in
respect of services 4.33 .733
VAT is usually levied on part or full payment of our supplies 4.14 .790
The business has a VAT compliance certificate 3.72 1.083
The business has never been penalized for failure to submit VAT 4.03 .930
returns
The business has complied with VAT requirements by installing
an ETR machine 4.08 .798
The business maintains up-to-date business records at all times 4.30 .891
Presumptive Tax Policy
Non requirement of returns filing is an incentive 4.59 .560
Elaborate business records are not necessary 4.10 .886
Payment of levies is straight forward hence the business does not
hire professional consultancy services 4.21 .677
Levies are only charged when the business is operating. Hence
allows for momentary closures of business
4.10 .947
Perceived Effects of Government Taxation Policy on Sales Revenue : Respondents’ perceptions of effects of
government taxation policy on SME sales revenue were measured using five items. The mean responses to all
the items were approximately 4 indicating that most of the respondents perceived government taxation policy to
have an adverse effect on their sales revenue. In particular, respondents agreed that the regressive nature of taxes
on SME reduces their revenue base m=4.09, SD = 0.804), that the uncertainty of taxes paid by SMEs Interferes
with their inventory cycles leading to breaks and jumps in their tax remittances and reduced revenue base (
M=4.30, SD= 0.89); that most SMEs do not hold portfolio in their operations and are thus prove to higher risks
of taxation leading to weak sales revenue (M=4.56, SD=0.563); that government taxation policy on SME does
Effects of government taxation policy on sales...
www.ijbmi.org 37 | Page
not consider much the scale of operation and this adversely affects their sales revenue (M= 4.06, SD =0.866);
and that taxation policy fails to deal with pricing aspects meaning that it does not focus on selling price of SME
thereby lowering sales revenue (M=4.26, SD=0.746). As depicted in Table 7. Largest variation was 0.891 while
the smallest was 0.563 which confirms that the taxation policy is viewed negatively in as far as sales revenue is
concerned.
Table 7: Perceived Effect of Government Taxation Policy on SME Sales Revenue
Std.
Mean Deviation
The regressive nature of taxes on SME reduces their revenue 4.09 .804
base
The uncertainty of taxes paid by SMEs interferes with their 4.30 .891
inventory cycles hence breaks and jumps in their tax
remittances and reduced revenue base
Most SMEs do not hold portfolio in their operations and are 4.56 .563
thus prone to higher risks of taxation and hence weak sales
revenue
Government taxation policy on SME does not consider much 4.06 .866
the scale of operation hence adversely affects their sales
revenue
Taxation policy fails to deal with pricing aspects and hence 4.26 .746
does not focus on selling price of SMEs and lowers sales
revenue
Assumptions of linearity : The strength of linear relationship among variables was assessed using Pearson
product moment correlation. Correlation was used since being a measure of the degree of association; it was
likely to identify independent variable dimensions that provide best predictions. As shown in Table 8,
correlation among the three government taxation policy dimensions (Income tax, VAT, presumptive tax) were
significant and ranged from r= 0.271) (p<0.01) to r= 0.378 (p<0.001). Correlation between sales revenue and
VAT policy (r= -0.125, p> 0.05) and between sales revenue and presumptive tax policy (r= 0.114, p> 0.05).
Thus linearity assumptions were satisfied.
Table 8: Intercorrelation Matrix
Income
Tax VAT Presumptive Sales
policy Policy Tax Policy Revenue
Income Tax 1
policy
VAT Policy .271**
1
Presumptive .378**
.280**
1
Tax Policy
Sales .153*
-.125 -.016 1
Revenue
**. Correlation is significant at the 0.01 level (2-tailed). *.
Correlation is significant at the 0.05 level (2-tailed).
Effects of government taxation policy on sales...
www.ijbmi.org 38 | Page
Assumptions of independence of Errors : The Durban-Watson statistic was used to examine if prediction of
dependence errors were correlated. As presented in Table 4.20, The Durban –Watson statistics for the
regressions of sales revenue (1.897), was within the 1.50 and 2.50 interval suggested by Tabachunck and Fidell
(2001), the errors were adjusted to be uncorrelated. The assumption of independence of errors was therefore
met.
Testing the effect of government taxation policy on sales revenue of SMEs : The study sought to
establish the effect of government taxation policy on sales revenue of SMEs. It was therefore postulated that
there was no significant statistical relationship between government taxation policy (income tax, VAT and
presumptive tax) and sales revenue of SME. Results of the hierarchical regression analysis are presented in
Table 9.
Table 9: Results of regression analysis: Effect of Government Taxation Policy on Profitability and
Growth of SMEs
Operational costs
Predictors Sales revenue
Model1 Model2 Model1 Model2
Std. Std. Std. Std.
Step1:
Controls
Management .042 .044 -.035 -.023
Employment .084 .078 -.035 -.059
Step2:
Tax. Policy
Income .129 -.217*
VAT .309** -.160*
Presumptive -.206* .341**
R2 .010 .183 .003 .055
Adjusted R2
.002 .158 -.009 .0.026
R2
.010 .173 .003 .0.052
F-value
0.828 11.669** 0.230 3.019*
Durbin- 2.487 1.897
Watson
**p<0.01, *p<0.05
From table 9, it is seen that both management of the business and number of the employees had no significant
effect on operational costs (R2 value = 0.013). On adding the government taxation policy variables, the R2 value
=
0.013). On adding the government taxation policy variables, the R2 of
operational costs increased to 0.183
indicating that the three dimensions of government taxation policy contributed an additional 17.3% to the
variance in operational costs. Similarly, the R2
of sales revenue increased to 0.055 showing that the three
dimensions of government taxation policy contributed an additional 5.2% to the variance in sales revenue. The
R2
of asset accumulation increased to 0.082 meaning that government taxation policy contributed an additional
7.1% to the variance in asset accumulation. The R2
of return on capital increased to 0.079 indicating that
government taxation policy contributed an additional 6.7% to the variance in return on capital.
Effects of government taxation policy on sales...
www.ijbmi.org 39 | Page
Of the three government taxation policy dimensions, income tax policy was found to be negatively and
significantly-0.217,p<0.05) and related asset accumulation ((β-0.245,= p<0.01). It was also positively and
significantly related to return on capital (β -0=.192, p<0.05). However, it had no significant relationship with
operational and significantly related to on capital (β =0.156, significantly p<0.05) related it to sales was net
revenue (=-0.160, p<0.05), but was not significantly related to asset accumulation (=0.059, p=0.05).
Presumptive tax policy had positive and significant relationships with sales revenue (=0.341), p=0.01); asset
accumulation (=0.311, p=0.01); and return on capital (=-.264, p=0.01). It however had a negative
relationship with operational costs (=-0.206, p<0.05).
The researcher (Table 9) concluded therefore that government taxation policy had a significant impact on
profitability and growth of SMEs through positive and negative effects on profit and growth dimensions
(operational costs, sales revenue, asset accumulation, return on capital).
Summary of Hypothesis Testing Results
Results of the hypothesis testing are presented in Table 10. The results indicated that the four hypotheses were
statistically significant.
Hypothesis 1: Sales revenue is independent of government taxation policy
Hypothesis 2 tested the effect of government taxation policy (Income tax policy, VAT policy, and presumptive
tax policy) on sales revenue of SMEs. The standardized coefficients for Income tax (=0.217, p<0.01) were all
statistically significant. This shows that the hypothesis was not supported. The standardized coefficient of -
0.217 for income tax implies that a 1% increase in income tax policy is likely to reduce sales revenue by
0.217%; similarly, the negative coefficient of -0.160 for VAT means that a 1% increase in VAT is likely to
reduce sales revenue by 0.160%. The positive coefficient for presumptive tax of 0.341 indicates that a 1%
increase in presumptive tax policy is likely to increase sales revenue by 0.341%.
Table 10: Summary of Hypotheses Testing
Hypothesis β-value Result
Ho2 Sales revenue is independent of government -0.217* Not supported
taxation policy: Income tax policy -0.160* Not supported
VAT policy 0.341** Not supported
Presumptive tax policy
VAT policy
Presumptive tax policy
**p<0.01, *p<0.05
III. CONCLUSION AND RECOMMENDATION
The study sought to establish the relationship between government taxation policy on sales revenue of
SMEs in Kenya. the study has pointed out demography information of the respondents, Kenya. From the
findings of the study, the R2 of sales revenue increased to 0.055 showing that the three dimensions of
government taxation policy contributed an additional 5.2% to the variance in sales revenue. The researcher
concluded therefore that government taxation policy had a significant impact on sales revenue of SMEs that is
positive and negative effects. Small and Medium Enterprises should be levied lower amounts of taxes so that
they will have enough funds for other activities that will lead to business growth and profitability. Additionally
it will help SMEs get better equipped to survive in a competitive market.
IV. ACKNOWLEDGEMENT
First and foremost my sincere gratitude goes to the almighty God for the gift of life, health, wisdom, and
strength that He granted me during the time of undertaking this study. I also extend my gratitude to Ondimu Eric
Monayo and Philip Oogah Monayo (Research Consultants) who worked with me to make this work a success.
Finally, i acknowledge the efforts of Janet Nyamisa Ogoti (Editor) for her outstanding services in editing this
journal. May God Bless You All.
Effects of government taxation policy on sales...
www.ijbmi.org 40 | Page
REFERENCES
[1]. Holban. O.I., (2007). The Taxation of Small and Medium-Sized Enterprises-a Hindering Factor Influencing the European
Economic Growth. Doctoral dissertation, Alexandru Ioan Cuza University of Iasi and Academy of Economies Studies from
Bucharest Romania.
[2]. Kerlinger, F., (2003). Foundations of Behavioral Research. New Delhi: Sarjeet Publishers
[3]. Krejcie R.V and Morgan D.W. (1970). Determining Sample Size for Research Activities Educational and Psychological
Measurement, 30, 608,
[4]. Sage Publishers. Saunders, M., Lewis, P. & Thornhill, A. (2007). Research methods for business for Students: 4th edition. Pearson
Education Limited Artes Graficas.
[5]. Tomlin, B. (2008). Clearing hurdles: key reforms to make small businesses more successful. (Commentary No. 264). Toronto,
Ontario C.D. Howe Institute. Retrieved from www.cdhowe.org/pdf/commentary
[6]. Vasak, S. (2008). Small, medium, and large enterprises. USAID Business Climate Reform. Retrieved from http://pdf.usaid.gov/pdf
Yin, R.K. (2003). Case Study Research Design and methods: 3rd edition. Sage publications: thousand Oaks.

More Related Content

What's hot

Causal relationship between government tax revenue growth and economic growth...
Causal relationship between government tax revenue growth and economic growth...Causal relationship between government tax revenue growth and economic growth...
Causal relationship between government tax revenue growth and economic growth...Alexander Decker
 
Assessing the Macroeconomic Impact of Structural Reforms
Assessing the Macroeconomic Impact of Structural ReformsAssessing the Macroeconomic Impact of Structural Reforms
Assessing the Macroeconomic Impact of Structural ReformsAbu Musa Nsamba
 
Determinants of tax compliance behavior in ethiopia the case of bahir dar cit...
Determinants of tax compliance behavior in ethiopia the case of bahir dar cit...Determinants of tax compliance behavior in ethiopia the case of bahir dar cit...
Determinants of tax compliance behavior in ethiopia the case of bahir dar cit...Alexander Decker
 
Tax system in nigeria – challenges and the way forward
Tax system in nigeria – challenges and the way forwardTax system in nigeria – challenges and the way forward
Tax system in nigeria – challenges and the way forwardAlexander Decker
 
Welfare In India (Pratik Negi)
Welfare In India (Pratik Negi)Welfare In India (Pratik Negi)
Welfare In India (Pratik Negi)pratik negi
 
Policy interventions and economic benefits for a market driven oil palm industry
Policy interventions and economic benefits for a market driven oil palm industryPolicy interventions and economic benefits for a market driven oil palm industry
Policy interventions and economic benefits for a market driven oil palm industryAlexander Decker
 
Taxation and the informal sector
Taxation and the informal sectorTaxation and the informal sector
Taxation and the informal sectorDr Lendy Spires
 
The Most Challenging Economy in Decades
The Most Challenging Economy in DecadesThe Most Challenging Economy in Decades
The Most Challenging Economy in DecadesQamar Farooq
 
The value added tax and sales tax in ethiopia
The value added tax and sales tax in ethiopiaThe value added tax and sales tax in ethiopia
The value added tax and sales tax in ethiopiaAlexander Decker
 
Financing for development impact
Financing for development impactFinancing for development impact
Financing for development impactmuhammadsarimimran
 

What's hot (19)

Causal relationship between government tax revenue growth and economic growth...
Causal relationship between government tax revenue growth and economic growth...Causal relationship between government tax revenue growth and economic growth...
Causal relationship between government tax revenue growth and economic growth...
 
Assessing the Macroeconomic Impact of Structural Reforms
Assessing the Macroeconomic Impact of Structural ReformsAssessing the Macroeconomic Impact of Structural Reforms
Assessing the Macroeconomic Impact of Structural Reforms
 
Pakistan's pursuit of economic reforms
Pakistan's pursuit of economic reformsPakistan's pursuit of economic reforms
Pakistan's pursuit of economic reforms
 
Economic Policies By Talha Lodhi
Economic Policies By Talha LodhiEconomic Policies By Talha Lodhi
Economic Policies By Talha Lodhi
 
Determinants of tax compliance behavior in ethiopia the case of bahir dar cit...
Determinants of tax compliance behavior in ethiopia the case of bahir dar cit...Determinants of tax compliance behavior in ethiopia the case of bahir dar cit...
Determinants of tax compliance behavior in ethiopia the case of bahir dar cit...
 
final research
final researchfinal research
final research
 
Boe 2
Boe 2Boe 2
Boe 2
 
Tax system in nigeria – challenges and the way forward
Tax system in nigeria – challenges and the way forwardTax system in nigeria – challenges and the way forward
Tax system in nigeria – challenges and the way forward
 
D2123442
D2123442D2123442
D2123442
 
Welfare In India (Pratik Negi)
Welfare In India (Pratik Negi)Welfare In India (Pratik Negi)
Welfare In India (Pratik Negi)
 
CARICOM - Regional Industrial Policy - Perspective And Issues
CARICOM - Regional Industrial Policy - Perspective And IssuesCARICOM - Regional Industrial Policy - Perspective And Issues
CARICOM - Regional Industrial Policy - Perspective And Issues
 
Policy interventions and economic benefits for a market driven oil palm industry
Policy interventions and economic benefits for a market driven oil palm industryPolicy interventions and economic benefits for a market driven oil palm industry
Policy interventions and economic benefits for a market driven oil palm industry
 
Taxation and the informal sector
Taxation and the informal sectorTaxation and the informal sector
Taxation and the informal sector
 
The Most Challenging Economy in Decades
The Most Challenging Economy in DecadesThe Most Challenging Economy in Decades
The Most Challenging Economy in Decades
 
The value added tax and sales tax in ethiopia
The value added tax and sales tax in ethiopiaThe value added tax and sales tax in ethiopia
The value added tax and sales tax in ethiopia
 
2 ojeka stephen a
2 ojeka stephen a2 ojeka stephen a
2 ojeka stephen a
 
Ey006
Ey006Ey006
Ey006
 
Examining the Effect of Tax Authority Regulation and Administration on Volunt...
Examining the Effect of Tax Authority Regulation and Administration on Volunt...Examining the Effect of Tax Authority Regulation and Administration on Volunt...
Examining the Effect of Tax Authority Regulation and Administration on Volunt...
 
Financing for development impact
Financing for development impactFinancing for development impact
Financing for development impact
 

Viewers also liked

Ми проти торгівлі людьми
Ми проти торгівлі людьмиМи проти торгівлі людьми
Ми проти торгівлі людьмиRoman Vasilchik
 
Youngest group newsletter 11.8
Youngest group newsletter 11.8Youngest group newsletter 11.8
Youngest group newsletter 11.8el9360
 
DAGCertificate.PDF
DAGCertificate.PDFDAGCertificate.PDF
DAGCertificate.PDFKumar Gaurav
 
Ми проти торгівлі людьми
Ми проти торгівлі людьмиМи проти торгівлі людьми
Ми проти торгівлі людьмиRoman Vasilchik
 
Merging paramedic performance and service quality. An empirical test of an in...
Merging paramedic performance and service quality. An empirical test of an in...Merging paramedic performance and service quality. An empirical test of an in...
Merging paramedic performance and service quality. An empirical test of an in...inventionjournals
 
22 03 2014 Conmemoración del Día Mundial del Agua
22 03 2014 Conmemoración del Día Mundial del Agua22 03 2014 Conmemoración del Día Mundial del Agua
22 03 2014 Conmemoración del Día Mundial del AguaOrganización política
 
Historia de la computadora ♥
Historia de la computadora ♥Historia de la computadora ♥
Historia de la computadora ♥ChuchitoZorro12
 
Constanza leon-psicopedagogia-nivel200-diurna-slidershare
Constanza leon-psicopedagogia-nivel200-diurna-slidershareConstanza leon-psicopedagogia-nivel200-diurna-slidershare
Constanza leon-psicopedagogia-nivel200-diurna-slidershareconstanzaleongaray
 
Museo memoria y tolerancia2
Museo memoria y tolerancia2Museo memoria y tolerancia2
Museo memoria y tolerancia2Diana611
 
Etude Apec - Le marché de l'emploi cadre dans les activités informatiques - n...
Etude Apec - Le marché de l'emploi cadre dans les activités informatiques - n...Etude Apec - Le marché de l'emploi cadre dans les activités informatiques - n...
Etude Apec - Le marché de l'emploi cadre dans les activités informatiques - n...Apec
 
Single Or Multiple Sourcing: A Mathematical Approach To Decision Making
Single Or Multiple Sourcing: A Mathematical Approach To Decision MakingSingle Or Multiple Sourcing: A Mathematical Approach To Decision Making
Single Or Multiple Sourcing: A Mathematical Approach To Decision Makinginventionjournals
 
Vancouver conventioncentre floorplansbrochure_pdf_2015
Vancouver conventioncentre floorplansbrochure_pdf_2015Vancouver conventioncentre floorplansbrochure_pdf_2015
Vancouver conventioncentre floorplansbrochure_pdf_2015Vasudevan KR
 

Viewers also liked (20)

Ми проти торгівлі людьми
Ми проти торгівлі людьмиМи проти торгівлі людьми
Ми проти торгівлі людьми
 
Zach Resume 2015
Zach Resume 2015Zach Resume 2015
Zach Resume 2015
 
Easy life
Easy lifeEasy life
Easy life
 
Youngest group newsletter 11.8
Youngest group newsletter 11.8Youngest group newsletter 11.8
Youngest group newsletter 11.8
 
DAGCertificate.PDF
DAGCertificate.PDFDAGCertificate.PDF
DAGCertificate.PDF
 
Ми проти торгівлі людьми
Ми проти торгівлі людьмиМи проти торгівлі людьми
Ми проти торгівлі людьми
 
Horno Teka HR 550
Horno Teka HR 550Horno Teka HR 550
Horno Teka HR 550
 
Merging paramedic performance and service quality. An empirical test of an in...
Merging paramedic performance and service quality. An empirical test of an in...Merging paramedic performance and service quality. An empirical test of an in...
Merging paramedic performance and service quality. An empirical test of an in...
 
22 03 2014 Conmemoración del Día Mundial del Agua
22 03 2014 Conmemoración del Día Mundial del Agua22 03 2014 Conmemoración del Día Mundial del Agua
22 03 2014 Conmemoración del Día Mundial del Agua
 
Historia de la computadora ♥
Historia de la computadora ♥Historia de la computadora ♥
Historia de la computadora ♥
 
Constanza leon-psicopedagogia-nivel200-diurna-slidershare
Constanza leon-psicopedagogia-nivel200-diurna-slidershareConstanza leon-psicopedagogia-nivel200-diurna-slidershare
Constanza leon-psicopedagogia-nivel200-diurna-slidershare
 
Main street
Main streetMain street
Main street
 
Museo memoria y tolerancia2
Museo memoria y tolerancia2Museo memoria y tolerancia2
Museo memoria y tolerancia2
 
Humedales de Ventanilla y Puya de Raimondi
Humedales de Ventanilla y Puya de RaimondiHumedales de Ventanilla y Puya de Raimondi
Humedales de Ventanilla y Puya de Raimondi
 
Conte tema 6
Conte tema 6Conte tema 6
Conte tema 6
 
Etude Apec - Le marché de l'emploi cadre dans les activités informatiques - n...
Etude Apec - Le marché de l'emploi cadre dans les activités informatiques - n...Etude Apec - Le marché de l'emploi cadre dans les activités informatiques - n...
Etude Apec - Le marché de l'emploi cadre dans les activités informatiques - n...
 
Single Or Multiple Sourcing: A Mathematical Approach To Decision Making
Single Or Multiple Sourcing: A Mathematical Approach To Decision MakingSingle Or Multiple Sourcing: A Mathematical Approach To Decision Making
Single Or Multiple Sourcing: A Mathematical Approach To Decision Making
 
Giselladuarte psicopedagogia-nivel200
Giselladuarte psicopedagogia-nivel200Giselladuarte psicopedagogia-nivel200
Giselladuarte psicopedagogia-nivel200
 
Vancouver conventioncentre floorplansbrochure_pdf_2015
Vancouver conventioncentre floorplansbrochure_pdf_2015Vancouver conventioncentre floorplansbrochure_pdf_2015
Vancouver conventioncentre floorplansbrochure_pdf_2015
 
Resume munir
Resume munirResume munir
Resume munir
 

Similar to Effects of government taxation policy on sales revenue of SME in Uasin Gishu County, Kenya

FACTORS AFFECTING TAX COMPLIANCE AMONG SMALL AND MEDIUM ENTERPRISES IN KITALE...
FACTORS AFFECTING TAX COMPLIANCE AMONG SMALL AND MEDIUM ENTERPRISES IN KITALE...FACTORS AFFECTING TAX COMPLIANCE AMONG SMALL AND MEDIUM ENTERPRISES IN KITALE...
FACTORS AFFECTING TAX COMPLIANCE AMONG SMALL AND MEDIUM ENTERPRISES IN KITALE...paperpublications3
 
Determinants of Tax Compliances among SMEs in Mwanza Region
Determinants of Tax Compliances among SMEs in Mwanza RegionDeterminants of Tax Compliances among SMEs in Mwanza Region
Determinants of Tax Compliances among SMEs in Mwanza RegionAI Publications
 
The Effect of Tax Payment on the Performance of SMEs: The Case of Selected SM...
The Effect of Tax Payment on the Performance of SMEs: The Case of Selected SM...The Effect of Tax Payment on the Performance of SMEs: The Case of Selected SM...
The Effect of Tax Payment on the Performance of SMEs: The Case of Selected SM...Evans Tee
 
Research report impact of multiple taxation
Research report  impact of multiple taxationResearch report  impact of multiple taxation
Research report impact of multiple taxationJawad Ahmed
 
public presentation.pptx
public presentation.pptxpublic presentation.pptx
public presentation.pptxmaleehashahzad
 
Increasing tax revenue in sub-Saharan Africa: The case of Kenya
Increasing tax revenue in sub-Saharan Africa: The case of KenyaIncreasing tax revenue in sub-Saharan Africa: The case of Kenya
Increasing tax revenue in sub-Saharan Africa: The case of KenyaDr Lendy Spires
 
Effect of vat and tax on economy an analysis in the context of bangladesh.
Effect of vat and tax on economy an analysis in the context of bangladesh.Effect of vat and tax on economy an analysis in the context of bangladesh.
Effect of vat and tax on economy an analysis in the context of bangladesh.Alexander Decker
 
Customs and tax reforms effect on manufacturing aqnd retail sectors in matebe...
Customs and tax reforms effect on manufacturing aqnd retail sectors in matebe...Customs and tax reforms effect on manufacturing aqnd retail sectors in matebe...
Customs and tax reforms effect on manufacturing aqnd retail sectors in matebe...Alexander Decker
 
Revenue Implications of Nigeria’s Tax System in Nigeria
Revenue Implications of Nigeria’s Tax System in NigeriaRevenue Implications of Nigeria’s Tax System in Nigeria
Revenue Implications of Nigeria’s Tax System in NigeriaMoses Oduh
 
Ekeocha revenue implications of nigeria's tax system
Ekeocha revenue implications of nigeria's tax systemEkeocha revenue implications of nigeria's tax system
Ekeocha revenue implications of nigeria's tax systemAlexander Decker
 
BUILDING A SUSTAINABLE TAX-BASE TO CONTAIN FISCAL DEFICITS
BUILDING A SUSTAINABLE TAX-BASE TO CONTAIN FISCAL DEFICITSBUILDING A SUSTAINABLE TAX-BASE TO CONTAIN FISCAL DEFICITS
BUILDING A SUSTAINABLE TAX-BASE TO CONTAIN FISCAL DEFICITSKingstone Pumula Kanyile
 
Taxation, Private Fixed Domestic investment Behaviour and Zimbabwe’s Economic...
Taxation, Private Fixed Domestic investment Behaviour and Zimbabwe’s Economic...Taxation, Private Fixed Domestic investment Behaviour and Zimbabwe’s Economic...
Taxation, Private Fixed Domestic investment Behaviour and Zimbabwe’s Economic...AJHSSR Journal
 
1 THE EFFECT OF TAXATION ON BUSINESS DECISION (A CASE STUDY OF AL-BABELLO TRA...
1 THE EFFECT OF TAXATION ON BUSINESS DECISION (A CASE STUDY OF AL-BABELLO TRA...1 THE EFFECT OF TAXATION ON BUSINESS DECISION (A CASE STUDY OF AL-BABELLO TRA...
1 THE EFFECT OF TAXATION ON BUSINESS DECISION (A CASE STUDY OF AL-BABELLO TRA...Sabrina Baloi
 
A Longitudinal Analysis Of Tax Planning Schemes Of Firms In East Africa
A Longitudinal Analysis Of Tax Planning Schemes Of Firms In East AfricaA Longitudinal Analysis Of Tax Planning Schemes Of Firms In East Africa
A Longitudinal Analysis Of Tax Planning Schemes Of Firms In East AfricaTye Rausch
 
Tax justice from 100 years old income tax law.pdf
Tax justice from 100 years old income tax law.pdfTax justice from 100 years old income tax law.pdf
Tax justice from 100 years old income tax law.pdfM S Siddiqui
 

Similar to Effects of government taxation policy on sales revenue of SME in Uasin Gishu County, Kenya (20)

FACTORS AFFECTING TAX COMPLIANCE AMONG SMALL AND MEDIUM ENTERPRISES IN KITALE...
FACTORS AFFECTING TAX COMPLIANCE AMONG SMALL AND MEDIUM ENTERPRISES IN KITALE...FACTORS AFFECTING TAX COMPLIANCE AMONG SMALL AND MEDIUM ENTERPRISES IN KITALE...
FACTORS AFFECTING TAX COMPLIANCE AMONG SMALL AND MEDIUM ENTERPRISES IN KITALE...
 
Determinants of Tax Compliances among SMEs in Mwanza Region
Determinants of Tax Compliances among SMEs in Mwanza RegionDeterminants of Tax Compliances among SMEs in Mwanza Region
Determinants of Tax Compliances among SMEs in Mwanza Region
 
The Effect of Tax Payment on the Performance of SMEs: The Case of Selected SM...
The Effect of Tax Payment on the Performance of SMEs: The Case of Selected SM...The Effect of Tax Payment on the Performance of SMEs: The Case of Selected SM...
The Effect of Tax Payment on the Performance of SMEs: The Case of Selected SM...
 
Research report impact of multiple taxation
Research report  impact of multiple taxationResearch report  impact of multiple taxation
Research report impact of multiple taxation
 
public presentation.pptx
public presentation.pptxpublic presentation.pptx
public presentation.pptx
 
Increasing tax revenue in sub-Saharan Africa: The case of Kenya
Increasing tax revenue in sub-Saharan Africa: The case of KenyaIncreasing tax revenue in sub-Saharan Africa: The case of Kenya
Increasing tax revenue in sub-Saharan Africa: The case of Kenya
 
Effect of vat and tax on economy an analysis in the context of bangladesh.
Effect of vat and tax on economy an analysis in the context of bangladesh.Effect of vat and tax on economy an analysis in the context of bangladesh.
Effect of vat and tax on economy an analysis in the context of bangladesh.
 
Customs and tax reforms effect on manufacturing aqnd retail sectors in matebe...
Customs and tax reforms effect on manufacturing aqnd retail sectors in matebe...Customs and tax reforms effect on manufacturing aqnd retail sectors in matebe...
Customs and tax reforms effect on manufacturing aqnd retail sectors in matebe...
 
Revenue Implications of Nigeria’s Tax System in Nigeria
Revenue Implications of Nigeria’s Tax System in NigeriaRevenue Implications of Nigeria’s Tax System in Nigeria
Revenue Implications of Nigeria’s Tax System in Nigeria
 
Ekeocha revenue implications of nigeria's tax system
Ekeocha revenue implications of nigeria's tax systemEkeocha revenue implications of nigeria's tax system
Ekeocha revenue implications of nigeria's tax system
 
BUILDING A SUSTAINABLE TAX-BASE TO CONTAIN FISCAL DEFICITS
BUILDING A SUSTAINABLE TAX-BASE TO CONTAIN FISCAL DEFICITSBUILDING A SUSTAINABLE TAX-BASE TO CONTAIN FISCAL DEFICITS
BUILDING A SUSTAINABLE TAX-BASE TO CONTAIN FISCAL DEFICITS
 
Public economics
Public economicsPublic economics
Public economics
 
Public economics
Public economicsPublic economics
Public economics
 
Taxation, Private Fixed Domestic investment Behaviour and Zimbabwe’s Economic...
Taxation, Private Fixed Domestic investment Behaviour and Zimbabwe’s Economic...Taxation, Private Fixed Domestic investment Behaviour and Zimbabwe’s Economic...
Taxation, Private Fixed Domestic investment Behaviour and Zimbabwe’s Economic...
 
1 THE EFFECT OF TAXATION ON BUSINESS DECISION (A CASE STUDY OF AL-BABELLO TRA...
1 THE EFFECT OF TAXATION ON BUSINESS DECISION (A CASE STUDY OF AL-BABELLO TRA...1 THE EFFECT OF TAXATION ON BUSINESS DECISION (A CASE STUDY OF AL-BABELLO TRA...
1 THE EFFECT OF TAXATION ON BUSINESS DECISION (A CASE STUDY OF AL-BABELLO TRA...
 
Kenyan Business Environment Survey 2014
Kenyan Business Environment Survey 2014Kenyan Business Environment Survey 2014
Kenyan Business Environment Survey 2014
 
A Longitudinal Analysis Of Tax Planning Schemes Of Firms In East Africa
A Longitudinal Analysis Of Tax Planning Schemes Of Firms In East AfricaA Longitudinal Analysis Of Tax Planning Schemes Of Firms In East Africa
A Longitudinal Analysis Of Tax Planning Schemes Of Firms In East Africa
 
Evolution 1991
Evolution 1991Evolution 1991
Evolution 1991
 
Tax justice from 100 years old income tax law.pdf
Tax justice from 100 years old income tax law.pdfTax justice from 100 years old income tax law.pdf
Tax justice from 100 years old income tax law.pdf
 
Private Enterprise in Pakistan
Private Enterprise in Pakistan Private Enterprise in Pakistan
Private Enterprise in Pakistan
 

Recently uploaded

Factors-Influencing-Branding-Strategies.pptx
Factors-Influencing-Branding-Strategies.pptxFactors-Influencing-Branding-Strategies.pptx
Factors-Influencing-Branding-Strategies.pptxVikasTiwari846641
 
Netflix Ads The Game Changer in Video Ads – Who Needs YouTube.pptx (Chester Y...
Netflix Ads The Game Changer in Video Ads – Who Needs YouTube.pptx (Chester Y...Netflix Ads The Game Changer in Video Ads – Who Needs YouTube.pptx (Chester Y...
Netflix Ads The Game Changer in Video Ads – Who Needs YouTube.pptx (Chester Y...ChesterYang6
 
CALL ON ➥8923113531 🔝Call Girls Hazratganj Lucknow best sexual service Online
CALL ON ➥8923113531 🔝Call Girls Hazratganj Lucknow best sexual service OnlineCALL ON ➥8923113531 🔝Call Girls Hazratganj Lucknow best sexual service Online
CALL ON ➥8923113531 🔝Call Girls Hazratganj Lucknow best sexual service Onlineanilsa9823
 
How to Leverage Behavioral Science Insights for Direct Mail Success
How to Leverage Behavioral Science Insights for Direct Mail SuccessHow to Leverage Behavioral Science Insights for Direct Mail Success
How to Leverage Behavioral Science Insights for Direct Mail SuccessAggregage
 
What is Google Search Console and What is it provide?
What is Google Search Console and What is it provide?What is Google Search Console and What is it provide?
What is Google Search Console and What is it provide?riteshhsociall
 
Digital-Marketing-Into-by-Zoraiz-Ahmad.pptx
Digital-Marketing-Into-by-Zoraiz-Ahmad.pptxDigital-Marketing-Into-by-Zoraiz-Ahmad.pptx
Digital-Marketing-Into-by-Zoraiz-Ahmad.pptxZACGaming
 
Labour Day Celebrating Workers and Their Contributions.pptx
Labour Day Celebrating Workers and Their Contributions.pptxLabour Day Celebrating Workers and Their Contributions.pptx
Labour Day Celebrating Workers and Their Contributions.pptxelizabethella096
 
Local SEO Domination: Put your business at the forefront of local searches!
Local SEO Domination:  Put your business at the forefront of local searches!Local SEO Domination:  Put your business at the forefront of local searches!
Local SEO Domination: Put your business at the forefront of local searches!dstvtechnician
 
Social Media Marketing PPT-Includes Paid media
Social Media Marketing PPT-Includes Paid mediaSocial Media Marketing PPT-Includes Paid media
Social Media Marketing PPT-Includes Paid mediaadityabelde2
 
Branding strategies of new company .pptx
Branding strategies of new company .pptxBranding strategies of new company .pptx
Branding strategies of new company .pptxVikasTiwari846641
 
How to utilize calculated properties in your HubSpot setups
How to utilize calculated properties in your HubSpot setupsHow to utilize calculated properties in your HubSpot setups
How to utilize calculated properties in your HubSpot setupsssuser4571da
 
Unraveling the Mystery of The Circleville Letters.pptx
Unraveling the Mystery of The Circleville Letters.pptxUnraveling the Mystery of The Circleville Letters.pptx
Unraveling the Mystery of The Circleville Letters.pptxelizabethella096
 
Publuu Demo Presentation Brochure Online
Publuu Demo Presentation Brochure OnlinePubluu Demo Presentation Brochure Online
Publuu Demo Presentation Brochure OnlinePubluu
 
Google 3rd-Party Cookie Deprecation [Update] + 5 Best Strategies
Google 3rd-Party Cookie Deprecation [Update] + 5 Best StrategiesGoogle 3rd-Party Cookie Deprecation [Update] + 5 Best Strategies
Google 3rd-Party Cookie Deprecation [Update] + 5 Best StrategiesSearch Engine Journal
 

Recently uploaded (20)

No Cookies No Problem - Steve Krull, Be Found Online
No Cookies No Problem - Steve Krull, Be Found OnlineNo Cookies No Problem - Steve Krull, Be Found Online
No Cookies No Problem - Steve Krull, Be Found Online
 
Factors-Influencing-Branding-Strategies.pptx
Factors-Influencing-Branding-Strategies.pptxFactors-Influencing-Branding-Strategies.pptx
Factors-Influencing-Branding-Strategies.pptx
 
Top 5 Breakthrough AI Innovations Elevating Content Creation and Personalizat...
Top 5 Breakthrough AI Innovations Elevating Content Creation and Personalizat...Top 5 Breakthrough AI Innovations Elevating Content Creation and Personalizat...
Top 5 Breakthrough AI Innovations Elevating Content Creation and Personalizat...
 
Netflix Ads The Game Changer in Video Ads – Who Needs YouTube.pptx (Chester Y...
Netflix Ads The Game Changer in Video Ads – Who Needs YouTube.pptx (Chester Y...Netflix Ads The Game Changer in Video Ads – Who Needs YouTube.pptx (Chester Y...
Netflix Ads The Game Changer in Video Ads – Who Needs YouTube.pptx (Chester Y...
 
Brand Strategy Master Class - Juntae DeLane
Brand Strategy Master Class - Juntae DeLaneBrand Strategy Master Class - Juntae DeLane
Brand Strategy Master Class - Juntae DeLane
 
CALL ON ➥8923113531 🔝Call Girls Hazratganj Lucknow best sexual service Online
CALL ON ➥8923113531 🔝Call Girls Hazratganj Lucknow best sexual service OnlineCALL ON ➥8923113531 🔝Call Girls Hazratganj Lucknow best sexual service Online
CALL ON ➥8923113531 🔝Call Girls Hazratganj Lucknow best sexual service Online
 
How to Leverage Behavioral Science Insights for Direct Mail Success
How to Leverage Behavioral Science Insights for Direct Mail SuccessHow to Leverage Behavioral Science Insights for Direct Mail Success
How to Leverage Behavioral Science Insights for Direct Mail Success
 
What is Google Search Console and What is it provide?
What is Google Search Console and What is it provide?What is Google Search Console and What is it provide?
What is Google Search Console and What is it provide?
 
Digital-Marketing-Into-by-Zoraiz-Ahmad.pptx
Digital-Marketing-Into-by-Zoraiz-Ahmad.pptxDigital-Marketing-Into-by-Zoraiz-Ahmad.pptx
Digital-Marketing-Into-by-Zoraiz-Ahmad.pptx
 
Labour Day Celebrating Workers and Their Contributions.pptx
Labour Day Celebrating Workers and Their Contributions.pptxLabour Day Celebrating Workers and Their Contributions.pptx
Labour Day Celebrating Workers and Their Contributions.pptx
 
Local SEO Domination: Put your business at the forefront of local searches!
Local SEO Domination:  Put your business at the forefront of local searches!Local SEO Domination:  Put your business at the forefront of local searches!
Local SEO Domination: Put your business at the forefront of local searches!
 
Creator Influencer Strategy Master Class - Corinne Rose Guirgis
Creator Influencer Strategy Master Class - Corinne Rose GuirgisCreator Influencer Strategy Master Class - Corinne Rose Guirgis
Creator Influencer Strategy Master Class - Corinne Rose Guirgis
 
Social Media Marketing PPT-Includes Paid media
Social Media Marketing PPT-Includes Paid mediaSocial Media Marketing PPT-Includes Paid media
Social Media Marketing PPT-Includes Paid media
 
Branding strategies of new company .pptx
Branding strategies of new company .pptxBranding strategies of new company .pptx
Branding strategies of new company .pptx
 
The Future of Brands on LinkedIn - Alison Kaltman
The Future of Brands on LinkedIn - Alison KaltmanThe Future of Brands on LinkedIn - Alison Kaltman
The Future of Brands on LinkedIn - Alison Kaltman
 
Generative AI Master Class - Generative AI, Unleash Creative Opportunity - Pe...
Generative AI Master Class - Generative AI, Unleash Creative Opportunity - Pe...Generative AI Master Class - Generative AI, Unleash Creative Opportunity - Pe...
Generative AI Master Class - Generative AI, Unleash Creative Opportunity - Pe...
 
How to utilize calculated properties in your HubSpot setups
How to utilize calculated properties in your HubSpot setupsHow to utilize calculated properties in your HubSpot setups
How to utilize calculated properties in your HubSpot setups
 
Unraveling the Mystery of The Circleville Letters.pptx
Unraveling the Mystery of The Circleville Letters.pptxUnraveling the Mystery of The Circleville Letters.pptx
Unraveling the Mystery of The Circleville Letters.pptx
 
Publuu Demo Presentation Brochure Online
Publuu Demo Presentation Brochure OnlinePubluu Demo Presentation Brochure Online
Publuu Demo Presentation Brochure Online
 
Google 3rd-Party Cookie Deprecation [Update] + 5 Best Strategies
Google 3rd-Party Cookie Deprecation [Update] + 5 Best StrategiesGoogle 3rd-Party Cookie Deprecation [Update] + 5 Best Strategies
Google 3rd-Party Cookie Deprecation [Update] + 5 Best Strategies
 

Effects of government taxation policy on sales revenue of SME in Uasin Gishu County, Kenya

  • 1. International Journal of Business and Management Invention ISSN (Online): 2319 – 8028, ISSN (Print): 2319 – 801X www.ijbmi.org || Volume 4 Issue 2 || February. 2015 || PP.29-40 www.ijbmi.org 29 | Page Effects of government taxation policy on sales revenue of SME in Uasin Gishu County, Kenya 1 Isaac Kipchirchir Kamar 1 Deputy Director (Administration and Finance), Kisii University Eldoret Campus 1 BA (Kenyatta University), MBA Strategic Management (Kisii University), PhD (Cont.)Entrepreneurship and Innovation (Kisii University) ABSTRACT: In Kenya, SME provide source of employment creation, innovation, competition, economic dynamism which eventually lead to poverty alleviation and national growth. Government taxation policy is one of the factors that constitute the SMEs‟ economic surroundings. This study sought to find out the effects of government taxation policy on sales revenue of SME in Kenya and particularly Uasin Gishu County. In order to achieve the purpose of this study, the specific research objective was addressed: to find out the effects of government taxation policy on sales revenue of SME. The data for this study was collected from primary and secondary sources. While the research instruments were questionnaire, interview and document analysis, the study population comprised of staff and management of SME within Uasin Gishu County, Kenya who formed the sample for the study. The explanatory research design was employed in the study. The samples for the study were selected using stratified random and simple random sampling methods. The data from the research instruments were coded and analyzed using the SPSS. Descriptive statistics, frequency tables, percentages, mean and standard deviation were used to present the data, while Correlation was used to test the hypotheses. Results of the study found statistically significant relationships between the three dimensions of government taxation policy and sales revenue. The researcher concluded therefore that government taxation policy had a significant impact on sales revenue of SMEs. KEY WORDS: Taxation policy, Profitability, Growth I. INTRODUCTION Background Information : Taxation policy towards SME is an important issue because SME are a significant segment of the economy, despite being individually smaller in size than larger firms. In addition, they improve the standard of living of a majority of the population. Therefore, revenue authorities have to take all of the above features into account when establishing the components of taxation policy that are associated with SME. Despite the vibrancy of SME, they have a major negative characteristic: they often have an extremely short life span. Some of the factors that lead to the winding down of SME soon after their inception are tax related, including multiple taxation and enormous tax burdens. The perception of SME by policy makers often fails to acknowledge their significance as a mechanism of economic growth and development. Regarding SME as insignificant enterprises that have no impact on the economy is an oversight that can no longer be justified. This is because SME merely require a favorable regulatory environment in which to conduct business, and they will demonstrate their potential for profitability and growth. Thus they need to be granted a measure of flexibility in taxation which will allow them to maximize their potential. The profitability and growth of SME can be assessed through the parameters of sales revenue, asset accumulation, and returns on capital, therefore it is important to find out the effect that taxation policy has on them. According to (Holban, 2007), taxation can contribute to development and to welfare through three sources; by generating sufficient funds for financing public services and social transfers at a high level of quality, by offering incentive for more employment and for an efficient and lasting use of natural resources, and by reallocation of income. However, this has to be balanced against the requirements of SME income and their need for survival. Without sufficient profitability, SME growth will be rendered impossible. Therefore, any prospective tax policy will have to evaluate the factors that encourage non-compliance with tax obligation by SME. Although it has been acknowledged that taxation is a constraint on the productivity and growth of SME, this does not mean that SME should not pay tax. Without tax revenue, governments will be unable to facilitate the environment in which SME thrive, therefore it is in SME own best interest to pay taxes. The government has to collect revenue in order to finance its expenditure. Income obtained from taxation of individuals and businesses is used to run governments and to build and maintain infrastructure such as good roads, water supply, and electricity which are essential for the smooth running of businesses. With the above in mind, the goal of the current study sought to determine the importance of government taxation policy on profitability of SME.
  • 2. Effects of government taxation policy on sales... www.ijbmi.org 30 | Page Statement of the Problem : Taxation is the lifeblood of government, as it provides the revenues which go towards ensuring that government is able to fulfill its role of maintaining law and order and facilitating trade and industry, among other duties. SME and taxation are not mutually exclusive by any means. Yet it has been noted, in previous studies (Tomlin, 2008) that SME sacrifice funds to pay taxes, which could otherwise be invested in business growth. This dilemma is at the crux of the issue under investigation in this study, which is: how can government taxation policy be designed to ensure that revenue is collected from SME without taxing them so heavily that they are unable to grow. Thus this study seeks and suggests ways and means in which taxes can be levied on SME, without subjecting them to the tax rates of large corporations which may diminish SME profitability. Objective of the Study  To find out the effects of government taxation policy on sales revenue of SME in Kenya II. LITERATURE REVIEW Effects of Tax Policy on Sales Revenue of SME : The majority of SME are concentrated in the service and commercial sectors. Therefore sales revenue is the lifeblood of such enterprises. However, such firms can only maintain sales at a high level by minimizing their operational costs, as was explained in the preceding section. If a large proportion of SME costs are devoted to paying tax, they will be forced to shift the tax burden onto the consumer, and this will ultimately make their goods and services uncompetitive, which will have a negative impact on their performance and growth. The impact of high taxes on sales revenue is demonstrated by the program of import substitution which was adopted in Kenya after independence (Republic of Kenya, 2006). The tax regime under import substitution was a protectionist policy, intended to promote local businesses, including SME, to produce essential goods instead of importing them. However, import substitution had a number of unforeseen consequences, including the creation and sustaining of an anti-export bias, due to high tariff structures and import controls that encouraged importation of inputs even where the same could be sourced locally. This was because, ironically, import substitution sought to boost local production, yet the local cost of capital equipment was very high (due to taxation) which forced SME to import equipment, contrary to the goals of the program. In addition, the import substitution process focused exclusively on producing goods for domestic consumption, and completely ignored the importance of export markets. Indeed, the post-independence period was characterized by high export taxes that discouraged exports and stifled economic activity. From the foregoing it is evident that tax policy actually does have a significant effect on the sales revenue of SME. By levying high taxes on exports and on the cost of locally procured capital equipment, local firms (including SME) were unable to generate enough sales to facilitate their growth, leading to a slump in the SME sector, forcing it to operate in informal channels to guarantee a level of sales turnover that would guarantee survival. The import substitution program is credited with the successful industrialization of sub-sectors producing consumer products such as textiles and garments, food and beverages and tobacco that became the leading manufactured goods during the import substitution period of 1963 to 1989. From an SME standpoint the import substitution program adversely affected sales revenue, as high taxation made the business environment hostile to SME. Consequently, the firms which benefitted the most from the program were large corporations which were capable of handling the tax requirements. The reluctance of SME in Kenya to formalize can partly be attributed to the tax policies instituted under export substitution (Republic of Kenya, 2006).. The long term effects of high taxation under import substitution also affected the sales revenue of large corporations. Some of these effects included oversaturation of the corporate sector, with a corresponding underdevelopment of SME, creating a gap between the largest corporations and the smallest microenterprises. New SME are doing their best to fill this entrepreneurship gap, but tax policies that are inimical to the generation and retention of sales revenue are forcing many of them to remain in the informal economy. Another consequence of tax policies that limited sales revenues was that there was lack of impetus among firms, large and small alike, to move the industrialization process beyond import substitution. This was because the high taxation had diminished sales revenue to such an extent that firms did not have the capacity to seek export markets, and even if they did look for markets beyond borders, they would still be hampered by high export taxes, which would eat into their sales revenues even further. This state of affairs resulted in polarization of the economy between the extremes of very large and very small enterprises. These two kinds of enterprises had nothing in common, and thus the development of complementary working relationships and linkages between corporations and Small and Medium Enterprises did not take place. The current status of the manufacturing sector can attest to this, as it is completely dominated by large corporations, and SME are simply nonexistent. In
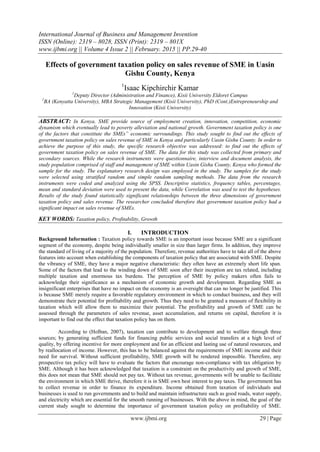
  • 3. Effects of government taxation policy on sales... www.ijbmi.org 31 | Page the commercial and services sectors SME are coming up, but they avoid formalization and incorporation due to the strain placed on their sales revenue by tax policy strictures. The absence of SME in certain sectors results in inefficiency, high production costs and monopolistic practices, which lead to price fixing. Any SME that attempt to compete in such a market will be unable to generate the sales revenue that they require in order to grow (Republic of Kenya, 2006)..Finally, it is worth mentioning that SME taxpayers under the current system of taxation are discriminated against, since the compliance requirements, cost of compliance and tax rate are the same for both SME as well as large enterprises. Modifying the taxation rate for SME in addition to reducing the compliance costs increases the sales revenues and profit margins of SME. It also increases the Government‟s tax revenue, since simplified tax provisions SME historically reduce the size of the informal economy and the number of non- complying registered taxpayers (Vasak, 2008). Conceptual Framework Figure 2:1 Hypothesised factors affecting sales revenue of medium sized enterprises Independent variable Dependent variable Source: Author Construct This study put emphasis on the relationships between government taxation on Sales revenue of SMEs in Kenya. III. METHODOLOGY Research Design : While carrying out the study, the researcher employed explanatory research design. Explanatory study is referred to as studies that establish casual relationship between variables. Explanatory research most often preceded by explanatory and descriptive research and the emphasis is basically on studying a situation or a problem in order to explain the relationships between the variables. (Saunders, Lewis, Thornhill, 2007). Explanatory or a causal study is aimed at ascertaining causal relationship between variables i.e. the relationship between government tax policy, growth and the profitability of SMEs. Since the study involves collecting the opinions of respondents concerning a particular issue, given the above stated attributes, explanatory research design was adopted in this study in order to establish relationship between government tax policy, growth and the profitability of SMEs between 2009 and 2011. Target Population :A population consists of all elements-individuals, items, or object-whose characteristics are being studied. The population that is being studied is also called the target population. The population refers to the group of people or study subjects who are similar in one or more ways and which forms the subject of the study in a particular survey (Kerlinger, 2003). The target population in this research covers all SME in Uasin Gishu County. Of all Kenya biggest city in terms of numbers of SMEs, labor force, industrial outputs, trading and service volumes (Central Bureau of Statistics, 2010). In general, SMEs in the County may be viewed as representative of SMEs in the country. Therefore, the target population of this study comprises of 1785 SMEs operators mainly drawn from services (685) and manufacturing (1100) and 2 officials from the Ministry of trade and Uasin Gishu County. This is shown in the table 1. Government Taxation Policy  Income Tax Policy  Value Added Tax policy Sales revenue  Presumptive Tax Policy
  • 4. Effects of government taxation policy on sales... www.ijbmi.org 32 | Page Table 1 Target population Strata Target population Manufacturing industry 1100 Services industry 685 Officers from the Ministry of trade 2 TOTAL 1787 Source: Uasin Gishu County in 2012 Sampling Size and Techniques : Sampling is a procedure of selecting a part of population on which research can be conducted, which ensures that conclusions from the study can be generalized to the entire population. The sampling criteria for this study includes the following: the SMEs is either a service or production enterprise; the operations should involve the employment of a minimum of 20 workers; the SMEs operations must be using power and equipment in its operation and the company must be located in Uasin Gishu County and the SMEs must be using locally sourced raw materials as its major input. The sample size was determined using table for determining sample size from a given population by (Krejcie and Morgan , 1970). The researcher made use of stratified random and simple random sampling. Stratified random sampling is the process of selecting a sample in such a way that identified subgroups in the population are represented in the sample in the same proportion as they exist in the population (Frankel, et al, 2000), while a simple random sample is one in which each and every member of the population has an equal and independent chance of being selected as a respondent (Frankel, et al, 2000). From the 1885 SMEs, a sample size of 188 respondents was chosen from each of the strata whereby the target population was divided into strata, and samples of 10% of each stratum were selected. This ensured that all the strata within the study area were included in the study and thus taking into consideration the socio- economic dynamics of the area by spreading the sample in the whole Uasin Gishu County. Therefore in order to arrive at a statistically valid conclusion, the researcher administered at least 180 questionnaires. Table 2 Sample size of respondents Strata Target population Ratio % Sample Size SMEs (manufacturing) 1100 10 /100 110 SMEs (services) 685 10 /100 68 Officers from ministry of trade 2 2 TOTAL 1787 180 Source: Uasin Gishu County in 2012 Data Collection Instrument : The study data for the study were generated from both primary and secondary sources. Primary data were obtained using questionnaires, personal interviews and document analysis. Secondary sources includes: internet, textbooks, government publications, journals, libraries, archives and government offices among others. The study is both quantitative (Questionnaire and qualitative (interview schedule and document analysis) data. The study used the triangulation method of data collection, which usually involves the use of two or more research instruments to collect the necessary data. This is because no single method of data collection is perfect in itself (Okuni and Tembe, 1997). Data Collection Methods : Data collection was conducted using questionnaire, personal interviews and document analysis as the main data collection tool. The questions were subdivided into sections to capture the response and details that were required. The researcher collected data from the selected respondents after receiving permission from the Washington International University authority and government of Kenya to carry out research in the identified area of study. The researcher before collecting data from the participant informed the Director of each SME in advance and sought for an appointment to enable data collection. After familiarization, data was then collected from the respondents using the three mentioned instruments. The service of research assistant was sought to assist in the collection of the questionnaires from the respondents, while the researcher personally distributed the questionnaire. The completed instruments were verified and collected from the respondents within a period of fifteen days from the day of distribution. Validity and Reliability of the Instruments : Reliability of research instruments were used to construct reliable measurement scales, to improve existing scales, and to appraise the reliability of scales already in use. In particular, reliability aided in the design and assessment of sum scales, that is, scales that are made up of multiple individual measurements. The assessment of scale reliability was based on the correlations between the measurements that make up the scale, relative to the variances of the items. In this context the definition of reliability is straightforward: a
  • 5. Effects of government taxation policy on sales... www.ijbmi.org 33 | Page measurement is reliable if it reflects mostly true score, relative to the error. In this study, the items were considered reliable when they yielded a reliability coefficient of 0.50 and above. This figure is usually considered respectable and desirable for consistency levels (Koul, 2002). However, the Cronbach’s coefficient the research instruments are not reliable and the researcher should make necessary corrections before using the instruments to collect data. In addition, the reliability was established through the pilot-test whereby some items were either added or dropped to enable modification of the instrument. The interview schedules were pilot tested by using two directors of the SME within Uasin Gishu County. This was intended to establish the construct validity of the schedules. Validity refers to the level at which a test measures what the instruments actually wish to measure. The question on how government taxation policy affecting the profitability and growth of small and medium enterprises in Huruma Estate, Uasin Gishu County, Kenya will be validated by adopting (Yin, 2003) solution for validity. This includes use of multiple sources of information, to establish a chain of evidence, and to have key informants review the report. Also, multiple sources of information will be used in the form of three kinds of sources: literature review on previous empirical research, primary data in the form of interviews with SME within Uasin Gishu County, Kenya and researcher direct observation. In order to perform this technique several respondents will be asked to comment on some of the conclusions. II. DATAANALYSIS The data were analyzed statistically using correlation analysis, descriptive and percentage analysis methods. The analysis was undertaken to establish the degree of relationships between some pertinent factors and issues as well as to show the relative size or significance of each factor relative to the others. Specifically, correlation analysis was used to test hypotheses and show the extent of relationship between taxation policy and the sales revenue of SME; Multiple regression as a statistical technique was used to examine the way a number of independent variables relate to one dependent variable. The Multiple Regressions Analysis was used to determine the relationship between independent and dependent variables. The coefficient of multiple correlations is symbolized by the correlation R which indicates the strength of the correlation between the combination of the predictor variables and criteria variables. The analytical model for this research, which was developed and justified in the literature review, and which ultimately, provides structure to the empirical analysis. This analytical schema represented the model of the relationship between government tax policy and sales revenue of SMEs. The model demonstrated how SME sales revenue is expected to be influenced by government taxation policy. The following regression model was expressed in mathematical notation as follows: Y= β0 + β1X1+ ε Where Y = Government taxation policy X1= Sales revenue of SME β= Beta. ε = Error term V: RESULTS AND DISCUSSION Sales Revenue Six items were proposed to measure the effect of government taxation policy on sales revenue of SMEs. Two factors were extracted and accounted for up to 58.69% of the total variance explained. The Kauser –Meyer – Olkin (0.641) and Bartlett‟s test sphericity (p<0.0001) indicated that data were adequate for factor analysis. All factor loadings were above 0.60. The reliability coefficient for the five items extracted was 0.701 which shows that the five items were reliable in measuring effect of taxation policy on sales revenue. Table 3 presents results of the factor analysis of effects of taxation policy on sales revenue. Table 3: Exploratory Factor Analysis Results for effect of Taxation Policy on Sales Revenue Constructs and scales Loading Eigenvalues Cum. Variance Explained Effect of Taxation on Sales Revenue .701* 2.443 40.721 Factor1 The regressive nature of taxes on SME reduces .805 their revenue base
  • 6. Effects of government taxation policy on sales... www.ijbmi.org 34 | Page The uncertainty of taxes paid by SMEs interferes .833 with their inventory cycles hence breaks and jumps in their tax Government taxation policy on SME does not consider much the scale of operation hence adversely affects their sales revenue Factor2 .626 1.078 58.690 Most SMEs do not hold portfolio in their .730 operations and are thus prone to higher risks of taxation and hence weak sales revenue Taxation policy fails to deal with pricing aspects .820 and hence does not focus on selling price of SMEs and lowers sales revenue Kaiser-Meyer-Olkin MSA: .641 Bartlett’s test of S .000 * Reliability coefficient (Cronbach‟s Alpha) Normality of the study variables. : Statistical methods were used to examine the normality distribution of the independent and dependent variable using SPSS. The statistical method used was the Shapiro- Wilk test. It was used because of its versatility for small samples as well as samples sizes as large as 2000. Consequently, the test was used to identify variables that significantly deviate from a normal distribution. As suggested by Hair et al (2006), Significant values of the Shapiro –Wilk test greater than 0.05 indicated that the data was normally distributed. As shown in Table 4, all the variables were normally distributed since the significant values were all above 0.05. Table 4: Tests of Normality Kolmogorov-Smirnova Shapiro-Wilk Statistic df Sig. Statistic df Sig. Sales Revenue .148 165 .221 .918 165 .235 a. Lilliefors Significance Correction Sample demographic profile :The demographic characteristics analyzed for the sample of respondents included gender, age, marital status, education level, family size, and business experience. Table 4.12 presents summary statistics of these characteristics. Background characteristics of the sample SMEs :Respondents were asked to provide background characteristics pertaining to their businesses. These characteristics included; ownership, management, annual turnover, number of employees, and range of asset size. Table 5 shows background characteristics of the sample SMEs. Table 5: Background Characteristics of the Sample Businesses f % Ownership of business partnership 10 5.8% company 7 4.1% sole proprietorship 155 90.1% co-operative 0 .0%
  • 7. Effects of government taxation policy on sales... www.ijbmi.org 35 | Page self-help group 0 .0% Business management owner 155 90.1% manager 7 4.1% partners 10 5.8% committee members 0 .0% director 0 .0% Annual turnover less than Ksh 10million 172 100.0% 10-100m 0 .0% 100-200m 0 .0% over 200m 0 .0% Number of employees less than 10 171 99.4% 10-49 1 .6% 59-199 0 .0% over 200 0 .0% Range of asset size less than Ksh 10million 172 100.0% 10-100m 0 .0% 100-200m 0 .0% over 200m 0 .0% Results shown in table 4.13 indicate that a majority of the business were sole proprietorships (90%). Most of the business were owner managed (90.1%) with an annual turnover of less than Ksh. 10 million. Over 99% of the business had less than 10 employees and all the sampled businesses had an asset size less than Ksh. 10 million. 4.5 Descriptive statistics of the study variables Means and standard deviations of the independent variables were obtained. The purpose was to gauge respondents’ compliance with government taxation policy as well as to obtain a general picture of the prevailing status of SMEs in terms of sales revenue. 4.5.1 Respondents compliance with government taxation policy Compliance with government taxation policy was treated as the independent variable in the present study. Three dimensions were used to measure compliance with government taxation policy. Five items were used to measure compliance with income tax, seven items were used to measure compliance with VAT policy, and four items were used to measure compliance with presumptive tax policy. The responses to the items were elicited using a 5point Likert scale. Compliance with income tax policy Respondents appeared to be complying with income taxation policy basing on their mean response to most items as well as the smaller values in variations. In particular, respondents tended to agree that SMEs have information on how much tax, where to pay and mode of payment (M=4.29, SD=0.527); that tax payable is economical to SMEs. They however tended to disagree that SMEs pay tax when it is convenient for them to pay (M=1.81, SD=0.975). Compliance with VAT policy Regarding compliance with VAT, respondents were in agreement with most items regarding compliance. They agreed that the businesses usually charged VAT on all goods and services purchased (M=4.23, SD = 0.930); that VAT was usually levied on part or full payment of suppliers (M=4.14, SD= 0.790); that they had VAT compliance certificates (M=3.72, SD=1.083); that they have never been penalized for failure to submit VAT returns (M=4.03, SD= 0.930); that most of them had installed the ETR machines ( M=4.08, SD=0.798); and that the businesses maintain up-to date business records at all times. This means that the respondents lacked consensus regarding this particular item. Compliance with presumptive tax policy On presumptive tax, respondents were particularly keen to comply with its policy. This is because as presented in Table 4.14, most respondents found the mode of taxation under presumptive taxation quite favourable to them.
  • 8. Effects of government taxation policy on sales... www.ijbmi.org 36 | Page In particular, respondents strongly agreed that non requirement of returns filing under presumptive tax was an incentive to them (M=4.59, SD=0.560); they agreed that elaborate business records are not necessary (M=4.10, SD=0.886); that payments of levies is straight forward hence the business does not hire professional consultancy services. Hence allows for momentary closures of business (M= 4.10, SD= 0.947). The means and standard deviations of the independent variables of SMEs compliance with government taxation policy in terms of operational costs, sales revenue, asset accumulation, and returns on capital were presented in Table 6 below. Table 6: Perceived Compliance with Government Taxation Policy Std. Mean Deviation Income Tax Policy SMEs have information on how much tax, when to pay tax, where to pay and mode of tax payment 4.29 .527 SMEs pay tax when it is convenient for them to pay 1.81 .975 The tax payable is economical to SMEs 4.33 .942 The government either increases or decreases tax rate at its own 4.44 .623 discretion There are diverse taxes imposed on SMEs 4.01 .725 VAT Policy The business usually charges VAT on all goods and services to the purchaser 4.23 .920 We normally charge VAT whenever we issue a certificate in respect of services 4.33 .733 VAT is usually levied on part or full payment of our supplies 4.14 .790 The business has a VAT compliance certificate 3.72 1.083 The business has never been penalized for failure to submit VAT 4.03 .930 returns The business has complied with VAT requirements by installing an ETR machine 4.08 .798 The business maintains up-to-date business records at all times 4.30 .891 Presumptive Tax Policy Non requirement of returns filing is an incentive 4.59 .560 Elaborate business records are not necessary 4.10 .886 Payment of levies is straight forward hence the business does not hire professional consultancy services 4.21 .677 Levies are only charged when the business is operating. Hence allows for momentary closures of business 4.10 .947 Perceived Effects of Government Taxation Policy on Sales Revenue : Respondents’ perceptions of effects of government taxation policy on SME sales revenue were measured using five items. The mean responses to all the items were approximately 4 indicating that most of the respondents perceived government taxation policy to have an adverse effect on their sales revenue. In particular, respondents agreed that the regressive nature of taxes on SME reduces their revenue base m=4.09, SD = 0.804), that the uncertainty of taxes paid by SMEs Interferes with their inventory cycles leading to breaks and jumps in their tax remittances and reduced revenue base ( M=4.30, SD= 0.89); that most SMEs do not hold portfolio in their operations and are thus prove to higher risks of taxation leading to weak sales revenue (M=4.56, SD=0.563); that government taxation policy on SME does
  • 9. Effects of government taxation policy on sales... www.ijbmi.org 37 | Page not consider much the scale of operation and this adversely affects their sales revenue (M= 4.06, SD =0.866); and that taxation policy fails to deal with pricing aspects meaning that it does not focus on selling price of SME thereby lowering sales revenue (M=4.26, SD=0.746). As depicted in Table 7. Largest variation was 0.891 while the smallest was 0.563 which confirms that the taxation policy is viewed negatively in as far as sales revenue is concerned. Table 7: Perceived Effect of Government Taxation Policy on SME Sales Revenue Std. Mean Deviation The regressive nature of taxes on SME reduces their revenue 4.09 .804 base The uncertainty of taxes paid by SMEs interferes with their 4.30 .891 inventory cycles hence breaks and jumps in their tax remittances and reduced revenue base Most SMEs do not hold portfolio in their operations and are 4.56 .563 thus prone to higher risks of taxation and hence weak sales revenue Government taxation policy on SME does not consider much 4.06 .866 the scale of operation hence adversely affects their sales revenue Taxation policy fails to deal with pricing aspects and hence 4.26 .746 does not focus on selling price of SMEs and lowers sales revenue Assumptions of linearity : The strength of linear relationship among variables was assessed using Pearson product moment correlation. Correlation was used since being a measure of the degree of association; it was likely to identify independent variable dimensions that provide best predictions. As shown in Table 8, correlation among the three government taxation policy dimensions (Income tax, VAT, presumptive tax) were significant and ranged from r= 0.271) (p<0.01) to r= 0.378 (p<0.001). Correlation between sales revenue and VAT policy (r= -0.125, p> 0.05) and between sales revenue and presumptive tax policy (r= 0.114, p> 0.05). Thus linearity assumptions were satisfied. Table 8: Intercorrelation Matrix Income Tax VAT Presumptive Sales policy Policy Tax Policy Revenue Income Tax 1 policy VAT Policy .271** 1 Presumptive .378** .280** 1 Tax Policy Sales .153* -.125 -.016 1 Revenue **. Correlation is significant at the 0.01 level (2-tailed). *. Correlation is significant at the 0.05 level (2-tailed).
  • 10. Effects of government taxation policy on sales... www.ijbmi.org 38 | Page Assumptions of independence of Errors : The Durban-Watson statistic was used to examine if prediction of dependence errors were correlated. As presented in Table 4.20, The Durban –Watson statistics for the regressions of sales revenue (1.897), was within the 1.50 and 2.50 interval suggested by Tabachunck and Fidell (2001), the errors were adjusted to be uncorrelated. The assumption of independence of errors was therefore met. Testing the effect of government taxation policy on sales revenue of SMEs : The study sought to establish the effect of government taxation policy on sales revenue of SMEs. It was therefore postulated that there was no significant statistical relationship between government taxation policy (income tax, VAT and presumptive tax) and sales revenue of SME. Results of the hierarchical regression analysis are presented in Table 9. Table 9: Results of regression analysis: Effect of Government Taxation Policy on Profitability and Growth of SMEs Operational costs Predictors Sales revenue Model1 Model2 Model1 Model2 Std. Std. Std. Std. Step1: Controls Management .042 .044 -.035 -.023 Employment .084 .078 -.035 -.059 Step2: Tax. Policy Income .129 -.217* VAT .309** -.160* Presumptive -.206* .341** R2 .010 .183 .003 .055 Adjusted R2 .002 .158 -.009 .0.026 R2 .010 .173 .003 .0.052 F-value 0.828 11.669** 0.230 3.019* Durbin- 2.487 1.897 Watson **p<0.01, *p<0.05 From table 9, it is seen that both management of the business and number of the employees had no significant effect on operational costs (R2 value = 0.013). On adding the government taxation policy variables, the R2 value = 0.013). On adding the government taxation policy variables, the R2 of operational costs increased to 0.183 indicating that the three dimensions of government taxation policy contributed an additional 17.3% to the variance in operational costs. Similarly, the R2 of sales revenue increased to 0.055 showing that the three dimensions of government taxation policy contributed an additional 5.2% to the variance in sales revenue. The R2 of asset accumulation increased to 0.082 meaning that government taxation policy contributed an additional 7.1% to the variance in asset accumulation. The R2 of return on capital increased to 0.079 indicating that government taxation policy contributed an additional 6.7% to the variance in return on capital.
  • 11. Effects of government taxation policy on sales... www.ijbmi.org 39 | Page Of the three government taxation policy dimensions, income tax policy was found to be negatively and significantly-0.217,p<0.05) and related asset accumulation ((β-0.245,= p<0.01). It was also positively and significantly related to return on capital (β -0=.192, p<0.05). However, it had no significant relationship with operational and significantly related to on capital (β =0.156, significantly p<0.05) related it to sales was net revenue (=-0.160, p<0.05), but was not significantly related to asset accumulation (=0.059, p=0.05). Presumptive tax policy had positive and significant relationships with sales revenue (=0.341), p=0.01); asset accumulation (=0.311, p=0.01); and return on capital (=-.264, p=0.01). It however had a negative relationship with operational costs (=-0.206, p<0.05). The researcher (Table 9) concluded therefore that government taxation policy had a significant impact on profitability and growth of SMEs through positive and negative effects on profit and growth dimensions (operational costs, sales revenue, asset accumulation, return on capital). Summary of Hypothesis Testing Results Results of the hypothesis testing are presented in Table 10. The results indicated that the four hypotheses were statistically significant. Hypothesis 1: Sales revenue is independent of government taxation policy Hypothesis 2 tested the effect of government taxation policy (Income tax policy, VAT policy, and presumptive tax policy) on sales revenue of SMEs. The standardized coefficients for Income tax (=0.217, p<0.01) were all statistically significant. This shows that the hypothesis was not supported. The standardized coefficient of - 0.217 for income tax implies that a 1% increase in income tax policy is likely to reduce sales revenue by 0.217%; similarly, the negative coefficient of -0.160 for VAT means that a 1% increase in VAT is likely to reduce sales revenue by 0.160%. The positive coefficient for presumptive tax of 0.341 indicates that a 1% increase in presumptive tax policy is likely to increase sales revenue by 0.341%. Table 10: Summary of Hypotheses Testing Hypothesis β-value Result Ho2 Sales revenue is independent of government -0.217* Not supported taxation policy: Income tax policy -0.160* Not supported VAT policy 0.341** Not supported Presumptive tax policy Presumptive tax policy VAT policy Presumptive tax policy **p<0.01, *p<0.05 III. CONCLUSION AND RECOMMENDATION The study sought to establish the relationship between government taxation policy on sales revenue of SMEs in Kenya. the study has pointed out demography information of the respondents, Kenya. From the findings of the study, the R2 of sales revenue increased to 0.055 showing that the three dimensions of government taxation policy contributed an additional 5.2% to the variance in sales revenue. The researcher concluded therefore that government taxation policy had a significant impact on sales revenue of SMEs that is positive and negative effects. Small and Medium Enterprises should be levied lower amounts of taxes so that they will have enough funds for other activities that will lead to business growth and profitability. Additionally it will help SMEs get better equipped to survive in a competitive market. IV. ACKNOWLEDGEMENT First and foremost my sincere gratitude goes to the almighty God for the gift of life, health, wisdom, and strength that He granted me during the time of undertaking this study. I also extend my gratitude to Ondimu Eric Monayo and Philip Oogah Monayo (Research Consultants) who worked with me to make this work a success. Finally, i acknowledge the efforts of Janet Nyamisa Ogoti (Editor) for her outstanding services in editing this journal. May God Bless You All.
  • 12. Effects of government taxation policy on sales... www.ijbmi.org 40 | Page REFERENCES [1]. Holban. O.I., (2007). The Taxation of Small and Medium-Sized Enterprises-a Hindering Factor Influencing the European Economic Growth. Doctoral dissertation, Alexandru Ioan Cuza University of Iasi and Academy of Economies Studies from Bucharest Romania. [2]. Kerlinger, F., (2003). Foundations of Behavioral Research. New Delhi: Sarjeet Publishers [3]. Krejcie R.V and Morgan D.W. (1970). Determining Sample Size for Research Activities Educational and Psychological Measurement, 30, 608, [4]. Sage Publishers. Saunders, M., Lewis, P. & Thornhill, A. (2007). Research methods for business for Students: 4th edition. Pearson Education Limited Artes Graficas. [5]. Tomlin, B. (2008). Clearing hurdles: key reforms to make small businesses more successful. (Commentary No. 264). Toronto, Ontario C.D. Howe Institute. Retrieved from www.cdhowe.org/pdf/commentary [6]. Vasak, S. (2008). Small, medium, and large enterprises. USAID Business Climate Reform. Retrieved from http://pdf.usaid.gov/pdf Yin, R.K. (2003). Case Study Research Design and methods: 3rd edition. Sage publications: thousand Oaks.