SlideShare a Scribd company logo
1 of 20
Download to read offline
International Journal of Business and Management Invention
ISSN (Online): 2319 – 8028, ISSN (Print): 2319 – 801X
www.ijbmi.org || Volume 6 Issue 5 || May. 2017 || PP—49-67
www.ijbmi.org 49 | Page
Analysis of Public Investment Expenditure on Economic Growth
in WAEMU Countries
Rémy Hounsou, Ph.D.
Ecole Nationale d’Economie Appliquée et de Management (ENEAM), Université d’Abomey Calavi, BENIN.
Abstract: Public investment expenditure plays an important role in the economy to produce goods and services
needed for economic development. This study analyzes the influence of public investment spending on the
economic growth of the WAEMU zone. The study considers a linear approach through individual fixed effects
models with Beck-Katz and Driscoll-Kraay corrections, the spatial autocorrelation model (SAC) and the long-
term model (DOLS). The empirical results of the study using panel data covering the period 1990-2015 indicate
that public investment spending can promote economic growth in WAEMU countries when they are allocated in
decreasing order to Education, health, public investment in basic road infrastructure and agriculture. However,
they are also likely to slow it down when they focus on military spending, even though their primary objective is
to ensure security for economic development. Finally, the study recommends that policy makers in WAEMU
countries refocus their public expenditure policies in key sectors of development, notably human capital, in
order to ensure a multiplier effect of public spending on economic growth and strengthen institutions
Democracy to ensure their independence through their interdependence.
Keywords: Public investment expenditure, economic growth, panel data, WAEMU.
JOL: C10 - C33 - H50 - O11 - P35
I. INTRODUCTION
Among the functions performed by the government, such as allocation, distribution and stabilization,
the allocation function is related to the role of government in producing goods and services for which social
benefits are different from net profits of the private sector. Such products include national defense, education,
infrastructure, etc. The government may be able to provide these products more efficiently than the private
sector. Thus, the responsibility of the State is crucial through a policy of public investment to strengthen the
productive capacities of a country. However, for an efficient use of resources in relation to growth objectives, it
is necessary to question the quality of investments made by a State. Moreover, in a context where financial
resources must be optimally exploited, it is necessary for a State to control the scope of its expenditure for the
benefit of different sectors of the economy in order to have a more significant impact on economic development
and fight more effectively against poverty. Investment is an important factor in economic growth. Also,
investment spending remained a tool for capital growth for the private sector. But, in a modern dynamic of
finance, the public sector must not only maintain but also increase public wealth. Thus, the theoretical debate
arises as to whether the private sector or the public sector should ensure public investment expenditure.
There are divergent views among economists on this issue. A distinction is made between those for whom the
State simply has to enact and enforce the fundamental laws of society and, on the other hand, to establish a
framework within which firms can engage in fair competition. There are those for whom the state must
stimulate economic activity by acting on its components (creation of public jobs, lower interest rates, public
investments, etc.). Finally, there are those for whom public action is justified mainly by the presence of public
goods. For the classics in fact, the State must simply ensure the smooth running of the city. Smith (1776) finds
that the state must only perform its regal function by protecting society and the nation from the outside,
protecting individuals, building and maintaining public institutions. For Keynesians, on the other hand, the state,
through fiscal modulation, can manipulate taxes and public spending to stabilize the economy. Unlike the
Keynesians, public school theorists believe that the state must intervene when the good by its nature is
indivisible and whose use by one more person has no cost. Individually, therefore, it is difficult to agree on the
financing of goods that provide usefulness that is difficult to quantify for each other. Theorists of endogenous
growth are also in favor of public action. Boyer and Durand (1998) state that "in the absence of coordination
organized by the State or collective organizations, an initially poor country can be permanently in a poverty trap.
On the other hand, a synchronization of investment or innovation can overcome this obstacle and lead to
stronger growth, benefiting society as a whole. Thus, the State may be at the origin of a creation of additional
wealth ".
In the light of all the above, public investment expenditure plays an important role in the economy to
produce goods and services. These expenditures are among others, education, health, roads, energy, industrial
products, agricultural products. However, the debate on the effectiveness of public spending as an instrument of
Analysis of Public Investment Expenditure on Economic Growth in WAEMU Countries
www.ijbmi.org 50 | Page
economic regulation has been considerable, both in terms of the number of theoretical and empirical studies and
the importance of Implications in terms of economic policies. Hence, there is no consensus either on the
theoretical level or on the empirical level. Thus, our study proposes to study public investment expenditure at
the level of WAEMU countries: Benin, Burkina Faso, Côte d'Ivoire, Guinea Bissau, Mali, Niger, Senegal and
Togo. These countries are part of the same monetary zone and cannot use monetary policy intrinsically to
stabilize their economies. Only the fiscal policy remains the only adjustment instrument available to these
countries and whose investment expenditure remains a privileged tool. Thus, the control of public spending is
governed by compliance with the convergence criteria imposed on all the Member States of the Union.
Analyzes of the impact of existing public spending in the empirical literature in most African countries most
often use simple linear models, error correction models (Nubukpo, 2007), or models based on Causality in the
sense of Granger (Chimobi, 2009). Other studies use panel data such as ordinary least squares (Tenou, 1999)
and the smooth transition model PSTR -Panel Smooth Threshold Regression (Fouopi et al., 2014).
All studies of panel data seem to ignore spatial dependence issues a priori and take this into account in
modeling. Moreover, most studies also ignore the composition of public investment spending allocated to key
sectors of the economy (agriculture, education, health, basic infrastructure, military, etc.). To address these
shortcomings, our study analyzes both the short-term and long-term effects of public investment expenditure on
the economic growth of WAEMU countries over the period 1990-2015 using panel data. The study also
incorporates the geographic dimension of the data in the estimation of the growth model.
The rest of the paper is organized as follows: Section 2 discusses the literature review. Section 3 presents the
methodological framework whose results are analyzed in Section 4. Section 5 concludes the work.
II. LITERATURE REVIEW
To account for the productive nature of public investment, several empirical studies were carried out in
the 1980s by Aschauer (1989b and 1990). In its specification of the model, Aschauer (1989b) adds to the
production function of the Cobb-Douglas type a flow of productive services of government capital. This
function is of the form Y = Af (K, L, G) where Y = Production; A = Level of technology or technical progress;
K = physical capital; L = Work; and G = Public capital. It uses aggregate time series data from the US economy
to examine the relationship between public infrastructure investment and private sector output. It concludes that
the basic infrastructure of streets, roads, airports, transit systems, sewer and water systems, etc., had the greatest
explanatory power over productivity and that the slowdown in productivity after 1973 in the US economy can
be attributed in large part to the slowdown in public investment.
Barro (1991) conducted a study of 98 countries using OLS regression. The results show that the
variables that positively influence the growth rate of real per capita GDP are human capital and policy stability
measures, while government spending and market distortions as measured by the GDP deflator negatively
influence the growth rate of real GDP per capita. In the same vein, Barro and Sala-i-Martin (1995) also used a
large number of countries over the period 1965-1985 to regress the average growth rate on several
macroeconomic variables including the level of education attained and the share In the GDP of public spending
on education. Their main results are that the level of education attained (measured by the number of years of
education) is significantly correlated with future growth, although the decomposition of the aggregate measure
of education achieved shows that the impact of primary education remains largely insignificant, and that public
spending on education also has a positive and significant effect on growth. Indeed, a 1.5% increase in the ratio
of public expenditure on education to GDP during the period 1965-1985 would have increased the average
growth rate during the same period of 0.3% per year. Andreosso-O'Callaghan (2002) in an econometric study
using panel data for the 1980s, 1990s and 1997, covering 10 Asian countries (China, south Korea, India,
Indonesia, Japan, Malaysia, the Philippines, Singapore, Thailand and Vietnam) finds that human capital
approximated by literacy or schooling plays an essential role in production and hence in the economic growth of
these countries. This result is corroborated by the study by Aghion and Cohen (2004) using panel-based
regressions for a group of 110 countries over the period 1960-2000. By approximating human capital by the
number of years of study of the labor force, they also find that the accumulation of this factor human capital
positively affects economic growth. Djistera (2008) estimates the effect of human capital accumulation on
economic growth using panel data from 9 Asian economies (China, South Korea, Hong Kong, India, Indonesia,
Malaysia, the Philippines, Singapore and Thailand) for the period 1971-2003. He finds that the accumulation of
human capital has a positive and significant effect on economic growth with a coefficient of 0.078. According to
this result, an increase in the level of human capital in the labor force indicates a higher rate of growth.
Studies are carried out at the level of developing countries to measure the effects of public investment
expenditure. Khan and Kumar (1997) test a sample of 95 developing countries for a conditional convergence
equation by integrating the private and public investment rate among various control variables. The estimated
coefficients are significantly positive. The impact of private investment is approximately twice that of public
investment over the overall 1970-1990 period or more specifically in the decade 1980-1990. On the contrary,
Analysis of Public Investment Expenditure on Economic Growth in WAEMU Countries
www.ijbmi.org 51 | Page
over the decade 1970-1980 the estimated coefficients are Very close to 0.21. The authors conclude that the
effectiveness of public investment is weak. Psacharapouloss and Woodall (1985), in their studies of developing
countries, find a positive contribution of education to economic growth in the order of 23.2% in Ghana and 16%
in Nigeria. Sacerdotti et al. (1998) found in a study of West African countries that investment in human capital
did not have a significant effect on economic growth. They justify their result by the lack of structural reforms
that must increase the social return to education. Thiam (1999) shows, using data from 40 developing countries,
that the increase in saving and investment has a positive effect on per capita GDP. Similarly, Ashipala and
Haimbodi (2003) show two long-term relationships between the level of economic activity measured by GDP
and public and private investment in Namibia. The results of their study indicate, on the one hand, that an
increase in public investment has a positive impact on economic growth and on the other, the existence of
complementarily between public and private investment. Using a time-series model estimated by ordinary least
squares (OLS), Mansouri (2003) showed that in Morocco, public capital spending has a driving effect on private
investment and growth economic. On the other hand, public consumption spending crowds out private
investment and slows down economic growth because of waste. It should be noted that current expenditures of
an unproductive nature (social security, recreation, economic services) can have a negative effect on growth,
while investment spending, especially in infrastructure, generally has a positive effect. Indeed, Gupta et al.
(2003) seek to understand the impact of fiscal policy, the structure of spending in 39 low-income countries over
the period 1990-2001. The results of their study indicate that an increase in current government spending has a
negative effect on growth, while capital spending favors growth. Thus, the increase in current expenditure must
be contained in favor of capital expenditure growth. The choice of the allocation of government expenditure to
current expenditure or capital expenditure can be a determining factor in boosting growth in developing
countries. Fouopi et al. (2014), showed the impact of public spending on economic growth in CEMAC countries
through a Panel Smooth Threshold Regression (PSTR) transition model. The results of their study indicate that
the positive effect of public spending on economic growth only appears when the ratio of public spending on
education and health reaches the thresholds of 8.70% and 10.80%, respectively. Public expenditure on
consumption, public investment expenditure and military expenditure positively affect the sensitivity of
economic growth to public expenditure up to a threshold of 33% of public expenditure on consumption, a
threshold of 48.5% for capital expenditure and 7.2% for military expenditure.
For the WAEMU countries, studies have also been conducted to show the effect of public spending on
economic growth. Tenou (1999) shows that, on average, per capita growth in these WAEMU countries is
significantly influenced by human capital, population growth rate, investment rate, rate of increase in exports
and the rate of consumption. Human capital, represented by the secondary school enrollment rate, appears to be
the most influential factor. Gurgand (1993) points out in his work on Côte d'Ivoire that more education does not
improve the productive efficiency of farmers' productivity and that in the higher education sector the results are
even less than in the agricultural sector. Ouattara (2007) highlighted in the WAEMU countries, based on
Granger's causality tests, that economic growth and public spending would influence each other. In its study,
Nubukpo (2007) shows that over the period 1965-2000, in the short term, total public expenditure has no
significant impact on growth in most of the Union's economies. On the other hand, the effect is positive in the
long term. Abou (2007), in the same vein as Nubukpo (2007), found a positive link between the level of public
investment expenditure and economic growth on the one hand, and on the other hand between the increase in
economic activity and the increase in the ratio of public investment expenditure on the total expenditure of the
countries of the Union.
The lack of convergence in the evoked empirical results leads us in our study to consider on the one
hand, the linear approach through models with individual effects and the long-term relationship according to the
Kao and Chiang approach (2000 ) and, on the other hand, the spatial dimension through spatial autocorrelation
(SAC) models.
III. METHODOLOGY
3.1 Empirical specification and data
The previous discussion suggests a general empirical formulation of a growth function that gathers
several of the empirical specifications used in the studies since that of Aschauer (1989b and 1990) and Barro
(1990). In particular, the basic equation used for the econometric estimates is based on the work of Nubukpo
(2007), Abou (2007), Fouopi et al. (2014) on real GDP growth in African countries. Like the Nubukpo (2007)
study, the dependent variable of our study is the logarithm of real GDP which measures the level of economic
activity. It can indicate an increase or a decrease in economic activity. As for the explanatory variables, the
study considers that WAEMU countries constitute small open economies with little diversification and whose
public investment expenditure is broadly devoted to the four main sectors: agriculture, Education, health and
basic infrastructure to which national defense is added. Failure to take into account the energy sector is linked to
data availability constraints. In addition to these areas of government intervention, the study incorporates two
Analysis of Public Investment Expenditure on Economic Growth in WAEMU Countries
www.ijbmi.org 52 | Page
other economic policy variables, the labor force and the terms of trade indices, which measure the purchasing
power of Imports, that is, the capacity of a country to pay its imports through these exports. A positive
development of this index is expected to have a positive effect on economic growth, since it is likely to boost
domestic supply dynamics, thereby increasing the economy's ability to meet foreign demand. Moreover, the
process of increasing competitiveness it suggests, in addition to foreign exchange earnings and increased
domestic savings, may be conducive to economic growth (Nubukpo, 2007). Relative to the working population,
Rebelo (1990) introduces in his model the human capital that he designates as the set of training, knowledge and
good health of the worker that make it more productive. Lucas (1988) finds that this human capital produces
positive externalities. Private investment is included in the model because of its role in wealth creation. Indeed,
private investment is a growth factor, both for the neoclassical school and for the Keynesian theory. Moreover,
it is likely to generate, in line with the recent results of endogenous growth models (Guellec and Ralle, 1997
quoted by Nubukpo, 2007), effects of technological externalities. The addition of inflation to the model is linked
to its relationship to the growth rate. The expected sign of this variable is indeterminate insofar as the value of
its parameter depends on the relative changes in the supply of money, the demand for money, and the shock of
supply. Finally, three other democracy variables that have positive impacts on economic growth are also
introduced into the model. They are the index of democracy, the quality of democratic institutions and the index
of political rights. Kornendi and Meguire (1985), Savvides (1995), Rivera-Baltiz (2002), Barro (1995) and Fosu
(2008) all show that strong democratic institutions are directly linked to a high quality of governance and there
exists a close link between democracy and economic growth.
Thus, our model explains the percentage change in GDP in terms of the various public investment
spending by sector of the economy, labor as measured by the labor force, the terms of trade index of the
economy and the democracy variables such as the index of democracy, the quality of institutions and the index
of political rights. In its equation form, our model can then be written as:
logGDPi,t = α0 + + α1logAGRIi,t+ α2logEDUCi,t + α3logHEALi,t+ α4logMILITi,t +
α5logCAGDPi,t+ α6logPRIi,t + α6logLABi,t + α7logTRAi,t + α8INFLi,t + α9INDi,t + α10QDIi,t +
α11IPRi,t + αi,t
with:
GDP as the real GDP; AGRI, public expenditure on investment in the agricultural sector; EDUC, public
expenditure on investment in the education sector; HEAL, public expenditure on investment in the health sector;
MILIT, public investment expenditure in the national defense sector; CAGDP, public expenditure on capital
investment: for example, expenditure on public infrastructure such as roads, railways, etc. All these
expenditures are as a percentage of GDP. PRI, private investment as a percentage of GDP; LAB, the labor force;
TRA, the terms of trade index; INFL, the inflation rate. IND refers to the index of democracy in Freedom
House's Policy 4 database: it varies from (-10) to the least democratic regimes to (+10) for the most democratic
regimes. QDI is a variable measuring the quality of democratic institutions whose index value is between -10
and +10: the higher the index (when positive), the more democratic institutions are of good quality. It is taken
from the Policy 4 database of Freedom House. IPR is the index of political rights obtained from the same
source. It is used as a proxy of political rights. It makes it possible to take into account the crucial importance of
political factors in democracy. According to the Freedom House, a high index reflects a high political risk,
which is not conducive to democracy. The "log" function applied to the quantitative economic variables is used
to limit the dispersion of the variables. The parameters represent the coefficients to be estimated. From the point
of view of macroeconomic theory, the expected signs of all coefficients are positive with the exception of the
sign of the coefficients α4 and α8 which may be positive or negative. μi represents the specific effects of the
countries and the error term is designated by ε. Finally, indices i and t represent respectively the individual
dimension (country index) and the temporal dimension.
The beginning of the period (1990) indicates the beginning of the democratic experience for the
WAEMU countries. The end of the study period (2015) is justified by the availability of recent data. Data are
mostly derived from the International Monetary Fund (IMF), World Bank (WB), Central Bank of West African
States (BCEAO) and Freedom House databases. Agricultural spending comes from the IFPRI International
Food Policy Research Institute base and military spending comes from data from the Stockholm International
Peace Research Institute (SIPRI).
3.2 Methodological approach
The analysis concerns the 8 countries of the WAEMU zone because countries may present
unobservable individual characteristics that are not taken into account in the aggregated data. The double
dimension of panel data is an advantage compared to other types of data, time series and cross-sections. This
double dimension makes it possible to simultaneously account for the dynamics of behavior and their possible
heterogeneity (Pirotte, 2011, Sevestre, 2002). The interest of this approach lies in the presence of good
Analysis of Public Investment Expenditure on Economic Growth in WAEMU Countries
www.ijbmi.org 53 | Page
properties (asymptotic unbiased estimator, convergent, etc.) which it can guarantee due to the combination of
the individual and temporal dimension.
First, Hsiao (1989) homogeneity tests and the Hausman (1978), Wooldrige (2002) and Hoechle (2007)
specification tests were used to discriminate between the fixed effect model and the random effects model. It
should be noted that the modified Hausman tests proposed by Wooldrige (2002) and Hoechle (2007) are more
robust than the standard Hausman test. The existence of a cross-sectional spatial dependence can also bias the
Hausman statistic. The results of the model specification tests revealed the predominance of the fixed effect
model over the random effects model. In addition, the assumption of autocorrelation, heteroskedasticity, and the
existence of spatial dependence in the data leads us to estimate the fixed effects model with Beck-Katz (1995)
and Driscoll-Kraay (1998).
Second, since the temporal dimension (T = 26) is larger than the individual dimension (N = 8), we are
then in the presence of a macro Panel (Hsiao, 2014, Pesaran et al. ,2012, Eberhardt, 2011, Pirotte, 2011,
Baltagi, 2008). The study of the unit root then becomes important. Our study uses first- and second-generation
unit root tests using Panel data (see Baltagi, 2015, Hurlin and Mignon, 2005). The first generation is
characterized by the fact that inter-individual dependencies are not taken into account, which on panel data
constitutes a strong hypothesis. On the other hand, the second generation removes this hypothesis by
considering inter-individual correlations. To test the spatial dependence before the implementation of the second
generation tests, we used the spatial dependence tests of Pesaran (2004), Pesaran et al. (2008) and Breusch-
Pagan (1980). The cointegration tests of Pedroni (1995, 1999, 2004) carried out indicate a presence of
cointegration. Thus, the estimation of the long-term relationship by the Dynamic Ordinary Least Squares
(DOLS) approach initially proposed by Kao and Chiang (2000) and then improved by Mark and Sul (2003) will
be mobilized. The equation is as follows:
where yit is the logarithm of real GDP, xit is the package of explanatory variables, υit is the error term.
We note that the equation characterizing the DOLS is the extension of the fixed effects model in which the lags
and future leads are included in the cointegration relation in order to produce asymptotically unbiased
estimators, avoid the problem of estimating the nuisance parameters. Moreover, based on the Monte Carlo
simulation, Kao and Chiang demonstrate that the DOLS is more efficient than the Fully Modified Ordinary
Least Squares (FMOLS) and the OLS. One of the constraints of the DOLS approach is that the variables must
be integrated in the same order i.e I (1).
Finally, our study places special emphasis on space panels. It should be noted that the models presented
above do not explicitly take into account the existence of any spatial correlation between countries, which may
implicitly exist. The question of the consequences of the negligence of such spatial interdependencies can be
asked. Baltagi and Pirotte (2010) show that the effects of not taking spatial dimension into account, if relevant to
the economic phenomenon of interest, are considerable on the quality of statistical inference, and can lead to
fallacious results. Elhorst (2001, 2003, 2009), Anselin and al. (2008) point out that the introduction of the spatial
dimension has become since some years an important research axis on Panel data. Anselin and Bera (1998),
Keller and Shive (2007) suggest two main reasons for this renewed interest in economics. The introduction of
the spatial dimension aims at capturing two effects: spatial autocorrelation which refers to the lack of
independence between geographical observations (in particular), and the spatial heterogeneity linked to the
differentiation of variables and behaviors in space. Different specifications can be envisaged in this context. The
choice of one of these depends on the context and the complexity of the phenomenon to be studied. These
spatial models were highlighted in the growth models by Conley and Ligon (2002), Ertur and Koch (2007). Our
reference model, developed by Lee and Yu (2008), combines a spatial autoregressive model with perturbations
(1,1), or SAC (Spatial Autoregressive Model), in a set of fixed-area spatial panel data:
With
Yi t represents the dependent variable (logarithm of the PIB), xi,t the vector of the explanatory variables, W and
M the weight matrix. In the case of our study, W = M, and designates the contiguity matrix of format NxN
which reflects the geographical proximity between countries across common borders. The intersection between
a row and a column of this spatial matrix takes 0 or 1 depending on whether two countries share a boundary.
Two main approaches have been suggested in the literature to estimate models that include spatial interaction
effects. One is based on the principle of maximum likelihood (ML) and the other on instrumental variables or
the generalized moments method (IV / GMM).
Analysis of Public Investment Expenditure on Economic Growth in WAEMU Countries
www.ijbmi.org 54 | Page
IV. RESULTS AND ANALYSIS
4.1. Descriptive analysis
This section focuses on the descriptive analysis of the model variables. We note that an average of the
GDP log is greater than the average of the other variables. Concerning public spending, public spending on
capital investment and education overweight spending on agriculture, health, military or national defense
spending over the analysis period (see Table 1). In addition, there is a small disparity between the different
expenditures of WAEMU member states. However, dispersion is much more pronounced for capital
expenditures. Another interesting finding is that private investment over the period remains higher than public
capital expenditure. Despite a high level of public investment over the last ten years, the quantity and quality of
infrastructure in the WAEMU remains relative (IMF, 2016). According to this report on the WAEMU zone, the
Union countries are lagging behind, particularly in terms of electricity supply, density of paved roads and
telecommunications infrastructure. Inadequate and inefficient infrastructure can erode the profitability of
commercial and economic activities (Foster and Briceño Garmendia, 2009). Chart 1 shows the trend of the real
GDP growth rate and the evolution of total public expenditure in the WAEMU zone. The rate of economic
growth rose from 3.7% in 2001 to 6.5% in 2015, while public spending moved more rapidly from 3.5% to
15.3% over the same period.
Table1: Descriptive statistics of the model variables (1990-2015)
Variable Obs Mean Std. Dev. Minimum Maximum
lgdp 208 22.03 1.12 19.15 24.26
lagri 208 0.19 1.10 -4.11 2.25
leduc 208 1.35 0.27 0.36 2.18
lheal 208 0.67 0.33 -0.73 1.41
lmilit 208 0.28 0.55 -3.51 1.39
lcagdp 208 1.84 0.54 -0.17 3.19
lpri 208 2.36 0.65 -0.20 3.73
llab 208 4.25 0.13 3.92 4.43
Ltra 208 4.70 0.30 3.06 5.27
infl 208 5.13 10.79 -7.80 69.58
Ind 208 3.82 3.00 0.00 8.00
qdi 208 4.11 1.60 2.00 7.00
Ipr 208 2.03 4.78 -8.00 8.00
Source: BCEAO, IMF, WB, IFPRI and SIPRI, Freedom House.
It should be stressed that public expenditure is the only instrument for influencing the growth and redistribution
objectives of the governments of the Union. The question of what is the best composition of public expenditure
that causes economic growth while controlling the accumulation of budget deficits and outstanding debt is a
problem for WAEMU countries.
Graph 1 : Public expenditure and economic growth trends in WAEMU
Source: BCEAO (2016).
Analysis of Public Investment Expenditure on Economic Growth in WAEMU Countries
www.ijbmi.org 55 | Page
Chart 2 shows that the countries of the Union have a trend in GDP. However, Cote d’Ivoire and Senegal
experienced a more marked trend compared to other countries. This result can be reflected in Cote d’Ivoire’s
strong allocation of natural resources as a source of foreign exchange inflows. For Senegal, the economic
performance over the period can be attributed to its economic and social stability, a source of inflows of foreign
direct investment (FDI).
Graph 2 : GDP trend in WAEMU countries
Source: BCEAO (2016).
4.2. Analyzes of the results of the estimates
The results show that public expenditure on agriculture, education, health and basic infrastructure is
positively correlated with economic growth in WAEMU countries (see Table 2). Military public spending
remains negatively correlated with economic growth. Another striking result is that private investment, the labor
force, the terms-of trade index, and institutional variables have a positive influence on economic growth.
Inflation remained negatively correlated with growth in the Union.
4.2.1. Public expenditure on agriculture and economic growth
Table 2 shows that public spending on agriculture has a positive and significant effect on economic
growth in the WAEMU countries, either in the individual fixed effects model with Beck-Katz correction (1995)
or, The Spatial Autoregressive Model (SAC). This effect is low in the SAC model (0.054) compared to the
individual fixed effects model (0.197). A significant result across the DOLS model is that the impact of public
spending on agriculture would be greater in the long run with a value of 0.258. In other words, an increase in
public expenditure on agriculture of 10% would lead to a long-term increase in GDP of 2.5%. This result
converges with the World Bank (2008) on a sample of developing countries and that of Suphannarchart and
Warr (2009) for Thailand.
4.2.2. Public expenditure on education and economic growth
The results in Table 2 show that public spending on education has a positive impact on economic
growth, either in the individual fixed effects model with Beck-Katz (1995), Driscoll-Kraay (1998), Spatial
Autoregressive Model (SAC), or in the long-term model. The effect is much more pronounced in the long-term
model than in the other models. An increase in public expenditure on education of 10% would lead to an
increase in GDP of 14.67%, 3.94%, 0.35% and 17.02%, respectively, in the individual fixed effects model with
Beck-Katz correction, individual fixed effects model with correction of Driscoll-Kraay, Spatial Autoregressive
Model (SAC) and in the DOLS "Dynamic Ordinary Least Squares". This result supports the positions of
Benhabib and Speigel (1994), Barro and Sala-i-Martin (1995), Musila and Belassi (2004), Beldacci et al. (2008),
Jobert (2008) and Fouopi et al. (2014) that public spending on education improves the rate of economic growth.
Analysis of Public Investment Expenditure on Economic Growth in WAEMU Countries
www.ijbmi.org 56 | Page
4.2.3. Health Expenditure and Economic Growth
Table 2 shows a positive relationship between public expenditure on health and economic growth in the
countries of the Union, regardless of the model considered. In other words, the increase in public expenditure on
health by 10% ceteris paribus would increase GDP by 6.83%, 4.89%, 0.98% and 7.43%, respectively, in the
individual fixed effect model with Beck-Katz correction, the effect model (DOLS), the Dynamic Ordinary Least
Squares (DOLS) model, and the Spatial Autoregressive Model (SAC). We note that the impact coefficient is
higher in the long-term dynamics compared to the other models. This result corroborates that of Ulman (2003)
and Fouopi et al. (2014).
4.2.4. Military Public Expenditures and Economic Growth
An increase in military spending negatively affects economic growth in WAEMU countries using the
fixed-effects models with Beck-Katz correction and in the long-term DOLS. On the contrary, the effect is
positive in the autoregressive spatial model (SAC). Thus, the sign of military spending seems to be mitigating.
On the other hand, we note a more pronounced long-term negative effect (DOLS). Indeed, a 10% increase in
military spending would reduce the GDP by 3.74% in the long term. This seems to be explained by the fact that
military spending constitutes a loss in this context that other public spending is more likely to serve as an engine
of growth. At this stage, we can say that military spending is not an effective policy instrument. This result
supports the position of Joerding (1986), Jobert (2008) and Malizard (2013). However, while the economic
benefits of these expenditures are not their primary purpose and their primary objective is to ensure security, it is
relevant to seek to improve the effectiveness of these expenditures, especially in these times of terrorist threats.
4.2.5. Government Expenditures on Capital and Economic Growth
In Table 2, the coefficient of impact of public capital expenditure is positive and significant in all
estimated models. In other words, an increase of 10% in public capital expenditure would increase the Union's
GDP by 4.48%, 2.32%, 1.32% and 3.87%, respectively, in the individual fixed effects models with Beck-Katz
correction, Driscoll-Kraay correction, the autoregressive spatial model (SAC) and the long-term dynamics
(DOLS). These results support those obtained by Easterly and Rebelo (1993), Nelson and Singh (1994), Khan
and Kumar (1997), Gupta et al. (2003), Mansouri (2003), Abou (2007) and Fouopi et al. (2014).
4.2.6. Contribution of Traditional Factors of Economic Growth
Table 2 shows a positive and significant correlation between private investment and economic growth
in the Union, regardless of the model considered. The impact is much more pronounced in the long-term
dynamics through the ordinary least squares model of Kao and Chiang (2000). In other words, an increase in
private investment of 10% would increase the GDP by 4.04% in the long term compared to 0.59% in the
autoregressive spatial model (SAC) and 1.23% in the fixed effects model with correction of Driscoll- Kraay
(1998). This observation can be explained by the fact that private investment is a growth factor for both the
neoclassical school and the Keynesian theory through the effects of externalities generate. Although this is
theoretically explained by these currents of thought, this result confirms those of Ojo and Oshikoya (1995),
Ghura and Hadjimichael (1996) and Ashipala and Haimobodji (2003).
The effect of the terms of trade indices is positive and significant. Nubukpo (2007) argues that
improving the terms of trade can promote economic growth. This effect is more pronounced in the long-term
dynamics (1.298). The impact of inflation on economic growth is negative in any model. However, it should be
noted that this effect is almost nil in the model taking into account the spatial dimension. Moreover, an increase
in inflation would reduce the GDP in the long term by 0.38%. This result for WAEMU countries is also in line
with the findings of De Long and Summer (1992), Levine and Zervos (1992), Gregorio (1993) and Varoudakis
(1994).
4.2.7 Contribution of Institutional Factors to Economic Growth
Table 2 shows a positive and significant correlation between the quality of institutions, the index of
political rights and economic growth, whatever the model considered. However, the effect appears to be higher
in the long term than in other models. It should be noted that the Democracy Index affects growth positively and
significantly only in the long-term relationship. This result seems surprising, but could be explained by the fact
that the establishment of democratic institutions or reforms sometimes requires more time and often involves
amending the constitution.
It is also important to examine the contribution of countries to growth through careful scrutiny of
individual unobservable characteristics. Table 7 in appendix 2 shows the specific effects of each of the countries
of the Union. The results show that the unobservable characteristics of Cote d’Ivoire, Senegal, Mali and Niger
Analysis of Public Investment Expenditure on Economic Growth in WAEMU Countries
www.ijbmi.org 57 | Page
contribute positively to economic growth. On the contrary, the unobservable characteristics of Benin, Burkina
Faso, Guinea-Bissau and Togo reduce economic growth.
A comparison of the Autoregressive Spatial Model (SAC) and the SEM-Spatial Error Model using the Akaike
(AIC) and Schawarz (BIC) information criteria indicates that the SAC model minimizes these information
criteria. This model has the advantage of being more general and robust than the SEM model. The coefficients
rho (ρ) and lambda (λ) are significantly non-zero at the 1% threshold. This result reflects the relevance of the
model and provides some interesting information. Indeed, since the spatial autoregressive coefficient is
significant at the 1% threshold and equal to 0.219 in table2, it means that if the GDP of a country of the Union
increases by 1%, the GDP of neighboring countries ceteris paribus would increase by 0.219%. This result can
be explained by intra-regional trade between countries or by the effects of contagion. Although the regional
integration of the Union states remains weak, they benefit the same monetary policy, the same regional stock
exchanges market and are subject to the same economic convergence criteria.
Finally, the Dynamic Ordinary Least Squares (DOLS) model shows in decreasing order that public
expenditure on education, public expenditure on health, public expenditure on investment and public
expenditure on agriculture affect positively and significantly Economic growth in the Union. Thus, it should be
emphasized that education is a pillar of the improvement of economic growth in the WAEMU zone. Education
and health spending is included in human capital spending, which indicates that improving human capital would
increase long-term growth. This result is consistent with the conclusions of the endogenous human capital
growth theory developed by Lucas (1988), Mankiw, Romer and Weil (1992), Azariadis and Drazen (1990),
Autume and Michel -i-Martin (1995), Benhabib and Spiegel (1994). Human capital not only facilitates the
adaptation of more advanced technologies, but also makes innovation simpler at the border. Another significant
achievement in the long-term dynamic is the fact that private enterprise investment will be more productive
(0.404) than investments by the Unions governments (0.387).
Table 2 : Results of the model estimation
Fixed Effect Beck-Katz Driscoll-Kraay SAC DOLS
lagri 0.009 0.197**
0.009 0.054+
0.258**
(0.851) (0.001) (0.837) (0.064) (0.001)
leduc 0.394**
1.467**
0.394**
0.035**
1.702**
(0.000) (0.000) (0.000) (0.004) (0.000)
lheal 0.489**
0.683**
0.489**
0.098+
0.743**
(0.000) (0.001) (0.000) (0.090) (0.000)
lmilit -0.009 -0.226*
-0.009 0.068*
-0.374**
(0.867) (0.029) (0.868) (0.019) (0.000)
lcagdp 0.232**
0.448**
0.232*
0.132**
0.387**
(0.002) (0.000) (0.011) (0.001) (0.000)
lpri 0.123**
0.377**
0.123**
0.059*
0.404**
(0.009) (0.000) (0.000) (0.039) (0.000)
llab 4.982**
0.522+
4.982**
1.800**
0.533
(0.000) (0.050) (0.000) (0.000) (0.675)
ltra 0.255**
1.067**
0.255*
0.099+
1.298**
(0.006) (0.000) (0.012) (0.077) (0.000)
infl -0.015**
-0.026**
-0.015**
-0.007**
-0.038**
(0.000) (0.000) (0.000) (0.000) (0.000)
ind 0.015 0.063 0.015 0.015 0.229**
(0.536) (0.210) (0.456) (0.256) (0.000)
qdi 0.202**
0.210**
0.202**
0.0915**
0.312**
Analysis of Public Investment Expenditure on Economic Growth in WAEMU Countries
www.ijbmi.org 58 | Page
(0.000) (0.000) (0.000) (0.000) (0.000)
ipr 0.064**
0.116**
0.064**
0.025**
0.259**
(0.000) (0.000) (0.001) (0.003) (0.000)
Constant -2.878 11.59**
-2.878+
(0.178) (0.000) (0.097)
Spatial
Rho 0.219**
(0.000)
Lambda -0.130**
(0.005)
Variance
sigma2_e 0.028**
(0.000)
N 208 208 208 200 160
R² Within 0.712 0.712 0.855
p-values in parentheses
+
p< 0.1, *
p< 0.05, **
p< 0.01
Source: BCEAO, IM, WB, IFPRI and SIPRI, Freedom House.
V. CONCLUSION AND RECOMMENDATIONS
The objective of this study was to assess the influence of public investment spending on economic
growth in WAEMU countries. In particular, it was necessary to identify the productive public spending that
could fully promote strong and sustained economic growth. The results of the analysis of the study conducted
through the individual fixed effects models and the long-term relationship on the one hand, and through spatial
autoregressive model, on the other hand, indicate that in the case of individual fixed effects models, for
example, an increase in public expenditure of 10% would lead to an average long-term increase in GDP of 2,
5% for agriculture, 6.32% for education, 4.22% for health, 2.70% for capital expenditure, 4.04% for private
investment, and 1.30% for the terms of trade. On the contrary, military public expenditure has a negative effect
on GDP, which, for a 10% increase, would reduce GDP by 3.74% over the long term. Similarly, an increase in
inflation would decrease in the long term the GDP by 0.38%. Thus, with respect to institutional factors, there is
a positive and significant correlation between these variables and economic growth. Moreover, the results from
the long-term relationship and spatially autoregressive models confirm these trends.
The main lesson of this study is that public spending can favor the growth of WAEMU economies when they
are targeted at education, health, and public investment in basic road infrastructure, but are also likely to slow it
down when they focus on military spending, although the economic spin-offs are not their primary purpose.
While their primary objective is to ensure security, it is pertinent to seek to improve the effectiveness of these
expenditures in order to address the many challenges of terrorism insecurity.
It should be noted that the multiplier effect of these variables on economic growth is low as shown in
Chart 1. For example, the economic growth rate rises from an average of 3.70% in 2001 to 6.50% in 2015, while
public investment expenditure is growing more rapidly, rising from 3.50% to 15.30% during the same period. It
therefore urges policy-makers in WAEMU countries to refocus their public spending policies in the most
promising sectors of development, namely human capital (education and health) and road and energy
infrastructure. It is also important for these countries of the Union to strengthen democratic institutions in order
to ensure their independence through their interdependence as a guarantee of faster development.
Finally, this study did not take into account all explanatory variables of public expenditure that may explain
fully economic growth. We hope that further studies will be carried out to improve this work.
REFERENCES
[1]. Abou, N. B. (2007), « Structure des Dépenses Publiques, Investissement Prive et Croissance dans l’UEMOA » BCEAO Document
d'Étude et de Recherche No. DER/07/04 (Dakar : Banque Centrale des Etats de l'Afrique de l'Ouest).
[2]. Adam, S. (1776), « Recherches sur la Nature et les Causes de la Richesse des Nations ».
[3]. Aghion, P., & Cohen, E. (2004), « Éducation et croissance (pp. 00-00). Paris : La documentation française ».
[4]. Andreosso-O'Callaghan, B. (2002), « Human capital accumulation and economic growth in Asia ».
[5]. Anselin, L., & Bera, A. K. (1998), « Spatial dependence in linear regression models with an introduction to
spatial econometrics ». Statistics Textbooks and Monographs, 155, 237-290.
Analysis of Public Investment Expenditure on Economic Growth in WAEMU Countries
www.ijbmi.org 59 | Page
[6]. Anselin, L., Le Gallo, J., & Jayet, H. (2008), « Spatial
panel econometrics. In The econometrics of panel data (pp. 625-660) ». Springer Berlin Heidelberg.
[7]. Aschauer, D., (1989), « Is public expenditure productive? » Journal of Monetary and Economy 23 (2), 177-200.
[8]. Aschauer, D., (1990), « Why is infrastructure important? » In Is There a Shortfall in Public Capital Investment, Munnell, Alicia
(Ed.), pp. 69-104. Boston, MA: Federal Re-serve Bank of Boston. 419-43.
[9]. Ashipala J. Et Haimbodi N. (2003), « The Impact of
Public Investment on Economic Growth in Namibia », Working Paper, No. 88, NEPRU;
[10]. Ashipala, J., & Haimbodi, N. (2003), « The impact of public investment on economic growth in Namibia », (No. 88). Namibian
Economic Policy Research Unit.
[11]. Autume, A., & Michel, P. (1994), « Education et
croissance ». No. Halshs-0043010 . HAL.
[12]. Azariadis, C., & Drazen, A. (1990), « Threshold
externalities in economic development ». The Quarterly Journal of Economics, 105(2), 501-526.
[13]. Baldacci, E., Clements, B., Gupta, S., & Cui, Q. (2008),
« Social spending, human capital, and growth in developing countries ». World development, 36(8), 1317-1341.
[14]. Baltagi, B. H. (2008), « Econometric analysis of panel
data». John Wiley & Sons.
[15]. Baltagi, B. H. (2015), «The Oxford handbook of panel
data». Oxford University Press, USA.
[16]. Baltagi, B. H., & Pirotte, A. (2010), «Panel data
inference under spatial dependence ». Economic Modelling, 27(6), 1368-1381.
[17]. Banque Mondiale (2008), « L’agriculture au service du développement in rapport sur le développement dans le monde », Editions
De Boeck, Distribution Nouveaux horizons ARS, Paris.
[18]. Barro, R. J. (1990), « Government spending in a simple model of endogeneous growth ». Journal of political economy, 98(5, Part
2), S103-S125.
[19]. Barro, R. J. (1991), «Economic growth in a cross section of countries ». The quarterly journal of economics, 106(2), 407-443.
[20]. Barro, R. J. (1995), « Inflation and economic growth (No. w5326) ». National bureau of economic research.
[21]. Barro, R. J., & Sala-i-Martin, X. (1995), « Economic growth », 1995. McGraw0Hill, New York.
[22]. Beck, N., and Katz J. N. (1995), « What to do (and not
to do) with time-series cross-section data. American Political Science Review 89: 634{647.
[23]. Benhabib, J., & Spiegel, M. M. (1994), « The role of
human capital in economic development evidence from aggregate cross-country data ». Journal of Monetary economics, 34(2), 143-
173.
[24]. Boyer, R., & Durand, J. P. (1998), « L’après fordisme », éditions La Découverte et Syros.
[25]. B
reusch, T. S., & Pagan, A. R. (1980), « The Lagrange multiplier test and its applications to model specification in econometrics
». The Review of Economic Studies, 47(1), 239-253.
[26]. Chimobi, O. P. (2009), « Government expenditure and national income: A causality test for Nigeria ». European Journal of
Economic and Political Studies, 2(2), 1-11.
[27]. Conley, T. G., & Ligon, E. (2002), «
Economic distance and cross-country spillovers ». Journal of Economic Growth, 7(2), 157-187.
[28]. De Long, J.
Bradford & Lawrence Summers H. (1992), « Macroeconomic policy and long-run growth », Federal Reserve Bank of Kansas City
Economic Review 77, no. 4, 5-30.
[29]. Djistera A. (2008), « Le rôle du capital humain dans la croissance : le cas des économies émergentes d'Asie » ; Université
Montesquieu Bordeaux IV ; pp.1-19.
[30]. Driscoll, J., & Kraay A. C. (1998), « Consistent
covariance matrix estimate spatially dependent data ». Review of Economics and Statistics 80: 549-560.
[31]. Easterly, W., & Rebelo, S. (1993), « Fiscal policy and
economic growth». Journal of monetary economics, 32(3), 417-458.
[32]. Eberhardt, M. (2011), « Panel time-series modeling:
New tools for analyzing xt data ». In 2011 UK Stata Users Group meeting.
[33]. Elhorst, J. P. (2001), « Dynamic models in space and
time ». Geographical Analysis, 33:119–140.
Elhorst, J. P. (2003), « Specification and estimation of spatial panel data models ». International Regional Science Review, 26(3):
244–268.
[34]. Elhorst, J. P., & Fréret, S. (2009), « Evidence of
Political Yardstick Competition in France Using A Two‐ Regime Spatial Durbin Model With Fixed Effects ». Journal of Regional
Science, 49(5), 931-951.
[35]. Ertur, C., & Koch, W. (2007), « Growth, technological interdependence and spatial externalities: theory and evidence ». Journal of
applied econometrics, 22(6), 1033-1062.
[36]. Foster, V., & Briceño-Garmendia, C. (2009), « Africa infrastructure country diagnostic ». The World Bank, Washington, DC.
[37]. Fosu, A. K. (2008), « Democracy and growth in Africa: Implications of increasing electoral competitiveness ». Economics
Letters, 100(3), 442-444.
[38]. Fouopi D. C., Nsi Ella P., Mbomon Ndoumba J., Ngah
E. B. (2014), « Dépenses Publiques et Croissance Economique dans les pays de la CEMAC », colloque de l’Association
d’Économie Théorique et Appliquée.
[39]. Ghura, D., & Hadjimichael, M. T. (1996), « Growth in
Sub-Saharan Africa ». Staff Papers, 43(3), 605-634.
[40]. Gregorio, J. (1993), « Inflation, taxation, and long-run
growth ». Journal of Monetary Economics, 31(3), 271-298.
[41]. Guellec, D. et Ralle P. (1997), « Les nouvelles théories de la croissance », Paris, La Découverte, coll. « Repères ».
[42]. Gupta, Baldacci et Clements (2003), « Utiliser la politique budgétaire pour stimuler la
croissance », Finances & Développement, décembre 2003, pp. 28-31
Analysis of Public Investment Expenditure on Economic Growth in WAEMU Countries
www.ijbmi.org 60 | Page
[43]. Gurgand, M. (1993), « Éducation et productivité agricole en Côte d’Ivoire ». Revue d’économie du développement, (4).
[44]. Hausman, J. A. (1978), « Specification tests in
econometrics ». Econometrica: Journal of the Econometric Society, 1251-1271.
[45]. Hoechle, D. (2007), « Robust standard errors for panel
regressions with cross-sectional dependence ». Stata Journal, 7(3), 281.
[46]. Hsiao, C. (2014), « Analysis of panel data (No. 54) ».
Cambridge university press.
[47]. Hsiao, C., (1986), « Analysis of Panel Data »,
Econometric society Monographs N° 11. Cambridge Universirty Press.
[48]. Hurlin, C., & Mignon, V. (2005), « Une synthèse des
tests de racine unitaire sur données de panel ». Economie & prévision, (3), 253-294.
[49]. Jobert, T. (2008), « Dépenses publiques d’éducation,
dépenses militaires et croissance en Turquie : Une analyse empirique sur séries longues », Document de travail.
[50]. Joerding, W. (1986), «Economic growth and defense
spending: Granger causality ». Journal of Development Economics, 21(1), 35-40.
[51]. Kao, C., & Chiang, M. H. (2000), « Nonstationary panels, panel cointegration and dynamic panels ». Advances in econometrics, 15,
179-222.
[52]. Keller, W., & Shiue, C. H. (2007), « The
origin of spatial interaction ». Journal of Econometrics, 140(1), 304-332.
[53]. Khan, M. S., & Kumar, M. S. (1997), « Public and private investment and the growth process in developing countries ». Oxford
bulletin of economics and statistics, 59(1), 69-88.
[54]. Khan, M. S., & Kumar, M. S. (1997), « Public and
private investment and the growth process in developing countries ». Oxford bulletin of economics and statistics, 59(1), 69-88.
[55]. Kornendi, R. & Meguire, P., (1985), « Macroeconomic determinants of growth: cross-country evidence », Journal of Monetary
Economics, 16, 141-163.
[56]. Lee L. F., Yu J. (2008), «Estimation of Spatial Autoregressive Panel Data Models with Fixed Effects», Working Paper,
Department of Economics, The Ohio State University.
[57]. Levine, R. & Zervos, S. (1992), « Looking at the facts:
What we know about policy and growth from cross-country analysis », Mimeo., Oct. (World Bank, Washington, DC).
[58]. Lucas, R. E. (1988), « On the mechanics of economic development ». Journal of monetary economics, 22(1), 3-42.
[59]. Malizard, J. (2013), « Is there military keynesianism?
An evaluation in the case of France with disaggregated data (Vol. 4) ». Working paper ART-Dev.
[60]. Mankiw, N. G., Romer, D., & Weil, D. N. (1992), « A
contribution to the empirics of economic growth ». The quarterly journal of economics, 107(2), 407-437.
[61]. Mansouri B. (2003), « Déséquilibre financiers publics, investissement privé et croissance économique au Maroc », Agence
Universitaire de la Francophonie (AUF), RéseauThématique : Analyse Economique et Développement, pp. 1-21.
[62]. Mark, N. C., & Sul, D. (2003), « Cointegration vector
estimation by panel DOLS and long‐ run money demand». Oxford Bulletin of Economics and Statistics, 65(5), 655-680.
[63]. Musila, J., & Belassi, W. (2004), « The impact of
education expenditures on economic growth in Uganda: evidence from time series data ». The Journal of Developing Areas, 38(1),
123-133.
[64]. Nelson, M. A., & Singh, R. D. (1994), « The deficit-
growth connection: Some recent evidence from developing countries ». Economic Development and Cultural Change, 43(1), 167-
191.
[65]. Nubukpo, K. (2007), « Dépenses publiques et croissance des pays de l'Union économique et monétaire ouest-africaine (UEMOA)
». Afrique contemporaine, (2), 223-250.
[66]. Ojo, O., & Oshikoya, T. (1995), « Determinants of
long-term growth: Some African results ». Journal of African Economies, 4(2), 163-191.
[67]. Ouattara, W. (2007), « Dépenses Publiques, Corruption et Croissance Économique dans les Pays de l’Union économique et
monétaire ouest-africaine (UEMOA) : une Analyse de la Causalité au Sens de Granger ». Revue d’Intégration Africaine, 19, 481-
500.
[68]. P
edroni, P. (1995), « Panel Cointegration: Asymptotic and Finite Sample Properties of Pooled Time Series Test with an Application
to the PPP Hypothesis », Indiana University Working Papers in Economics, No. 95-013.
[69]. P
edroni, P. (1999), « Critical values for cointegration tests in heterogeneous panels with multiple regressors ». Oxford Bulletin of
Economics and statistics, 61(s 1), 653-670.
[70]. Pedroni, P. (2004), « Panel cointegration: asymptotic and finite sample properties of pooled time series tests with an application to
the PPP hypothesis ». Econometric theory, 20(03), 597-625.
[71]. Pesaran, M. H. (2004), « General diagnostic tests for
cross section dependence in panels ». University of Cambridge, Faculty of Economics, Cambridge Working Papers in Economics
No. 0435.
[72]. Pesaran, M. H., Smith, L. V., & Yamagata, T. (2012), «
Panel unit root tests in the presence of a multifactor error structure ». Journal of Econometrics, 175(2), 94-115.
[73]. Pesaran, M. H., Ullah, A., & Yamagata, T. (2008), « A
bias‐ adjusted LM test of error cross‐ section independence ». The Econometrics Journal, 11(1), 105-127.
[74]. Pirotte, A. (2011), « Econométrie des données de panel : théorie et applications». Economica.
[75]. Psacharopoulos, M., & Woodhall, G. (1985), « Education for Development: An Analysis of Investment Choices ». (Washington,
DC: World Bank).
[76]. Rebelo, S. (1991), « Long-run policy analysis and long-run growth ». Journal of political Economy, 99(3), 500-521.
[77]. Rivera-Batiz, F. (2002), « Democracy, Governance, and
Economic Growth: Theory and Evidence », Review of Development Economics, Vol.6, n°2, pp. 225-247.
[78]. Sacerdoti, E., Brunschwig, S., & Tang, J. (1998), « The impact of human capital on growth: evidence from West Africa ». IMF
Working Paper, Vol., pp. 1-34.
Analysis of Public Investment Expenditure on Economic Growth in WAEMU Countries
www.ijbmi.org 61 | Page
[79]. Savvides, A. (1995), « Economic growth in Africa ». World development, 23(3), 449-458.
[80]. Sevestre, P. (2002), « Econométrie des données de panel». (pp. 109-152). Paris : Dunod.
[81]. Suphannachart, W. et Warr, P. (2009), « Research and Productivity in Thailand Agriculture eds », proceeding of the World Bank
Annual Conference on Development Economics. Washington, D, C World Bank.
[82]. Tenou K. (1999), « Les déterminants de la croissance à long terme dans les pays de l'UEMOA », Notes d'Information et
Statistiques, Etudes et Recherches, N°493, BCEAO, juin 1999.
[83]. Thiam (1999), « Croissance économique, Capital
physique et capital humain : théories et application dans les pays en développement », mémoire (M. SC), université de Montréal.
[84]. Ulman B. P. (2003), « Economie de la Santé : Quelques
Faits Stylisés », Econ WPA HEW Series.
[85]. V
aroudakis, A. A. (1994), « La politique macroéconomique ». Dunod.
[86]. Wooldridge, J. M. (2002), « Econometric Analysis of
Cross Section and Panel Data ». Cambridge, MA: MIT Press.
7. APPENDIX
7. 1. Correlation of Variables
Table 3 : Variables correlation matrix
lgdp lagri leduc lheal lmilit lcagdp lpri llab ltra infl ind qdi ipr
lgdp 1.00
lagri 0.47* 1.00
leduc 0.60* 0.22* 1.00
lheal 0.40* 0.51* 0.22* 1.00
lmilit 0.09 0.18* 0.28* -0.04 1.00
lcagdp 0.02 0.29* -0.03 0.52* -0.14 1.00
lpri 0.31* 0.33* 0.14 0.44* -0.09 0.29* 1.00
llab -0.02 -0.12 0.15 -0.04 0.20* -0.13 -0.02 1.00
ltra
0.39* 0.25* 0.16 0.15 -0.19* 0.27* 0.10
-
0.24*
1.00
infl
-0.44* -0.38* -0.33* -0.08 -0.40* 0.06 0.14 -0.02
-
0.02
1.00
ind
0.08 0.11 -0.03 0.24* -0.03 0.35* 0.09
-
0.34*
0.01 -0.14 1.00
qdi
-0.03 -0.17 -0.01 -0.37* -0.01 -0.45* -0.28* 0.20* 0.01 0.04
-
0.81*
1.00
ipr
0.12 0.04 0.01 0.22* -0.01 0.30* 0.09
-
0.32*
-
0.02
-0.13 0.94*
-
0.80*
1.00
Source: BCEAO, IMF,WB, IFPRI and SIPRI, Freedom House.
7.2. : Hsiao (1989)test and Results of the individual fixed effects
Tableau 4:Test d'homogénéité de Hsiao (1989) Table 5: Specification test
Source: BCEAO, IMF, WB, IFPRI and SIPRI, Freedom House.
Graph 3 : Visual normality test
Analysis of Public Investment Expenditure on Economic Growth in WAEMU Countries
www.ijbmi.org 62 | Page
Source: BCEAO, IMF, WB, IFPRI and SIPRI, Freedom House.
Table 6: Autocorrelation, Heteroscedasticity, normality residual test
Graph 4: Representation of countries fixed effects
Source: BCEAO, IMF, WB, IFPRI and SIPRI, Freedom House.
Table 7 : Fixed effects values and signification
Analysis of Public Investment Expenditure on Economic Growth in WAEMU Countries
www.ijbmi.org 63 | Page
co u n try f ix e d e f f e ct p - v a lu e
B e n in - 0.07 0.00
B u rk in a F a s o - 0.81 0.00
C o te d 'iv o ire 1.67 0.00
G u in e e B is s a u - 1.64 0.00
M a li 1.21 0.00
N ig e r 0.22 0.04
S e n e g a l 0.27 0.00
T o g o - 0.85 0.00
T o ta l 0.00
S tatistiq u e P -v alu e D é cisio n
B re u sch -P agan (1980) 55.70 0.00
P e saran (2004)-C D te st 4.28 0.00
P e saran e t al. (2008) 5.55 0.00
Te st d e d é p e n d an ce
D é p e n d an ce in te r-in d iv id u e lle
7.3. Individuals fixed effects estimation model with Driscoll-Kraay(1998) correction
(1) (2) (3) (4) (5) (6) (7) (8)
lgdp lgdp lgdp Lgdp lgdp lgdp lgdp lgdp
lagri -
0.057
0.001 0.008 -0.046 -0.043 -0.048 -0.009 0.009
(0.53
2)
(0.987) (0.99
6)
(0.484) (0.488) (0.463
)
(0.868
)
(0.837)
leduc 0.797
**
0.564**
0.560
**
0.439**
0.355**
0.471*
*
0.329**
0.394**
(0.00
0)
(0.000) (0.00
0)
(0.000) (0.000) (0.000
)
(0.000
)
(0.000)
lheal 0.510
**
0.448**
0.457
**
0.500**
0.435**
0.526*
*
0.425**
0.489**
(0.00
6)
(0.000) (0.00
0)
(0.000) (0.000) (0.000
)
(0.000
)
(0.000)
lmilit 0.178
*
0.087 0.092 0.004 0.006 0.005 -
0.0055
6
-0.009
(0.04
7)
(0.193) (0.18
1)
(0.943) (0.918) (0.930
)
(0.936
)
(0.868)
lcagdp 0.118 0.203*
0.187
*
0.156*
0.119 0.183*
0.117 0.232*
(0.19
9)
(0.014) (0.02
6)
(0.037) (0.116) (0.043
)
(0.100
)
(0.011)
lpri 0.072 0.012 0.013 0.112**
0.128**
0.109*
*
0.127**
0.123**
(0.18
4)
(0.795) (0.75
6)
(0.004) (0.002) (0.005
)
(0.000
)
(0.000)
llab 6.262**
6.184
**
5.599**
5.482**
5.557*
*
5.426**
4.982**
(0.000) (0.00
0)
(0.000) (0.000) (0.000
)
(0.000
)
(0.000)
ltra 0.078 0.162*
0.242*
0.141*
0.261*
0.255*
Analysis of Public Investment Expenditure on Economic Growth in WAEMU Countries
www.ijbmi.org 64 | Page
(0.25
4)
(0.031) (0.018) (0.032
)
(0.018
)
(0.012)
infl -
0.018**
-
0.017**
-
0.018*
*
-
0.017**
-
0.015**
(0.000) (0.000) (0.000
)
(0.000
)
(0.000)
ind 0.044**
0.0152
(0.003) (0.456)
qdi 0.034 0.202**
(0.295
)
(0.000)
ipr 0.034**
0.064**
(0.001
)
(0.001)
constant 20.18
**
-6.093*
-
6.102
*
-3.923+
-3.791 -
3.889+
-3.499 -2.878+
(0.00
0)
(0.032) (0.03
0)
(0.079) (0.129) (0.052
)
(0.176
)
(0.097)
N 208 208 208 208 208 208 208 208
R² within 0.294 0.535 0.536 0.615 0.638 0.618 0.653 0.712
p-values in parentheses
+
p< 0.1, *
p< 0.05, **
p< 0.01
Source: BCEAO, IMF, WB, IFPRI and SIPRI, Freedom House.
7.4. : Spatial dependence test
Table 8 : Cross-sectional spatial dependence test
Variable CD-test p-value corr abs(corr)
lgdp 26.18 0.000 0.970 0.970
lagri -0.10 0.920 -0.004 0.254
leduc 4.56 0.000 0.169 0.338
lheal 4.75 0.000 0.176 0.396
lmilit -0.93 0.352 -0.035 0.461
lcagdp 0.75 0.452 0.028 0.273
lpri -0.86 0.392 -0.032 0.510
llab 15.41 0.000 0.571 0.585
ltra 6.64 0.000 0.246 0.386
infl 18.69 0.000 0.693 0.701
ind 8.99 0.000 0.333 0.345
qdi 4.16 0.000 0.154 0.278
ipr 12.30 0.000 0.456 0.456
Source: BCEAO, IMF, WB, IFPRI and SIPRI, Freedom House.
7.5.: Results of the tests of stationary and cointegration on panel data
Table 9: Stationary test of first and second generations
first generation second generation
Breitung (2000) Maddala and Wu (1999) Pesaran (2007)
Analysis of Public Investment Expenditure on Economic Growth in WAEMU Countries
www.ijbmi.org 65 | Page
Variables Level Diff Level Diff Level Diff
p-value p-value p-value p-value p-value p-value
lgdp 0.42 0.00 0.30 0.01 0.96 0.00
lagri 0.06 0.00 0.42 0.00 0.74 0.00
leduc 0.24 0.00 0.54 0.00 0.11 0.00
lheal 0.13 0.00 0.64 0.00 0.42 0.00
lmilit 0.25 0.00 0.06 0.00 0.93 0.00
lcagdp 0.63 0.00 0.34 0.00 0.92 0.00
lpri 0.87 0.05 0.79 0.00 0.99 0.07
llab 0.29 0.00 0.31 0.06 0.98 0.00
ltra 0.23 0.00 0.86 0.00 0.19 0.00
infl 0.26 0.00 0.00 0.00 0.00 0.00
ind 0.23 0.00 0.57 0.00 0.99 0.00
qdi 0.40 0.00 0.19 0.00 0.98 0.00
ipr 0.10 0.02 0.00 0.00 0.74 0.02
Source: BCEAO, IMF, WB, IFPRI and SIPRI, Freedom House.
Table 10 : Results of Pedroni (1995,1999, 2004) cointegration test
Test Stats. Panel Group
V -1.385 -
Rho 2.55 3.66
T -2.65 -2.87
Adf -1.29 -2.60
Source: BCEAO, IMF, WB, IFPRI and SIPRI, Freedom House.
Table 11 : Unit Root test of first and second generations
First generation Second generation
Breitung (2000) Maddala and Wu (1999) Pesaran (2007)
Variables Level Diff Level Diff Level Diff
p-value p-value p-value p-value p-value p-value
lgdp 0.42 0.00 0.30 0.01 0.96 0.00
lagri 0.06 0.00 0.42 0.00 0.74 0.00
leduc 0.24 0.00 0.54 0.00 0.11 0.00
lheal 0.13 0.00 0.64 0.00 0.42 0.00
lmilit 0.25 0.00 0.06 0.00 0.93 0.00
lcagdp 0.63 0.00 0.34 0.00 0.92 0.00
lpri 0.87 0.05 0.79 0.00 0.99 0.07
llab 0.29 0.00 0.31 0.06 0.98 0.00
Analysis of Public Investment Expenditure on Economic Growth in WAEMU Countries
www.ijbmi.org 66 | Page
ltra 0.23 0.00 0.86 0.00 0.19 0.00
infl 0.26 0.00 0.00 0.00 0.00 0.00
ind 0.23 0.00 0.57 0.00 0.99 0.00
qdi 0.40 0.00 0.19 0.00 0.98 0.00
ipr 0.10 0.02 0.00 0.00 0.74 0.02
Source: BCEAO, IMF, WB, IFPRI and SIPRI, Freedom House.
7.6.: Results of the long term-DOLS (Dynamic Ordinary Least Squares)relation
(1) (2) (3) (4) (5) (6)
lgdp lgdp lgdp lgdp lgdp lgdp
lagri 0.326**
0.234*
0.0591 0.0395 0.0742 0.258**
(0.008) (0.015) (0.472) (0.630) (0.357) (0.001)
leduc 2.639**
2.130**
1.567**
1.521**
1.560**
1.702**
(0.000) (0.000) (0.000) (0.000) (0.000) (0.000)
lheal 0.714**
1.102**
1.415**
1.376**
1.404**
0.743**
(0.007) (0.000) (0.000) (0.000) (0.000) (0.000)
lmilit -0.601**
-0.260*
-0.343**
-0.344**
-0.341**
-0.374**
(0.000) (0.029) (0.001) (0.000) (0.000) (0.000)
lcagdp 0.398*
0.704**
0.838**
0.708**
0.868**
0.387**
(0.026) (0.000) (0.000) (0.000) (0.000) (0.000)
lpri 0.127 0.0873 0.147 0.231*
0.134 0.404**
(0.336) (0.393) (0.102) (0.010) (0.130) (0.000)
llab -0.392 -0.212 -0.378 -0.111 0.533
(0.823) (0.884) (0.795) (0.938) (0.675)
ltra 1.342**
1.683**
1.613**
1.692**
1.298**
(0.000) (0.000) (0.000) (0.000) (0.000)
infl -0.0543**
-0.0549**
-0.0530**
-0.0375**
(0.000) (0.000) (0.000) (0.000)
ind 0.00575 0.229**
(0.750) (0.000)
qdi 0.0596 0.312**
(0.109) (0.000)
ipr 0.0119 0.259**
(0.290) (0.000)
N 176 176 176 176 176 160
p-values in parentheses
+
p< 0.1, *
p< 0.05, **
p< 0.01
Source: BCEAO, IMF, WB, IFPRI and SIPRI, Freedom House.
Analysis of Public Investment Expenditure on Economic Growth in WAEMU Countries
www.ijbmi.org 67 | Page
7.7.: SAC and SEM models comparison (spatial regression on panel data)
Model Obs ll(null) ll(model) df AIC BIC
Spatial Error Model (SEM) 208 . 29.501 14 -31.002 15.724
Spatial Autoregressive Model (SAC) 200 . 48.012 15 -66.024 -16.549
Source: BCEAO, IMF, WB, IFPRI and SIPRI, Freedom House.
7.8. : Spatial Autoregressive (SAC)model results
(1) (2) (3) (4) (5) (6)
lgdp lgdp lgdp lgdp lgdp lgdp
lagri 0.039 0.049+
0.033 0.025 0.048 0.054+
(0.260) (0.073) (0.282) (0.446) (0.117) (0.064)
leduc 0.091 0.112 0.020**
0.077 0.015*
0.035**
(0.237) (0.124) (0.007) (0.276) (0.010) (0.004)
lheal -0.175*
0.016 0.025 0.044 0.030 0.098+
(0.013) (0.803) (0.675) (0.501) (0.610) (0.090)
lmilit 0.107**
0.117**
0.077*
0.073*
0.075*
0.068*
(0.001) (0.000) (0.014) (0.026) (0.017) (0.019)
lcagdp 0.089*
0.108*
0.085*
0.107*
0.088*
0.132**
(0.043) (0.014) (0.040) (0.016) (0.032) (0.001)
lpri -0.047+
-0.024 0.043 0.027 0.045 0.059*
(0.079) (0.427) (0.146) (0.352) (0.128) (0.039)
llab 1.958**
1.812**
1.752**
1.825**
1.800**
(0.000) (0.000) (0.000) (0.000) (0.000)
ltra 0.037 0.005 0.043 0.022
(0.515) (0.939) (0.438) (0.677)
infl -0.008**
-0.009**
-0.008**
-0.007**
(0.000) (0.000) (0.000) (0.000)
ind 0.0214**
0.0154
(0.001) (0.256)
qdi 0.00683 0.0915**
(0.636) (0.000)
ipr 0.0141**
0.0247**
(0.000) (0.003)
Spatial
Rho 0.162*
0.239**
0.230**
0.230**
0.228**
0.219**
(0.029) (0.000) (0.000) (0.000) (0.000) (0.000)
Lambda 0.205**
-0.061 -0.075 -0.040 -0.082 -0.130**
(0.000) (0.188) (0.167) (0.567) (0.109) (0.005)
Analysis of Public Investment Expenditure on Economic Growth in WAEMU Countries
www.ijbmi.org 68 | Page
Variance
sigma2_e 0.044**
0.039**
0.032**
0.033**
0.031**
0.028**
(0.000) (0.000) (0.000) (0.000) (0.000) (0.000)
N 200 200 200 200 200 200
p-values in parentheses
+
p< 0.1, *
p< 0.05, **
p< 0.01
Source: BCEAO, IMF, WB, IFPRI and SIPRI, Freedom House.

More Related Content

What's hot

The Role of Government in Economic Development
The Role of Government in Economic DevelopmentThe Role of Government in Economic Development
The Role of Government in Economic DevelopmentRima Doot
 
Government expenditure
Government expenditureGovernment expenditure
Government expenditureYougal Chettri
 
Review of theories of public expenditure and public revenue
Review of theories of public expenditure and public revenueReview of theories of public expenditure and public revenue
Review of theories of public expenditure and public revenuebusari rasheed ajibola
 
Development Vocab part 1
Development Vocab part 1Development Vocab part 1
Development Vocab part 1Dustin Blohm
 
Cointegration of public sector expenditure patterns and growth of nigeria
Cointegration of public sector expenditure patterns and growth of nigeriaCointegration of public sector expenditure patterns and growth of nigeria
Cointegration of public sector expenditure patterns and growth of nigeriaAlexander Decker
 
An Analysis of the Relationship between Fiscal Deficits and Selected Macroeco...
An Analysis of the Relationship between Fiscal Deficits and Selected Macroeco...An Analysis of the Relationship between Fiscal Deficits and Selected Macroeco...
An Analysis of the Relationship between Fiscal Deficits and Selected Macroeco...IOSR Journals
 
National Income, Strategic Discontinuity, and Converging Trajectories of Macr...
National Income, Strategic Discontinuity, and Converging Trajectories of Macr...National Income, Strategic Discontinuity, and Converging Trajectories of Macr...
National Income, Strategic Discontinuity, and Converging Trajectories of Macr...Przegląd Politologiczny
 
Public expenditure
Public expenditurePublic expenditure
Public expenditurePallavi Kaul
 
Impact ofExpanding Economic Activities onGovernment Expenditure inNigeria
Impact ofExpanding Economic Activities onGovernment Expenditure inNigeriaImpact ofExpanding Economic Activities onGovernment Expenditure inNigeria
Impact ofExpanding Economic Activities onGovernment Expenditure inNigeriaiosrjce
 
Public expenditure
Public expenditurePublic expenditure
Public expenditureBENCYPRISCA
 
Government & the Economy
Government & the EconomyGovernment & the Economy
Government & the EconomyBSTAI
 
Presentation public finance
Presentation public financePresentation public finance
Presentation public financejyotsanalal
 
Economic Function of Government
Economic Function of GovernmentEconomic Function of Government
Economic Function of GovernmentTimothy Smith
 
Introduction to Public Finance
Introduction to Public FinanceIntroduction to Public Finance
Introduction to Public FinanceATMANSHAH8
 
The Emerging Pattern of Structural Change
 The Emerging Pattern of Structural Change The Emerging Pattern of Structural Change
The Emerging Pattern of Structural ChangeMd Shaifullar Rabbi
 
Public expenditure
Public expenditurePublic expenditure
Public expenditurejyotsanalal
 

What's hot (18)

The Role of Government in Economic Development
The Role of Government in Economic DevelopmentThe Role of Government in Economic Development
The Role of Government in Economic Development
 
Government expenditure
Government expenditureGovernment expenditure
Government expenditure
 
Review of theories of public expenditure and public revenue
Review of theories of public expenditure and public revenueReview of theories of public expenditure and public revenue
Review of theories of public expenditure and public revenue
 
Development Vocab part 1
Development Vocab part 1Development Vocab part 1
Development Vocab part 1
 
Effect of Aggregated and Disaggregated Public Spending On the Nigerian Econom...
Effect of Aggregated and Disaggregated Public Spending On the Nigerian Econom...Effect of Aggregated and Disaggregated Public Spending On the Nigerian Econom...
Effect of Aggregated and Disaggregated Public Spending On the Nigerian Econom...
 
Cointegration of public sector expenditure patterns and growth of nigeria
Cointegration of public sector expenditure patterns and growth of nigeriaCointegration of public sector expenditure patterns and growth of nigeria
Cointegration of public sector expenditure patterns and growth of nigeria
 
An Analysis of the Relationship between Fiscal Deficits and Selected Macroeco...
An Analysis of the Relationship between Fiscal Deficits and Selected Macroeco...An Analysis of the Relationship between Fiscal Deficits and Selected Macroeco...
An Analysis of the Relationship between Fiscal Deficits and Selected Macroeco...
 
National Income, Strategic Discontinuity, and Converging Trajectories of Macr...
National Income, Strategic Discontinuity, and Converging Trajectories of Macr...National Income, Strategic Discontinuity, and Converging Trajectories of Macr...
National Income, Strategic Discontinuity, and Converging Trajectories of Macr...
 
Public expenditure
Public expenditurePublic expenditure
Public expenditure
 
Impact ofExpanding Economic Activities onGovernment Expenditure inNigeria
Impact ofExpanding Economic Activities onGovernment Expenditure inNigeriaImpact ofExpanding Economic Activities onGovernment Expenditure inNigeria
Impact ofExpanding Economic Activities onGovernment Expenditure inNigeria
 
Public expenditure
Public expenditurePublic expenditure
Public expenditure
 
Government & the Economy
Government & the EconomyGovernment & the Economy
Government & the Economy
 
Presentation public finance
Presentation public financePresentation public finance
Presentation public finance
 
Public expenditures
Public expendituresPublic expenditures
Public expenditures
 
Economic Function of Government
Economic Function of GovernmentEconomic Function of Government
Economic Function of Government
 
Introduction to Public Finance
Introduction to Public FinanceIntroduction to Public Finance
Introduction to Public Finance
 
The Emerging Pattern of Structural Change
 The Emerging Pattern of Structural Change The Emerging Pattern of Structural Change
The Emerging Pattern of Structural Change
 
Public expenditure
Public expenditurePublic expenditure
Public expenditure
 

Similar to Analysis of Public Investment Expenditure on Economic Growth in WAEMU Countries

Public expenditure and economic growth nexus in nigeria a time series analysis
Public expenditure and economic growth nexus in nigeria a time series analysisPublic expenditure and economic growth nexus in nigeria a time series analysis
Public expenditure and economic growth nexus in nigeria a time series analysisAlexander Decker
 
Assessing the role of public spending for sustainable growth empirical eviden...
Assessing the role of public spending for sustainable growth empirical eviden...Assessing the role of public spending for sustainable growth empirical eviden...
Assessing the role of public spending for sustainable growth empirical eviden...Alexander Decker
 
11.assessing the role of public spending for sustainable growth empirical evi...
11.assessing the role of public spending for sustainable growth empirical evi...11.assessing the role of public spending for sustainable growth empirical evi...
11.assessing the role of public spending for sustainable growth empirical evi...Alexander Decker
 
21 amassoma ditimi -219-237
21 amassoma ditimi -219-23721 amassoma ditimi -219-237
21 amassoma ditimi -219-237Alexander Decker
 
Economic growth and wagner’s hypothesis the nigerian experience
Economic growth and wagner’s hypothesis the nigerian experienceEconomic growth and wagner’s hypothesis the nigerian experience
Economic growth and wagner’s hypothesis the nigerian experienceAlexander Decker
 
Effect of public investment on economic growth in bangladesh
Effect of public investment on  economic growth in bangladeshEffect of public investment on  economic growth in bangladesh
Effect of public investment on economic growth in bangladeshAlexander Decker
 
Does government spending spur economic growth evidence from nigeria
Does government spending spur economic growth  evidence from nigeriaDoes government spending spur economic growth  evidence from nigeria
Does government spending spur economic growth evidence from nigeriaAlexander Decker
 
Budget implementation and economic growth in nigeria
Budget implementation and economic growth in nigeriaBudget implementation and economic growth in nigeria
Budget implementation and economic growth in nigeriaAlexander Decker
 
The Economic Development Of A Nation
The Economic Development Of A NationThe Economic Development Of A Nation
The Economic Development Of A NationKim Moore
 
14 - Population projections revisited, part 3 (2015) (ENG)
14 - Population projections revisited, part 3 (2015) (ENG)14 - Population projections revisited, part 3 (2015) (ENG)
14 - Population projections revisited, part 3 (2015) (ENG)InstitutoBBVAdePensiones
 
Afonso et al 2022 - Do financial markets reward government spending efficienc...
Afonso et al 2022 - Do financial markets reward government spending efficienc...Afonso et al 2022 - Do financial markets reward government spending efficienc...
Afonso et al 2022 - Do financial markets reward government spending efficienc...JorgeAlbertoGuerra
 
Effects of fiscal policy on private investment and economic growth in kenya
Effects of fiscal policy on private investment and economic growth in kenyaEffects of fiscal policy on private investment and economic growth in kenya
Effects of fiscal policy on private investment and economic growth in kenyaAlexander Decker
 
Analysis Effect of Household Consumption, Private Investment and Regional Exp...
Analysis Effect of Household Consumption, Private Investment and Regional Exp...Analysis Effect of Household Consumption, Private Investment and Regional Exp...
Analysis Effect of Household Consumption, Private Investment and Regional Exp...AJHSSR Journal
 
Economic Determinants of Government Consumption Expenditure in Kenya
Economic Determinants of Government Consumption Expenditure in KenyaEconomic Determinants of Government Consumption Expenditure in Kenya
Economic Determinants of Government Consumption Expenditure in KenyaDR. MWENGEI OMBABA (Ph.D)
 
An empirical analysis of the structure and growth of federal government expen...
An empirical analysis of the structure and growth of federal government expen...An empirical analysis of the structure and growth of federal government expen...
An empirical analysis of the structure and growth of federal government expen...Alexander Decker
 
The Economic And Social Development Plan
The Economic And Social Development PlanThe Economic And Social Development Plan
The Economic And Social Development PlanJennifer Reither
 
Fiscal administration 2 ppt
Fiscal administration 2 pptFiscal administration 2 ppt
Fiscal administration 2 pptLouie Medinaceli
 

Similar to Analysis of Public Investment Expenditure on Economic Growth in WAEMU Countries (20)

Public expenditure and economic growth nexus in nigeria a time series analysis
Public expenditure and economic growth nexus in nigeria a time series analysisPublic expenditure and economic growth nexus in nigeria a time series analysis
Public expenditure and economic growth nexus in nigeria a time series analysis
 
Government Expenditure and Economic Growth in Nigeria, 1981-2013: A Bound Tes...
Government Expenditure and Economic Growth in Nigeria, 1981-2013: A Bound Tes...Government Expenditure and Economic Growth in Nigeria, 1981-2013: A Bound Tes...
Government Expenditure and Economic Growth in Nigeria, 1981-2013: A Bound Tes...
 
Assessing the role of public spending for sustainable growth empirical eviden...
Assessing the role of public spending for sustainable growth empirical eviden...Assessing the role of public spending for sustainable growth empirical eviden...
Assessing the role of public spending for sustainable growth empirical eviden...
 
11.assessing the role of public spending for sustainable growth empirical evi...
11.assessing the role of public spending for sustainable growth empirical evi...11.assessing the role of public spending for sustainable growth empirical evi...
11.assessing the role of public spending for sustainable growth empirical evi...
 
21 amassoma ditimi -219-237
21 amassoma ditimi -219-23721 amassoma ditimi -219-237
21 amassoma ditimi -219-237
 
Economic growth and wagner’s hypothesis the nigerian experience
Economic growth and wagner’s hypothesis the nigerian experienceEconomic growth and wagner’s hypothesis the nigerian experience
Economic growth and wagner’s hypothesis the nigerian experience
 
Effect of public investment on economic growth in bangladesh
Effect of public investment on  economic growth in bangladeshEffect of public investment on  economic growth in bangladesh
Effect of public investment on economic growth in bangladesh
 
Does government spending spur economic growth evidence from nigeria
Does government spending spur economic growth  evidence from nigeriaDoes government spending spur economic growth  evidence from nigeria
Does government spending spur economic growth evidence from nigeria
 
Budget implementation and economic growth in nigeria
Budget implementation and economic growth in nigeriaBudget implementation and economic growth in nigeria
Budget implementation and economic growth in nigeria
 
The Economic Development Of A Nation
The Economic Development Of A NationThe Economic Development Of A Nation
The Economic Development Of A Nation
 
14 - Population projections revisited, part 3 (2015) (ENG)
14 - Population projections revisited, part 3 (2015) (ENG)14 - Population projections revisited, part 3 (2015) (ENG)
14 - Population projections revisited, part 3 (2015) (ENG)
 
Afonso et al 2022 - Do financial markets reward government spending efficienc...
Afonso et al 2022 - Do financial markets reward government spending efficienc...Afonso et al 2022 - Do financial markets reward government spending efficienc...
Afonso et al 2022 - Do financial markets reward government spending efficienc...
 
Governance and Economic Growth in Africa
Governance and Economic Growth in AfricaGovernance and Economic Growth in Africa
Governance and Economic Growth in Africa
 
Effects of fiscal policy on private investment and economic growth in kenya
Effects of fiscal policy on private investment and economic growth in kenyaEffects of fiscal policy on private investment and economic growth in kenya
Effects of fiscal policy on private investment and economic growth in kenya
 
Analysis Effect of Household Consumption, Private Investment and Regional Exp...
Analysis Effect of Household Consumption, Private Investment and Regional Exp...Analysis Effect of Household Consumption, Private Investment and Regional Exp...
Analysis Effect of Household Consumption, Private Investment and Regional Exp...
 
Demographi dvident
Demographi dvidentDemographi dvident
Demographi dvident
 
Economic Determinants of Government Consumption Expenditure in Kenya
Economic Determinants of Government Consumption Expenditure in KenyaEconomic Determinants of Government Consumption Expenditure in Kenya
Economic Determinants of Government Consumption Expenditure in Kenya
 
An empirical analysis of the structure and growth of federal government expen...
An empirical analysis of the structure and growth of federal government expen...An empirical analysis of the structure and growth of federal government expen...
An empirical analysis of the structure and growth of federal government expen...
 
The Economic And Social Development Plan
The Economic And Social Development PlanThe Economic And Social Development Plan
The Economic And Social Development Plan
 
Fiscal administration 2 ppt
Fiscal administration 2 pptFiscal administration 2 ppt
Fiscal administration 2 ppt
 

Recently uploaded

UNIT-V FMM.HYDRAULIC TURBINE - Construction and working
UNIT-V FMM.HYDRAULIC TURBINE - Construction and workingUNIT-V FMM.HYDRAULIC TURBINE - Construction and working
UNIT-V FMM.HYDRAULIC TURBINE - Construction and workingrknatarajan
 
High Profile Call Girls Nagpur Isha Call 7001035870 Meet With Nagpur Escorts
High Profile Call Girls Nagpur Isha Call 7001035870 Meet With Nagpur EscortsHigh Profile Call Girls Nagpur Isha Call 7001035870 Meet With Nagpur Escorts
High Profile Call Girls Nagpur Isha Call 7001035870 Meet With Nagpur Escortsranjana rawat
 
(PRIYA) Rajgurunagar Call Girls Just Call 7001035870 [ Cash on Delivery ] Pun...
(PRIYA) Rajgurunagar Call Girls Just Call 7001035870 [ Cash on Delivery ] Pun...(PRIYA) Rajgurunagar Call Girls Just Call 7001035870 [ Cash on Delivery ] Pun...
(PRIYA) Rajgurunagar Call Girls Just Call 7001035870 [ Cash on Delivery ] Pun...ranjana rawat
 
(ANVI) Koregaon Park Call Girls Just Call 7001035870 [ Cash on Delivery ] Pun...
(ANVI) Koregaon Park Call Girls Just Call 7001035870 [ Cash on Delivery ] Pun...(ANVI) Koregaon Park Call Girls Just Call 7001035870 [ Cash on Delivery ] Pun...
(ANVI) Koregaon Park Call Girls Just Call 7001035870 [ Cash on Delivery ] Pun...ranjana rawat
 
Processing & Properties of Floor and Wall Tiles.pptx
Processing & Properties of Floor and Wall Tiles.pptxProcessing & Properties of Floor and Wall Tiles.pptx
Processing & Properties of Floor and Wall Tiles.pptxpranjaldaimarysona
 
Introduction to IEEE STANDARDS and its different types.pptx
Introduction to IEEE STANDARDS and its different types.pptxIntroduction to IEEE STANDARDS and its different types.pptx
Introduction to IEEE STANDARDS and its different types.pptxupamatechverse
 
Call Girls Service Nashik Vaishnavi 7001305949 Independent Escort Service Nashik
Call Girls Service Nashik Vaishnavi 7001305949 Independent Escort Service NashikCall Girls Service Nashik Vaishnavi 7001305949 Independent Escort Service Nashik
Call Girls Service Nashik Vaishnavi 7001305949 Independent Escort Service NashikCall Girls in Nagpur High Profile
 
(SHREYA) Chakan Call Girls Just Call 7001035870 [ Cash on Delivery ] Pune Esc...
(SHREYA) Chakan Call Girls Just Call 7001035870 [ Cash on Delivery ] Pune Esc...(SHREYA) Chakan Call Girls Just Call 7001035870 [ Cash on Delivery ] Pune Esc...
(SHREYA) Chakan Call Girls Just Call 7001035870 [ Cash on Delivery ] Pune Esc...ranjana rawat
 
College Call Girls Nashik Nehal 7001305949 Independent Escort Service Nashik
College Call Girls Nashik Nehal 7001305949 Independent Escort Service NashikCollege Call Girls Nashik Nehal 7001305949 Independent Escort Service Nashik
College Call Girls Nashik Nehal 7001305949 Independent Escort Service NashikCall Girls in Nagpur High Profile
 
CCS335 _ Neural Networks and Deep Learning Laboratory_Lab Complete Record
CCS335 _ Neural Networks and Deep Learning Laboratory_Lab Complete RecordCCS335 _ Neural Networks and Deep Learning Laboratory_Lab Complete Record
CCS335 _ Neural Networks and Deep Learning Laboratory_Lab Complete RecordAsst.prof M.Gokilavani
 
Call Girls Pimpri Chinchwad Call Me 7737669865 Budget Friendly No Advance Boo...
Call Girls Pimpri Chinchwad Call Me 7737669865 Budget Friendly No Advance Boo...Call Girls Pimpri Chinchwad Call Me 7737669865 Budget Friendly No Advance Boo...
Call Girls Pimpri Chinchwad Call Me 7737669865 Budget Friendly No Advance Boo...roncy bisnoi
 
Java Programming :Event Handling(Types of Events)
Java Programming :Event Handling(Types of Events)Java Programming :Event Handling(Types of Events)
Java Programming :Event Handling(Types of Events)simmis5
 
MANUFACTURING PROCESS-II UNIT-1 THEORY OF METAL CUTTING
MANUFACTURING PROCESS-II UNIT-1 THEORY OF METAL CUTTINGMANUFACTURING PROCESS-II UNIT-1 THEORY OF METAL CUTTING
MANUFACTURING PROCESS-II UNIT-1 THEORY OF METAL CUTTINGSIVASHANKAR N
 
High Profile Call Girls Nagpur Meera Call 7001035870 Meet With Nagpur Escorts
High Profile Call Girls Nagpur Meera Call 7001035870 Meet With Nagpur EscortsHigh Profile Call Girls Nagpur Meera Call 7001035870 Meet With Nagpur Escorts
High Profile Call Girls Nagpur Meera Call 7001035870 Meet With Nagpur EscortsCall Girls in Nagpur High Profile
 
Introduction to Multiple Access Protocol.pptx
Introduction to Multiple Access Protocol.pptxIntroduction to Multiple Access Protocol.pptx
Introduction to Multiple Access Protocol.pptxupamatechverse
 
Call for Papers - Educational Administration: Theory and Practice, E-ISSN: 21...
Call for Papers - Educational Administration: Theory and Practice, E-ISSN: 21...Call for Papers - Educational Administration: Theory and Practice, E-ISSN: 21...
Call for Papers - Educational Administration: Theory and Practice, E-ISSN: 21...Christo Ananth
 
Booking open Available Pune Call Girls Pargaon 6297143586 Call Hot Indian Gi...
Booking open Available Pune Call Girls Pargaon  6297143586 Call Hot Indian Gi...Booking open Available Pune Call Girls Pargaon  6297143586 Call Hot Indian Gi...
Booking open Available Pune Call Girls Pargaon 6297143586 Call Hot Indian Gi...Call Girls in Nagpur High Profile
 
result management system report for college project
result management system report for college projectresult management system report for college project
result management system report for college projectTonystark477637
 
Porous Ceramics seminar and technical writing
Porous Ceramics seminar and technical writingPorous Ceramics seminar and technical writing
Porous Ceramics seminar and technical writingrakeshbaidya232001
 

Recently uploaded (20)

UNIT-V FMM.HYDRAULIC TURBINE - Construction and working
UNIT-V FMM.HYDRAULIC TURBINE - Construction and workingUNIT-V FMM.HYDRAULIC TURBINE - Construction and working
UNIT-V FMM.HYDRAULIC TURBINE - Construction and working
 
High Profile Call Girls Nagpur Isha Call 7001035870 Meet With Nagpur Escorts
High Profile Call Girls Nagpur Isha Call 7001035870 Meet With Nagpur EscortsHigh Profile Call Girls Nagpur Isha Call 7001035870 Meet With Nagpur Escorts
High Profile Call Girls Nagpur Isha Call 7001035870 Meet With Nagpur Escorts
 
(PRIYA) Rajgurunagar Call Girls Just Call 7001035870 [ Cash on Delivery ] Pun...
(PRIYA) Rajgurunagar Call Girls Just Call 7001035870 [ Cash on Delivery ] Pun...(PRIYA) Rajgurunagar Call Girls Just Call 7001035870 [ Cash on Delivery ] Pun...
(PRIYA) Rajgurunagar Call Girls Just Call 7001035870 [ Cash on Delivery ] Pun...
 
(ANVI) Koregaon Park Call Girls Just Call 7001035870 [ Cash on Delivery ] Pun...
(ANVI) Koregaon Park Call Girls Just Call 7001035870 [ Cash on Delivery ] Pun...(ANVI) Koregaon Park Call Girls Just Call 7001035870 [ Cash on Delivery ] Pun...
(ANVI) Koregaon Park Call Girls Just Call 7001035870 [ Cash on Delivery ] Pun...
 
Processing & Properties of Floor and Wall Tiles.pptx
Processing & Properties of Floor and Wall Tiles.pptxProcessing & Properties of Floor and Wall Tiles.pptx
Processing & Properties of Floor and Wall Tiles.pptx
 
Introduction to IEEE STANDARDS and its different types.pptx
Introduction to IEEE STANDARDS and its different types.pptxIntroduction to IEEE STANDARDS and its different types.pptx
Introduction to IEEE STANDARDS and its different types.pptx
 
Call Girls Service Nashik Vaishnavi 7001305949 Independent Escort Service Nashik
Call Girls Service Nashik Vaishnavi 7001305949 Independent Escort Service NashikCall Girls Service Nashik Vaishnavi 7001305949 Independent Escort Service Nashik
Call Girls Service Nashik Vaishnavi 7001305949 Independent Escort Service Nashik
 
(SHREYA) Chakan Call Girls Just Call 7001035870 [ Cash on Delivery ] Pune Esc...
(SHREYA) Chakan Call Girls Just Call 7001035870 [ Cash on Delivery ] Pune Esc...(SHREYA) Chakan Call Girls Just Call 7001035870 [ Cash on Delivery ] Pune Esc...
(SHREYA) Chakan Call Girls Just Call 7001035870 [ Cash on Delivery ] Pune Esc...
 
College Call Girls Nashik Nehal 7001305949 Independent Escort Service Nashik
College Call Girls Nashik Nehal 7001305949 Independent Escort Service NashikCollege Call Girls Nashik Nehal 7001305949 Independent Escort Service Nashik
College Call Girls Nashik Nehal 7001305949 Independent Escort Service Nashik
 
CCS335 _ Neural Networks and Deep Learning Laboratory_Lab Complete Record
CCS335 _ Neural Networks and Deep Learning Laboratory_Lab Complete RecordCCS335 _ Neural Networks and Deep Learning Laboratory_Lab Complete Record
CCS335 _ Neural Networks and Deep Learning Laboratory_Lab Complete Record
 
Call Girls Pimpri Chinchwad Call Me 7737669865 Budget Friendly No Advance Boo...
Call Girls Pimpri Chinchwad Call Me 7737669865 Budget Friendly No Advance Boo...Call Girls Pimpri Chinchwad Call Me 7737669865 Budget Friendly No Advance Boo...
Call Girls Pimpri Chinchwad Call Me 7737669865 Budget Friendly No Advance Boo...
 
Java Programming :Event Handling(Types of Events)
Java Programming :Event Handling(Types of Events)Java Programming :Event Handling(Types of Events)
Java Programming :Event Handling(Types of Events)
 
MANUFACTURING PROCESS-II UNIT-1 THEORY OF METAL CUTTING
MANUFACTURING PROCESS-II UNIT-1 THEORY OF METAL CUTTINGMANUFACTURING PROCESS-II UNIT-1 THEORY OF METAL CUTTING
MANUFACTURING PROCESS-II UNIT-1 THEORY OF METAL CUTTING
 
High Profile Call Girls Nagpur Meera Call 7001035870 Meet With Nagpur Escorts
High Profile Call Girls Nagpur Meera Call 7001035870 Meet With Nagpur EscortsHigh Profile Call Girls Nagpur Meera Call 7001035870 Meet With Nagpur Escorts
High Profile Call Girls Nagpur Meera Call 7001035870 Meet With Nagpur Escorts
 
Introduction to Multiple Access Protocol.pptx
Introduction to Multiple Access Protocol.pptxIntroduction to Multiple Access Protocol.pptx
Introduction to Multiple Access Protocol.pptx
 
Call for Papers - Educational Administration: Theory and Practice, E-ISSN: 21...
Call for Papers - Educational Administration: Theory and Practice, E-ISSN: 21...Call for Papers - Educational Administration: Theory and Practice, E-ISSN: 21...
Call for Papers - Educational Administration: Theory and Practice, E-ISSN: 21...
 
Booking open Available Pune Call Girls Pargaon 6297143586 Call Hot Indian Gi...
Booking open Available Pune Call Girls Pargaon  6297143586 Call Hot Indian Gi...Booking open Available Pune Call Girls Pargaon  6297143586 Call Hot Indian Gi...
Booking open Available Pune Call Girls Pargaon 6297143586 Call Hot Indian Gi...
 
DJARUM4D - SLOT GACOR ONLINE | SLOT DEMO ONLINE
DJARUM4D - SLOT GACOR ONLINE | SLOT DEMO ONLINEDJARUM4D - SLOT GACOR ONLINE | SLOT DEMO ONLINE
DJARUM4D - SLOT GACOR ONLINE | SLOT DEMO ONLINE
 
result management system report for college project
result management system report for college projectresult management system report for college project
result management system report for college project
 
Porous Ceramics seminar and technical writing
Porous Ceramics seminar and technical writingPorous Ceramics seminar and technical writing
Porous Ceramics seminar and technical writing
 

Analysis of Public Investment Expenditure on Economic Growth in WAEMU Countries

  • 1. International Journal of Business and Management Invention ISSN (Online): 2319 – 8028, ISSN (Print): 2319 – 801X www.ijbmi.org || Volume 6 Issue 5 || May. 2017 || PP—49-67 www.ijbmi.org 49 | Page Analysis of Public Investment Expenditure on Economic Growth in WAEMU Countries Rémy Hounsou, Ph.D. Ecole Nationale d’Economie Appliquée et de Management (ENEAM), Université d’Abomey Calavi, BENIN. Abstract: Public investment expenditure plays an important role in the economy to produce goods and services needed for economic development. This study analyzes the influence of public investment spending on the economic growth of the WAEMU zone. The study considers a linear approach through individual fixed effects models with Beck-Katz and Driscoll-Kraay corrections, the spatial autocorrelation model (SAC) and the long- term model (DOLS). The empirical results of the study using panel data covering the period 1990-2015 indicate that public investment spending can promote economic growth in WAEMU countries when they are allocated in decreasing order to Education, health, public investment in basic road infrastructure and agriculture. However, they are also likely to slow it down when they focus on military spending, even though their primary objective is to ensure security for economic development. Finally, the study recommends that policy makers in WAEMU countries refocus their public expenditure policies in key sectors of development, notably human capital, in order to ensure a multiplier effect of public spending on economic growth and strengthen institutions Democracy to ensure their independence through their interdependence. Keywords: Public investment expenditure, economic growth, panel data, WAEMU. JOL: C10 - C33 - H50 - O11 - P35 I. INTRODUCTION Among the functions performed by the government, such as allocation, distribution and stabilization, the allocation function is related to the role of government in producing goods and services for which social benefits are different from net profits of the private sector. Such products include national defense, education, infrastructure, etc. The government may be able to provide these products more efficiently than the private sector. Thus, the responsibility of the State is crucial through a policy of public investment to strengthen the productive capacities of a country. However, for an efficient use of resources in relation to growth objectives, it is necessary to question the quality of investments made by a State. Moreover, in a context where financial resources must be optimally exploited, it is necessary for a State to control the scope of its expenditure for the benefit of different sectors of the economy in order to have a more significant impact on economic development and fight more effectively against poverty. Investment is an important factor in economic growth. Also, investment spending remained a tool for capital growth for the private sector. But, in a modern dynamic of finance, the public sector must not only maintain but also increase public wealth. Thus, the theoretical debate arises as to whether the private sector or the public sector should ensure public investment expenditure. There are divergent views among economists on this issue. A distinction is made between those for whom the State simply has to enact and enforce the fundamental laws of society and, on the other hand, to establish a framework within which firms can engage in fair competition. There are those for whom the state must stimulate economic activity by acting on its components (creation of public jobs, lower interest rates, public investments, etc.). Finally, there are those for whom public action is justified mainly by the presence of public goods. For the classics in fact, the State must simply ensure the smooth running of the city. Smith (1776) finds that the state must only perform its regal function by protecting society and the nation from the outside, protecting individuals, building and maintaining public institutions. For Keynesians, on the other hand, the state, through fiscal modulation, can manipulate taxes and public spending to stabilize the economy. Unlike the Keynesians, public school theorists believe that the state must intervene when the good by its nature is indivisible and whose use by one more person has no cost. Individually, therefore, it is difficult to agree on the financing of goods that provide usefulness that is difficult to quantify for each other. Theorists of endogenous growth are also in favor of public action. Boyer and Durand (1998) state that "in the absence of coordination organized by the State or collective organizations, an initially poor country can be permanently in a poverty trap. On the other hand, a synchronization of investment or innovation can overcome this obstacle and lead to stronger growth, benefiting society as a whole. Thus, the State may be at the origin of a creation of additional wealth ". In the light of all the above, public investment expenditure plays an important role in the economy to produce goods and services. These expenditures are among others, education, health, roads, energy, industrial products, agricultural products. However, the debate on the effectiveness of public spending as an instrument of
  • 2. Analysis of Public Investment Expenditure on Economic Growth in WAEMU Countries www.ijbmi.org 50 | Page economic regulation has been considerable, both in terms of the number of theoretical and empirical studies and the importance of Implications in terms of economic policies. Hence, there is no consensus either on the theoretical level or on the empirical level. Thus, our study proposes to study public investment expenditure at the level of WAEMU countries: Benin, Burkina Faso, Côte d'Ivoire, Guinea Bissau, Mali, Niger, Senegal and Togo. These countries are part of the same monetary zone and cannot use monetary policy intrinsically to stabilize their economies. Only the fiscal policy remains the only adjustment instrument available to these countries and whose investment expenditure remains a privileged tool. Thus, the control of public spending is governed by compliance with the convergence criteria imposed on all the Member States of the Union. Analyzes of the impact of existing public spending in the empirical literature in most African countries most often use simple linear models, error correction models (Nubukpo, 2007), or models based on Causality in the sense of Granger (Chimobi, 2009). Other studies use panel data such as ordinary least squares (Tenou, 1999) and the smooth transition model PSTR -Panel Smooth Threshold Regression (Fouopi et al., 2014). All studies of panel data seem to ignore spatial dependence issues a priori and take this into account in modeling. Moreover, most studies also ignore the composition of public investment spending allocated to key sectors of the economy (agriculture, education, health, basic infrastructure, military, etc.). To address these shortcomings, our study analyzes both the short-term and long-term effects of public investment expenditure on the economic growth of WAEMU countries over the period 1990-2015 using panel data. The study also incorporates the geographic dimension of the data in the estimation of the growth model. The rest of the paper is organized as follows: Section 2 discusses the literature review. Section 3 presents the methodological framework whose results are analyzed in Section 4. Section 5 concludes the work. II. LITERATURE REVIEW To account for the productive nature of public investment, several empirical studies were carried out in the 1980s by Aschauer (1989b and 1990). In its specification of the model, Aschauer (1989b) adds to the production function of the Cobb-Douglas type a flow of productive services of government capital. This function is of the form Y = Af (K, L, G) where Y = Production; A = Level of technology or technical progress; K = physical capital; L = Work; and G = Public capital. It uses aggregate time series data from the US economy to examine the relationship between public infrastructure investment and private sector output. It concludes that the basic infrastructure of streets, roads, airports, transit systems, sewer and water systems, etc., had the greatest explanatory power over productivity and that the slowdown in productivity after 1973 in the US economy can be attributed in large part to the slowdown in public investment. Barro (1991) conducted a study of 98 countries using OLS regression. The results show that the variables that positively influence the growth rate of real per capita GDP are human capital and policy stability measures, while government spending and market distortions as measured by the GDP deflator negatively influence the growth rate of real GDP per capita. In the same vein, Barro and Sala-i-Martin (1995) also used a large number of countries over the period 1965-1985 to regress the average growth rate on several macroeconomic variables including the level of education attained and the share In the GDP of public spending on education. Their main results are that the level of education attained (measured by the number of years of education) is significantly correlated with future growth, although the decomposition of the aggregate measure of education achieved shows that the impact of primary education remains largely insignificant, and that public spending on education also has a positive and significant effect on growth. Indeed, a 1.5% increase in the ratio of public expenditure on education to GDP during the period 1965-1985 would have increased the average growth rate during the same period of 0.3% per year. Andreosso-O'Callaghan (2002) in an econometric study using panel data for the 1980s, 1990s and 1997, covering 10 Asian countries (China, south Korea, India, Indonesia, Japan, Malaysia, the Philippines, Singapore, Thailand and Vietnam) finds that human capital approximated by literacy or schooling plays an essential role in production and hence in the economic growth of these countries. This result is corroborated by the study by Aghion and Cohen (2004) using panel-based regressions for a group of 110 countries over the period 1960-2000. By approximating human capital by the number of years of study of the labor force, they also find that the accumulation of this factor human capital positively affects economic growth. Djistera (2008) estimates the effect of human capital accumulation on economic growth using panel data from 9 Asian economies (China, South Korea, Hong Kong, India, Indonesia, Malaysia, the Philippines, Singapore and Thailand) for the period 1971-2003. He finds that the accumulation of human capital has a positive and significant effect on economic growth with a coefficient of 0.078. According to this result, an increase in the level of human capital in the labor force indicates a higher rate of growth. Studies are carried out at the level of developing countries to measure the effects of public investment expenditure. Khan and Kumar (1997) test a sample of 95 developing countries for a conditional convergence equation by integrating the private and public investment rate among various control variables. The estimated coefficients are significantly positive. The impact of private investment is approximately twice that of public investment over the overall 1970-1990 period or more specifically in the decade 1980-1990. On the contrary,
  • 3. Analysis of Public Investment Expenditure on Economic Growth in WAEMU Countries www.ijbmi.org 51 | Page over the decade 1970-1980 the estimated coefficients are Very close to 0.21. The authors conclude that the effectiveness of public investment is weak. Psacharapouloss and Woodall (1985), in their studies of developing countries, find a positive contribution of education to economic growth in the order of 23.2% in Ghana and 16% in Nigeria. Sacerdotti et al. (1998) found in a study of West African countries that investment in human capital did not have a significant effect on economic growth. They justify their result by the lack of structural reforms that must increase the social return to education. Thiam (1999) shows, using data from 40 developing countries, that the increase in saving and investment has a positive effect on per capita GDP. Similarly, Ashipala and Haimbodi (2003) show two long-term relationships between the level of economic activity measured by GDP and public and private investment in Namibia. The results of their study indicate, on the one hand, that an increase in public investment has a positive impact on economic growth and on the other, the existence of complementarily between public and private investment. Using a time-series model estimated by ordinary least squares (OLS), Mansouri (2003) showed that in Morocco, public capital spending has a driving effect on private investment and growth economic. On the other hand, public consumption spending crowds out private investment and slows down economic growth because of waste. It should be noted that current expenditures of an unproductive nature (social security, recreation, economic services) can have a negative effect on growth, while investment spending, especially in infrastructure, generally has a positive effect. Indeed, Gupta et al. (2003) seek to understand the impact of fiscal policy, the structure of spending in 39 low-income countries over the period 1990-2001. The results of their study indicate that an increase in current government spending has a negative effect on growth, while capital spending favors growth. Thus, the increase in current expenditure must be contained in favor of capital expenditure growth. The choice of the allocation of government expenditure to current expenditure or capital expenditure can be a determining factor in boosting growth in developing countries. Fouopi et al. (2014), showed the impact of public spending on economic growth in CEMAC countries through a Panel Smooth Threshold Regression (PSTR) transition model. The results of their study indicate that the positive effect of public spending on economic growth only appears when the ratio of public spending on education and health reaches the thresholds of 8.70% and 10.80%, respectively. Public expenditure on consumption, public investment expenditure and military expenditure positively affect the sensitivity of economic growth to public expenditure up to a threshold of 33% of public expenditure on consumption, a threshold of 48.5% for capital expenditure and 7.2% for military expenditure. For the WAEMU countries, studies have also been conducted to show the effect of public spending on economic growth. Tenou (1999) shows that, on average, per capita growth in these WAEMU countries is significantly influenced by human capital, population growth rate, investment rate, rate of increase in exports and the rate of consumption. Human capital, represented by the secondary school enrollment rate, appears to be the most influential factor. Gurgand (1993) points out in his work on Côte d'Ivoire that more education does not improve the productive efficiency of farmers' productivity and that in the higher education sector the results are even less than in the agricultural sector. Ouattara (2007) highlighted in the WAEMU countries, based on Granger's causality tests, that economic growth and public spending would influence each other. In its study, Nubukpo (2007) shows that over the period 1965-2000, in the short term, total public expenditure has no significant impact on growth in most of the Union's economies. On the other hand, the effect is positive in the long term. Abou (2007), in the same vein as Nubukpo (2007), found a positive link between the level of public investment expenditure and economic growth on the one hand, and on the other hand between the increase in economic activity and the increase in the ratio of public investment expenditure on the total expenditure of the countries of the Union. The lack of convergence in the evoked empirical results leads us in our study to consider on the one hand, the linear approach through models with individual effects and the long-term relationship according to the Kao and Chiang approach (2000 ) and, on the other hand, the spatial dimension through spatial autocorrelation (SAC) models. III. METHODOLOGY 3.1 Empirical specification and data The previous discussion suggests a general empirical formulation of a growth function that gathers several of the empirical specifications used in the studies since that of Aschauer (1989b and 1990) and Barro (1990). In particular, the basic equation used for the econometric estimates is based on the work of Nubukpo (2007), Abou (2007), Fouopi et al. (2014) on real GDP growth in African countries. Like the Nubukpo (2007) study, the dependent variable of our study is the logarithm of real GDP which measures the level of economic activity. It can indicate an increase or a decrease in economic activity. As for the explanatory variables, the study considers that WAEMU countries constitute small open economies with little diversification and whose public investment expenditure is broadly devoted to the four main sectors: agriculture, Education, health and basic infrastructure to which national defense is added. Failure to take into account the energy sector is linked to data availability constraints. In addition to these areas of government intervention, the study incorporates two
  • 4. Analysis of Public Investment Expenditure on Economic Growth in WAEMU Countries www.ijbmi.org 52 | Page other economic policy variables, the labor force and the terms of trade indices, which measure the purchasing power of Imports, that is, the capacity of a country to pay its imports through these exports. A positive development of this index is expected to have a positive effect on economic growth, since it is likely to boost domestic supply dynamics, thereby increasing the economy's ability to meet foreign demand. Moreover, the process of increasing competitiveness it suggests, in addition to foreign exchange earnings and increased domestic savings, may be conducive to economic growth (Nubukpo, 2007). Relative to the working population, Rebelo (1990) introduces in his model the human capital that he designates as the set of training, knowledge and good health of the worker that make it more productive. Lucas (1988) finds that this human capital produces positive externalities. Private investment is included in the model because of its role in wealth creation. Indeed, private investment is a growth factor, both for the neoclassical school and for the Keynesian theory. Moreover, it is likely to generate, in line with the recent results of endogenous growth models (Guellec and Ralle, 1997 quoted by Nubukpo, 2007), effects of technological externalities. The addition of inflation to the model is linked to its relationship to the growth rate. The expected sign of this variable is indeterminate insofar as the value of its parameter depends on the relative changes in the supply of money, the demand for money, and the shock of supply. Finally, three other democracy variables that have positive impacts on economic growth are also introduced into the model. They are the index of democracy, the quality of democratic institutions and the index of political rights. Kornendi and Meguire (1985), Savvides (1995), Rivera-Baltiz (2002), Barro (1995) and Fosu (2008) all show that strong democratic institutions are directly linked to a high quality of governance and there exists a close link between democracy and economic growth. Thus, our model explains the percentage change in GDP in terms of the various public investment spending by sector of the economy, labor as measured by the labor force, the terms of trade index of the economy and the democracy variables such as the index of democracy, the quality of institutions and the index of political rights. In its equation form, our model can then be written as: logGDPi,t = α0 + + α1logAGRIi,t+ α2logEDUCi,t + α3logHEALi,t+ α4logMILITi,t + α5logCAGDPi,t+ α6logPRIi,t + α6logLABi,t + α7logTRAi,t + α8INFLi,t + α9INDi,t + α10QDIi,t + α11IPRi,t + αi,t with: GDP as the real GDP; AGRI, public expenditure on investment in the agricultural sector; EDUC, public expenditure on investment in the education sector; HEAL, public expenditure on investment in the health sector; MILIT, public investment expenditure in the national defense sector; CAGDP, public expenditure on capital investment: for example, expenditure on public infrastructure such as roads, railways, etc. All these expenditures are as a percentage of GDP. PRI, private investment as a percentage of GDP; LAB, the labor force; TRA, the terms of trade index; INFL, the inflation rate. IND refers to the index of democracy in Freedom House's Policy 4 database: it varies from (-10) to the least democratic regimes to (+10) for the most democratic regimes. QDI is a variable measuring the quality of democratic institutions whose index value is between -10 and +10: the higher the index (when positive), the more democratic institutions are of good quality. It is taken from the Policy 4 database of Freedom House. IPR is the index of political rights obtained from the same source. It is used as a proxy of political rights. It makes it possible to take into account the crucial importance of political factors in democracy. According to the Freedom House, a high index reflects a high political risk, which is not conducive to democracy. The "log" function applied to the quantitative economic variables is used to limit the dispersion of the variables. The parameters represent the coefficients to be estimated. From the point of view of macroeconomic theory, the expected signs of all coefficients are positive with the exception of the sign of the coefficients α4 and α8 which may be positive or negative. μi represents the specific effects of the countries and the error term is designated by ε. Finally, indices i and t represent respectively the individual dimension (country index) and the temporal dimension. The beginning of the period (1990) indicates the beginning of the democratic experience for the WAEMU countries. The end of the study period (2015) is justified by the availability of recent data. Data are mostly derived from the International Monetary Fund (IMF), World Bank (WB), Central Bank of West African States (BCEAO) and Freedom House databases. Agricultural spending comes from the IFPRI International Food Policy Research Institute base and military spending comes from data from the Stockholm International Peace Research Institute (SIPRI). 3.2 Methodological approach The analysis concerns the 8 countries of the WAEMU zone because countries may present unobservable individual characteristics that are not taken into account in the aggregated data. The double dimension of panel data is an advantage compared to other types of data, time series and cross-sections. This double dimension makes it possible to simultaneously account for the dynamics of behavior and their possible heterogeneity (Pirotte, 2011, Sevestre, 2002). The interest of this approach lies in the presence of good
  • 5. Analysis of Public Investment Expenditure on Economic Growth in WAEMU Countries www.ijbmi.org 53 | Page properties (asymptotic unbiased estimator, convergent, etc.) which it can guarantee due to the combination of the individual and temporal dimension. First, Hsiao (1989) homogeneity tests and the Hausman (1978), Wooldrige (2002) and Hoechle (2007) specification tests were used to discriminate between the fixed effect model and the random effects model. It should be noted that the modified Hausman tests proposed by Wooldrige (2002) and Hoechle (2007) are more robust than the standard Hausman test. The existence of a cross-sectional spatial dependence can also bias the Hausman statistic. The results of the model specification tests revealed the predominance of the fixed effect model over the random effects model. In addition, the assumption of autocorrelation, heteroskedasticity, and the existence of spatial dependence in the data leads us to estimate the fixed effects model with Beck-Katz (1995) and Driscoll-Kraay (1998). Second, since the temporal dimension (T = 26) is larger than the individual dimension (N = 8), we are then in the presence of a macro Panel (Hsiao, 2014, Pesaran et al. ,2012, Eberhardt, 2011, Pirotte, 2011, Baltagi, 2008). The study of the unit root then becomes important. Our study uses first- and second-generation unit root tests using Panel data (see Baltagi, 2015, Hurlin and Mignon, 2005). The first generation is characterized by the fact that inter-individual dependencies are not taken into account, which on panel data constitutes a strong hypothesis. On the other hand, the second generation removes this hypothesis by considering inter-individual correlations. To test the spatial dependence before the implementation of the second generation tests, we used the spatial dependence tests of Pesaran (2004), Pesaran et al. (2008) and Breusch- Pagan (1980). The cointegration tests of Pedroni (1995, 1999, 2004) carried out indicate a presence of cointegration. Thus, the estimation of the long-term relationship by the Dynamic Ordinary Least Squares (DOLS) approach initially proposed by Kao and Chiang (2000) and then improved by Mark and Sul (2003) will be mobilized. The equation is as follows: where yit is the logarithm of real GDP, xit is the package of explanatory variables, υit is the error term. We note that the equation characterizing the DOLS is the extension of the fixed effects model in which the lags and future leads are included in the cointegration relation in order to produce asymptotically unbiased estimators, avoid the problem of estimating the nuisance parameters. Moreover, based on the Monte Carlo simulation, Kao and Chiang demonstrate that the DOLS is more efficient than the Fully Modified Ordinary Least Squares (FMOLS) and the OLS. One of the constraints of the DOLS approach is that the variables must be integrated in the same order i.e I (1). Finally, our study places special emphasis on space panels. It should be noted that the models presented above do not explicitly take into account the existence of any spatial correlation between countries, which may implicitly exist. The question of the consequences of the negligence of such spatial interdependencies can be asked. Baltagi and Pirotte (2010) show that the effects of not taking spatial dimension into account, if relevant to the economic phenomenon of interest, are considerable on the quality of statistical inference, and can lead to fallacious results. Elhorst (2001, 2003, 2009), Anselin and al. (2008) point out that the introduction of the spatial dimension has become since some years an important research axis on Panel data. Anselin and Bera (1998), Keller and Shive (2007) suggest two main reasons for this renewed interest in economics. The introduction of the spatial dimension aims at capturing two effects: spatial autocorrelation which refers to the lack of independence between geographical observations (in particular), and the spatial heterogeneity linked to the differentiation of variables and behaviors in space. Different specifications can be envisaged in this context. The choice of one of these depends on the context and the complexity of the phenomenon to be studied. These spatial models were highlighted in the growth models by Conley and Ligon (2002), Ertur and Koch (2007). Our reference model, developed by Lee and Yu (2008), combines a spatial autoregressive model with perturbations (1,1), or SAC (Spatial Autoregressive Model), in a set of fixed-area spatial panel data: With Yi t represents the dependent variable (logarithm of the PIB), xi,t the vector of the explanatory variables, W and M the weight matrix. In the case of our study, W = M, and designates the contiguity matrix of format NxN which reflects the geographical proximity between countries across common borders. The intersection between a row and a column of this spatial matrix takes 0 or 1 depending on whether two countries share a boundary. Two main approaches have been suggested in the literature to estimate models that include spatial interaction effects. One is based on the principle of maximum likelihood (ML) and the other on instrumental variables or the generalized moments method (IV / GMM).
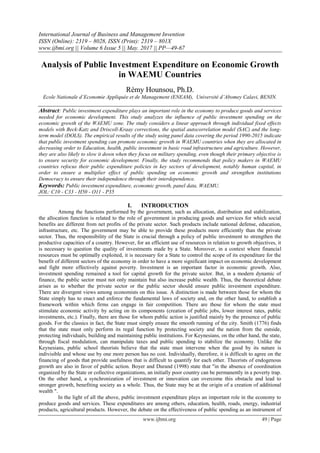
  • 6. Analysis of Public Investment Expenditure on Economic Growth in WAEMU Countries www.ijbmi.org 54 | Page IV. RESULTS AND ANALYSIS 4.1. Descriptive analysis This section focuses on the descriptive analysis of the model variables. We note that an average of the GDP log is greater than the average of the other variables. Concerning public spending, public spending on capital investment and education overweight spending on agriculture, health, military or national defense spending over the analysis period (see Table 1). In addition, there is a small disparity between the different expenditures of WAEMU member states. However, dispersion is much more pronounced for capital expenditures. Another interesting finding is that private investment over the period remains higher than public capital expenditure. Despite a high level of public investment over the last ten years, the quantity and quality of infrastructure in the WAEMU remains relative (IMF, 2016). According to this report on the WAEMU zone, the Union countries are lagging behind, particularly in terms of electricity supply, density of paved roads and telecommunications infrastructure. Inadequate and inefficient infrastructure can erode the profitability of commercial and economic activities (Foster and Briceño Garmendia, 2009). Chart 1 shows the trend of the real GDP growth rate and the evolution of total public expenditure in the WAEMU zone. The rate of economic growth rose from 3.7% in 2001 to 6.5% in 2015, while public spending moved more rapidly from 3.5% to 15.3% over the same period. Table1: Descriptive statistics of the model variables (1990-2015) Variable Obs Mean Std. Dev. Minimum Maximum lgdp 208 22.03 1.12 19.15 24.26 lagri 208 0.19 1.10 -4.11 2.25 leduc 208 1.35 0.27 0.36 2.18 lheal 208 0.67 0.33 -0.73 1.41 lmilit 208 0.28 0.55 -3.51 1.39 lcagdp 208 1.84 0.54 -0.17 3.19 lpri 208 2.36 0.65 -0.20 3.73 llab 208 4.25 0.13 3.92 4.43 Ltra 208 4.70 0.30 3.06 5.27 infl 208 5.13 10.79 -7.80 69.58 Ind 208 3.82 3.00 0.00 8.00 qdi 208 4.11 1.60 2.00 7.00 Ipr 208 2.03 4.78 -8.00 8.00 Source: BCEAO, IMF, WB, IFPRI and SIPRI, Freedom House. It should be stressed that public expenditure is the only instrument for influencing the growth and redistribution objectives of the governments of the Union. The question of what is the best composition of public expenditure that causes economic growth while controlling the accumulation of budget deficits and outstanding debt is a problem for WAEMU countries. Graph 1 : Public expenditure and economic growth trends in WAEMU Source: BCEAO (2016).
  • 7. Analysis of Public Investment Expenditure on Economic Growth in WAEMU Countries www.ijbmi.org 55 | Page Chart 2 shows that the countries of the Union have a trend in GDP. However, Cote d’Ivoire and Senegal experienced a more marked trend compared to other countries. This result can be reflected in Cote d’Ivoire’s strong allocation of natural resources as a source of foreign exchange inflows. For Senegal, the economic performance over the period can be attributed to its economic and social stability, a source of inflows of foreign direct investment (FDI). Graph 2 : GDP trend in WAEMU countries Source: BCEAO (2016). 4.2. Analyzes of the results of the estimates The results show that public expenditure on agriculture, education, health and basic infrastructure is positively correlated with economic growth in WAEMU countries (see Table 2). Military public spending remains negatively correlated with economic growth. Another striking result is that private investment, the labor force, the terms-of trade index, and institutional variables have a positive influence on economic growth. Inflation remained negatively correlated with growth in the Union. 4.2.1. Public expenditure on agriculture and economic growth Table 2 shows that public spending on agriculture has a positive and significant effect on economic growth in the WAEMU countries, either in the individual fixed effects model with Beck-Katz correction (1995) or, The Spatial Autoregressive Model (SAC). This effect is low in the SAC model (0.054) compared to the individual fixed effects model (0.197). A significant result across the DOLS model is that the impact of public spending on agriculture would be greater in the long run with a value of 0.258. In other words, an increase in public expenditure on agriculture of 10% would lead to a long-term increase in GDP of 2.5%. This result converges with the World Bank (2008) on a sample of developing countries and that of Suphannarchart and Warr (2009) for Thailand. 4.2.2. Public expenditure on education and economic growth The results in Table 2 show that public spending on education has a positive impact on economic growth, either in the individual fixed effects model with Beck-Katz (1995), Driscoll-Kraay (1998), Spatial Autoregressive Model (SAC), or in the long-term model. The effect is much more pronounced in the long-term model than in the other models. An increase in public expenditure on education of 10% would lead to an increase in GDP of 14.67%, 3.94%, 0.35% and 17.02%, respectively, in the individual fixed effects model with Beck-Katz correction, individual fixed effects model with correction of Driscoll-Kraay, Spatial Autoregressive Model (SAC) and in the DOLS "Dynamic Ordinary Least Squares". This result supports the positions of Benhabib and Speigel (1994), Barro and Sala-i-Martin (1995), Musila and Belassi (2004), Beldacci et al. (2008), Jobert (2008) and Fouopi et al. (2014) that public spending on education improves the rate of economic growth.
  • 8. Analysis of Public Investment Expenditure on Economic Growth in WAEMU Countries www.ijbmi.org 56 | Page 4.2.3. Health Expenditure and Economic Growth Table 2 shows a positive relationship between public expenditure on health and economic growth in the countries of the Union, regardless of the model considered. In other words, the increase in public expenditure on health by 10% ceteris paribus would increase GDP by 6.83%, 4.89%, 0.98% and 7.43%, respectively, in the individual fixed effect model with Beck-Katz correction, the effect model (DOLS), the Dynamic Ordinary Least Squares (DOLS) model, and the Spatial Autoregressive Model (SAC). We note that the impact coefficient is higher in the long-term dynamics compared to the other models. This result corroborates that of Ulman (2003) and Fouopi et al. (2014). 4.2.4. Military Public Expenditures and Economic Growth An increase in military spending negatively affects economic growth in WAEMU countries using the fixed-effects models with Beck-Katz correction and in the long-term DOLS. On the contrary, the effect is positive in the autoregressive spatial model (SAC). Thus, the sign of military spending seems to be mitigating. On the other hand, we note a more pronounced long-term negative effect (DOLS). Indeed, a 10% increase in military spending would reduce the GDP by 3.74% in the long term. This seems to be explained by the fact that military spending constitutes a loss in this context that other public spending is more likely to serve as an engine of growth. At this stage, we can say that military spending is not an effective policy instrument. This result supports the position of Joerding (1986), Jobert (2008) and Malizard (2013). However, while the economic benefits of these expenditures are not their primary purpose and their primary objective is to ensure security, it is relevant to seek to improve the effectiveness of these expenditures, especially in these times of terrorist threats. 4.2.5. Government Expenditures on Capital and Economic Growth In Table 2, the coefficient of impact of public capital expenditure is positive and significant in all estimated models. In other words, an increase of 10% in public capital expenditure would increase the Union's GDP by 4.48%, 2.32%, 1.32% and 3.87%, respectively, in the individual fixed effects models with Beck-Katz correction, Driscoll-Kraay correction, the autoregressive spatial model (SAC) and the long-term dynamics (DOLS). These results support those obtained by Easterly and Rebelo (1993), Nelson and Singh (1994), Khan and Kumar (1997), Gupta et al. (2003), Mansouri (2003), Abou (2007) and Fouopi et al. (2014). 4.2.6. Contribution of Traditional Factors of Economic Growth Table 2 shows a positive and significant correlation between private investment and economic growth in the Union, regardless of the model considered. The impact is much more pronounced in the long-term dynamics through the ordinary least squares model of Kao and Chiang (2000). In other words, an increase in private investment of 10% would increase the GDP by 4.04% in the long term compared to 0.59% in the autoregressive spatial model (SAC) and 1.23% in the fixed effects model with correction of Driscoll- Kraay (1998). This observation can be explained by the fact that private investment is a growth factor for both the neoclassical school and the Keynesian theory through the effects of externalities generate. Although this is theoretically explained by these currents of thought, this result confirms those of Ojo and Oshikoya (1995), Ghura and Hadjimichael (1996) and Ashipala and Haimobodji (2003). The effect of the terms of trade indices is positive and significant. Nubukpo (2007) argues that improving the terms of trade can promote economic growth. This effect is more pronounced in the long-term dynamics (1.298). The impact of inflation on economic growth is negative in any model. However, it should be noted that this effect is almost nil in the model taking into account the spatial dimension. Moreover, an increase in inflation would reduce the GDP in the long term by 0.38%. This result for WAEMU countries is also in line with the findings of De Long and Summer (1992), Levine and Zervos (1992), Gregorio (1993) and Varoudakis (1994). 4.2.7 Contribution of Institutional Factors to Economic Growth Table 2 shows a positive and significant correlation between the quality of institutions, the index of political rights and economic growth, whatever the model considered. However, the effect appears to be higher in the long term than in other models. It should be noted that the Democracy Index affects growth positively and significantly only in the long-term relationship. This result seems surprising, but could be explained by the fact that the establishment of democratic institutions or reforms sometimes requires more time and often involves amending the constitution. It is also important to examine the contribution of countries to growth through careful scrutiny of individual unobservable characteristics. Table 7 in appendix 2 shows the specific effects of each of the countries of the Union. The results show that the unobservable characteristics of Cote d’Ivoire, Senegal, Mali and Niger
  • 9. Analysis of Public Investment Expenditure on Economic Growth in WAEMU Countries www.ijbmi.org 57 | Page contribute positively to economic growth. On the contrary, the unobservable characteristics of Benin, Burkina Faso, Guinea-Bissau and Togo reduce economic growth. A comparison of the Autoregressive Spatial Model (SAC) and the SEM-Spatial Error Model using the Akaike (AIC) and Schawarz (BIC) information criteria indicates that the SAC model minimizes these information criteria. This model has the advantage of being more general and robust than the SEM model. The coefficients rho (ρ) and lambda (λ) are significantly non-zero at the 1% threshold. This result reflects the relevance of the model and provides some interesting information. Indeed, since the spatial autoregressive coefficient is significant at the 1% threshold and equal to 0.219 in table2, it means that if the GDP of a country of the Union increases by 1%, the GDP of neighboring countries ceteris paribus would increase by 0.219%. This result can be explained by intra-regional trade between countries or by the effects of contagion. Although the regional integration of the Union states remains weak, they benefit the same monetary policy, the same regional stock exchanges market and are subject to the same economic convergence criteria. Finally, the Dynamic Ordinary Least Squares (DOLS) model shows in decreasing order that public expenditure on education, public expenditure on health, public expenditure on investment and public expenditure on agriculture affect positively and significantly Economic growth in the Union. Thus, it should be emphasized that education is a pillar of the improvement of economic growth in the WAEMU zone. Education and health spending is included in human capital spending, which indicates that improving human capital would increase long-term growth. This result is consistent with the conclusions of the endogenous human capital growth theory developed by Lucas (1988), Mankiw, Romer and Weil (1992), Azariadis and Drazen (1990), Autume and Michel -i-Martin (1995), Benhabib and Spiegel (1994). Human capital not only facilitates the adaptation of more advanced technologies, but also makes innovation simpler at the border. Another significant achievement in the long-term dynamic is the fact that private enterprise investment will be more productive (0.404) than investments by the Unions governments (0.387). Table 2 : Results of the model estimation Fixed Effect Beck-Katz Driscoll-Kraay SAC DOLS lagri 0.009 0.197** 0.009 0.054+ 0.258** (0.851) (0.001) (0.837) (0.064) (0.001) leduc 0.394** 1.467** 0.394** 0.035** 1.702** (0.000) (0.000) (0.000) (0.004) (0.000) lheal 0.489** 0.683** 0.489** 0.098+ 0.743** (0.000) (0.001) (0.000) (0.090) (0.000) lmilit -0.009 -0.226* -0.009 0.068* -0.374** (0.867) (0.029) (0.868) (0.019) (0.000) lcagdp 0.232** 0.448** 0.232* 0.132** 0.387** (0.002) (0.000) (0.011) (0.001) (0.000) lpri 0.123** 0.377** 0.123** 0.059* 0.404** (0.009) (0.000) (0.000) (0.039) (0.000) llab 4.982** 0.522+ 4.982** 1.800** 0.533 (0.000) (0.050) (0.000) (0.000) (0.675) ltra 0.255** 1.067** 0.255* 0.099+ 1.298** (0.006) (0.000) (0.012) (0.077) (0.000) infl -0.015** -0.026** -0.015** -0.007** -0.038** (0.000) (0.000) (0.000) (0.000) (0.000) ind 0.015 0.063 0.015 0.015 0.229** (0.536) (0.210) (0.456) (0.256) (0.000) qdi 0.202** 0.210** 0.202** 0.0915** 0.312**
  • 10. Analysis of Public Investment Expenditure on Economic Growth in WAEMU Countries www.ijbmi.org 58 | Page (0.000) (0.000) (0.000) (0.000) (0.000) ipr 0.064** 0.116** 0.064** 0.025** 0.259** (0.000) (0.000) (0.001) (0.003) (0.000) Constant -2.878 11.59** -2.878+ (0.178) (0.000) (0.097) Spatial Rho 0.219** (0.000) Lambda -0.130** (0.005) Variance sigma2_e 0.028** (0.000) N 208 208 208 200 160 R² Within 0.712 0.712 0.855 p-values in parentheses + p< 0.1, * p< 0.05, ** p< 0.01 Source: BCEAO, IM, WB, IFPRI and SIPRI, Freedom House. V. CONCLUSION AND RECOMMENDATIONS The objective of this study was to assess the influence of public investment spending on economic growth in WAEMU countries. In particular, it was necessary to identify the productive public spending that could fully promote strong and sustained economic growth. The results of the analysis of the study conducted through the individual fixed effects models and the long-term relationship on the one hand, and through spatial autoregressive model, on the other hand, indicate that in the case of individual fixed effects models, for example, an increase in public expenditure of 10% would lead to an average long-term increase in GDP of 2, 5% for agriculture, 6.32% for education, 4.22% for health, 2.70% for capital expenditure, 4.04% for private investment, and 1.30% for the terms of trade. On the contrary, military public expenditure has a negative effect on GDP, which, for a 10% increase, would reduce GDP by 3.74% over the long term. Similarly, an increase in inflation would decrease in the long term the GDP by 0.38%. Thus, with respect to institutional factors, there is a positive and significant correlation between these variables and economic growth. Moreover, the results from the long-term relationship and spatially autoregressive models confirm these trends. The main lesson of this study is that public spending can favor the growth of WAEMU economies when they are targeted at education, health, and public investment in basic road infrastructure, but are also likely to slow it down when they focus on military spending, although the economic spin-offs are not their primary purpose. While their primary objective is to ensure security, it is pertinent to seek to improve the effectiveness of these expenditures in order to address the many challenges of terrorism insecurity. It should be noted that the multiplier effect of these variables on economic growth is low as shown in Chart 1. For example, the economic growth rate rises from an average of 3.70% in 2001 to 6.50% in 2015, while public investment expenditure is growing more rapidly, rising from 3.50% to 15.30% during the same period. It therefore urges policy-makers in WAEMU countries to refocus their public spending policies in the most promising sectors of development, namely human capital (education and health) and road and energy infrastructure. It is also important for these countries of the Union to strengthen democratic institutions in order to ensure their independence through their interdependence as a guarantee of faster development. Finally, this study did not take into account all explanatory variables of public expenditure that may explain fully economic growth. We hope that further studies will be carried out to improve this work. REFERENCES [1]. Abou, N. B. (2007), « Structure des Dépenses Publiques, Investissement Prive et Croissance dans l’UEMOA » BCEAO Document d'Étude et de Recherche No. DER/07/04 (Dakar : Banque Centrale des Etats de l'Afrique de l'Ouest). [2]. Adam, S. (1776), « Recherches sur la Nature et les Causes de la Richesse des Nations ». [3]. Aghion, P., & Cohen, E. (2004), « Éducation et croissance (pp. 00-00). Paris : La documentation française ». [4]. Andreosso-O'Callaghan, B. (2002), « Human capital accumulation and economic growth in Asia ». [5]. Anselin, L., & Bera, A. K. (1998), « Spatial dependence in linear regression models with an introduction to spatial econometrics ». Statistics Textbooks and Monographs, 155, 237-290.
  • 11. Analysis of Public Investment Expenditure on Economic Growth in WAEMU Countries www.ijbmi.org 59 | Page [6]. Anselin, L., Le Gallo, J., & Jayet, H. (2008), « Spatial panel econometrics. In The econometrics of panel data (pp. 625-660) ». Springer Berlin Heidelberg. [7]. Aschauer, D., (1989), « Is public expenditure productive? » Journal of Monetary and Economy 23 (2), 177-200. [8]. Aschauer, D., (1990), « Why is infrastructure important? » In Is There a Shortfall in Public Capital Investment, Munnell, Alicia (Ed.), pp. 69-104. Boston, MA: Federal Re-serve Bank of Boston. 419-43. [9]. Ashipala J. Et Haimbodi N. (2003), « The Impact of Public Investment on Economic Growth in Namibia », Working Paper, No. 88, NEPRU; [10]. Ashipala, J., & Haimbodi, N. (2003), « The impact of public investment on economic growth in Namibia », (No. 88). Namibian Economic Policy Research Unit. [11]. Autume, A., & Michel, P. (1994), « Education et croissance ». No. Halshs-0043010 . HAL. [12]. Azariadis, C., & Drazen, A. (1990), « Threshold externalities in economic development ». The Quarterly Journal of Economics, 105(2), 501-526. [13]. Baldacci, E., Clements, B., Gupta, S., & Cui, Q. (2008), « Social spending, human capital, and growth in developing countries ». World development, 36(8), 1317-1341. [14]. Baltagi, B. H. (2008), « Econometric analysis of panel data». John Wiley & Sons. [15]. Baltagi, B. H. (2015), «The Oxford handbook of panel data». Oxford University Press, USA. [16]. Baltagi, B. H., & Pirotte, A. (2010), «Panel data inference under spatial dependence ». Economic Modelling, 27(6), 1368-1381. [17]. Banque Mondiale (2008), « L’agriculture au service du développement in rapport sur le développement dans le monde », Editions De Boeck, Distribution Nouveaux horizons ARS, Paris. [18]. Barro, R. J. (1990), « Government spending in a simple model of endogeneous growth ». Journal of political economy, 98(5, Part 2), S103-S125. [19]. Barro, R. J. (1991), «Economic growth in a cross section of countries ». The quarterly journal of economics, 106(2), 407-443. [20]. Barro, R. J. (1995), « Inflation and economic growth (No. w5326) ». National bureau of economic research. [21]. Barro, R. J., & Sala-i-Martin, X. (1995), « Economic growth », 1995. McGraw0Hill, New York. [22]. Beck, N., and Katz J. N. (1995), « What to do (and not to do) with time-series cross-section data. American Political Science Review 89: 634{647. [23]. Benhabib, J., & Spiegel, M. M. (1994), « The role of human capital in economic development evidence from aggregate cross-country data ». Journal of Monetary economics, 34(2), 143- 173. [24]. Boyer, R., & Durand, J. P. (1998), « L’après fordisme », éditions La Découverte et Syros. [25]. B reusch, T. S., & Pagan, A. R. (1980), « The Lagrange multiplier test and its applications to model specification in econometrics ». The Review of Economic Studies, 47(1), 239-253. [26]. Chimobi, O. P. (2009), « Government expenditure and national income: A causality test for Nigeria ». European Journal of Economic and Political Studies, 2(2), 1-11. [27]. Conley, T. G., & Ligon, E. (2002), « Economic distance and cross-country spillovers ». Journal of Economic Growth, 7(2), 157-187. [28]. De Long, J. Bradford & Lawrence Summers H. (1992), « Macroeconomic policy and long-run growth », Federal Reserve Bank of Kansas City Economic Review 77, no. 4, 5-30. [29]. Djistera A. (2008), « Le rôle du capital humain dans la croissance : le cas des économies émergentes d'Asie » ; Université Montesquieu Bordeaux IV ; pp.1-19. [30]. Driscoll, J., & Kraay A. C. (1998), « Consistent covariance matrix estimate spatially dependent data ». Review of Economics and Statistics 80: 549-560. [31]. Easterly, W., & Rebelo, S. (1993), « Fiscal policy and economic growth». Journal of monetary economics, 32(3), 417-458. [32]. Eberhardt, M. (2011), « Panel time-series modeling: New tools for analyzing xt data ». In 2011 UK Stata Users Group meeting. [33]. Elhorst, J. P. (2001), « Dynamic models in space and time ». Geographical Analysis, 33:119–140. Elhorst, J. P. (2003), « Specification and estimation of spatial panel data models ». International Regional Science Review, 26(3): 244–268. [34]. Elhorst, J. P., & Fréret, S. (2009), « Evidence of Political Yardstick Competition in France Using A Two‐ Regime Spatial Durbin Model With Fixed Effects ». Journal of Regional Science, 49(5), 931-951. [35]. Ertur, C., & Koch, W. (2007), « Growth, technological interdependence and spatial externalities: theory and evidence ». Journal of applied econometrics, 22(6), 1033-1062. [36]. Foster, V., & Briceño-Garmendia, C. (2009), « Africa infrastructure country diagnostic ». The World Bank, Washington, DC. [37]. Fosu, A. K. (2008), « Democracy and growth in Africa: Implications of increasing electoral competitiveness ». Economics Letters, 100(3), 442-444. [38]. Fouopi D. C., Nsi Ella P., Mbomon Ndoumba J., Ngah E. B. (2014), « Dépenses Publiques et Croissance Economique dans les pays de la CEMAC », colloque de l’Association d’Économie Théorique et Appliquée. [39]. Ghura, D., & Hadjimichael, M. T. (1996), « Growth in Sub-Saharan Africa ». Staff Papers, 43(3), 605-634. [40]. Gregorio, J. (1993), « Inflation, taxation, and long-run growth ». Journal of Monetary Economics, 31(3), 271-298. [41]. Guellec, D. et Ralle P. (1997), « Les nouvelles théories de la croissance », Paris, La Découverte, coll. « Repères ». [42]. Gupta, Baldacci et Clements (2003), « Utiliser la politique budgétaire pour stimuler la croissance », Finances & Développement, décembre 2003, pp. 28-31
  • 12. Analysis of Public Investment Expenditure on Economic Growth in WAEMU Countries www.ijbmi.org 60 | Page [43]. Gurgand, M. (1993), « Éducation et productivité agricole en Côte d’Ivoire ». Revue d’économie du développement, (4). [44]. Hausman, J. A. (1978), « Specification tests in econometrics ». Econometrica: Journal of the Econometric Society, 1251-1271. [45]. Hoechle, D. (2007), « Robust standard errors for panel regressions with cross-sectional dependence ». Stata Journal, 7(3), 281. [46]. Hsiao, C. (2014), « Analysis of panel data (No. 54) ». Cambridge university press. [47]. Hsiao, C., (1986), « Analysis of Panel Data », Econometric society Monographs N° 11. Cambridge Universirty Press. [48]. Hurlin, C., & Mignon, V. (2005), « Une synthèse des tests de racine unitaire sur données de panel ». Economie & prévision, (3), 253-294. [49]. Jobert, T. (2008), « Dépenses publiques d’éducation, dépenses militaires et croissance en Turquie : Une analyse empirique sur séries longues », Document de travail. [50]. Joerding, W. (1986), «Economic growth and defense spending: Granger causality ». Journal of Development Economics, 21(1), 35-40. [51]. Kao, C., & Chiang, M. H. (2000), « Nonstationary panels, panel cointegration and dynamic panels ». Advances in econometrics, 15, 179-222. [52]. Keller, W., & Shiue, C. H. (2007), « The origin of spatial interaction ». Journal of Econometrics, 140(1), 304-332. [53]. Khan, M. S., & Kumar, M. S. (1997), « Public and private investment and the growth process in developing countries ». Oxford bulletin of economics and statistics, 59(1), 69-88. [54]. Khan, M. S., & Kumar, M. S. (1997), « Public and private investment and the growth process in developing countries ». Oxford bulletin of economics and statistics, 59(1), 69-88. [55]. Kornendi, R. & Meguire, P., (1985), « Macroeconomic determinants of growth: cross-country evidence », Journal of Monetary Economics, 16, 141-163. [56]. Lee L. F., Yu J. (2008), «Estimation of Spatial Autoregressive Panel Data Models with Fixed Effects», Working Paper, Department of Economics, The Ohio State University. [57]. Levine, R. & Zervos, S. (1992), « Looking at the facts: What we know about policy and growth from cross-country analysis », Mimeo., Oct. (World Bank, Washington, DC). [58]. Lucas, R. E. (1988), « On the mechanics of economic development ». Journal of monetary economics, 22(1), 3-42. [59]. Malizard, J. (2013), « Is there military keynesianism? An evaluation in the case of France with disaggregated data (Vol. 4) ». Working paper ART-Dev. [60]. Mankiw, N. G., Romer, D., & Weil, D. N. (1992), « A contribution to the empirics of economic growth ». The quarterly journal of economics, 107(2), 407-437. [61]. Mansouri B. (2003), « Déséquilibre financiers publics, investissement privé et croissance économique au Maroc », Agence Universitaire de la Francophonie (AUF), RéseauThématique : Analyse Economique et Développement, pp. 1-21. [62]. Mark, N. C., & Sul, D. (2003), « Cointegration vector estimation by panel DOLS and long‐ run money demand». Oxford Bulletin of Economics and Statistics, 65(5), 655-680. [63]. Musila, J., & Belassi, W. (2004), « The impact of education expenditures on economic growth in Uganda: evidence from time series data ». The Journal of Developing Areas, 38(1), 123-133. [64]. Nelson, M. A., & Singh, R. D. (1994), « The deficit- growth connection: Some recent evidence from developing countries ». Economic Development and Cultural Change, 43(1), 167- 191. [65]. Nubukpo, K. (2007), « Dépenses publiques et croissance des pays de l'Union économique et monétaire ouest-africaine (UEMOA) ». Afrique contemporaine, (2), 223-250. [66]. Ojo, O., & Oshikoya, T. (1995), « Determinants of long-term growth: Some African results ». Journal of African Economies, 4(2), 163-191. [67]. Ouattara, W. (2007), « Dépenses Publiques, Corruption et Croissance Économique dans les Pays de l’Union économique et monétaire ouest-africaine (UEMOA) : une Analyse de la Causalité au Sens de Granger ». Revue d’Intégration Africaine, 19, 481- 500. [68]. P edroni, P. (1995), « Panel Cointegration: Asymptotic and Finite Sample Properties of Pooled Time Series Test with an Application to the PPP Hypothesis », Indiana University Working Papers in Economics, No. 95-013. [69]. P edroni, P. (1999), « Critical values for cointegration tests in heterogeneous panels with multiple regressors ». Oxford Bulletin of Economics and statistics, 61(s 1), 653-670. [70]. Pedroni, P. (2004), « Panel cointegration: asymptotic and finite sample properties of pooled time series tests with an application to the PPP hypothesis ». Econometric theory, 20(03), 597-625. [71]. Pesaran, M. H. (2004), « General diagnostic tests for cross section dependence in panels ». University of Cambridge, Faculty of Economics, Cambridge Working Papers in Economics No. 0435. [72]. Pesaran, M. H., Smith, L. V., & Yamagata, T. (2012), « Panel unit root tests in the presence of a multifactor error structure ». Journal of Econometrics, 175(2), 94-115. [73]. Pesaran, M. H., Ullah, A., & Yamagata, T. (2008), « A bias‐ adjusted LM test of error cross‐ section independence ». The Econometrics Journal, 11(1), 105-127. [74]. Pirotte, A. (2011), « Econométrie des données de panel : théorie et applications». Economica. [75]. Psacharopoulos, M., & Woodhall, G. (1985), « Education for Development: An Analysis of Investment Choices ». (Washington, DC: World Bank). [76]. Rebelo, S. (1991), « Long-run policy analysis and long-run growth ». Journal of political Economy, 99(3), 500-521. [77]. Rivera-Batiz, F. (2002), « Democracy, Governance, and Economic Growth: Theory and Evidence », Review of Development Economics, Vol.6, n°2, pp. 225-247. [78]. Sacerdoti, E., Brunschwig, S., & Tang, J. (1998), « The impact of human capital on growth: evidence from West Africa ». IMF Working Paper, Vol., pp. 1-34.
  • 13. Analysis of Public Investment Expenditure on Economic Growth in WAEMU Countries www.ijbmi.org 61 | Page [79]. Savvides, A. (1995), « Economic growth in Africa ». World development, 23(3), 449-458. [80]. Sevestre, P. (2002), « Econométrie des données de panel». (pp. 109-152). Paris : Dunod. [81]. Suphannachart, W. et Warr, P. (2009), « Research and Productivity in Thailand Agriculture eds », proceeding of the World Bank Annual Conference on Development Economics. Washington, D, C World Bank. [82]. Tenou K. (1999), « Les déterminants de la croissance à long terme dans les pays de l'UEMOA », Notes d'Information et Statistiques, Etudes et Recherches, N°493, BCEAO, juin 1999. [83]. Thiam (1999), « Croissance économique, Capital physique et capital humain : théories et application dans les pays en développement », mémoire (M. SC), université de Montréal. [84]. Ulman B. P. (2003), « Economie de la Santé : Quelques Faits Stylisés », Econ WPA HEW Series. [85]. V aroudakis, A. A. (1994), « La politique macroéconomique ». Dunod. [86]. Wooldridge, J. M. (2002), « Econometric Analysis of Cross Section and Panel Data ». Cambridge, MA: MIT Press. 7. APPENDIX 7. 1. Correlation of Variables Table 3 : Variables correlation matrix lgdp lagri leduc lheal lmilit lcagdp lpri llab ltra infl ind qdi ipr lgdp 1.00 lagri 0.47* 1.00 leduc 0.60* 0.22* 1.00 lheal 0.40* 0.51* 0.22* 1.00 lmilit 0.09 0.18* 0.28* -0.04 1.00 lcagdp 0.02 0.29* -0.03 0.52* -0.14 1.00 lpri 0.31* 0.33* 0.14 0.44* -0.09 0.29* 1.00 llab -0.02 -0.12 0.15 -0.04 0.20* -0.13 -0.02 1.00 ltra 0.39* 0.25* 0.16 0.15 -0.19* 0.27* 0.10 - 0.24* 1.00 infl -0.44* -0.38* -0.33* -0.08 -0.40* 0.06 0.14 -0.02 - 0.02 1.00 ind 0.08 0.11 -0.03 0.24* -0.03 0.35* 0.09 - 0.34* 0.01 -0.14 1.00 qdi -0.03 -0.17 -0.01 -0.37* -0.01 -0.45* -0.28* 0.20* 0.01 0.04 - 0.81* 1.00 ipr 0.12 0.04 0.01 0.22* -0.01 0.30* 0.09 - 0.32* - 0.02 -0.13 0.94* - 0.80* 1.00 Source: BCEAO, IMF,WB, IFPRI and SIPRI, Freedom House. 7.2. : Hsiao (1989)test and Results of the individual fixed effects Tableau 4:Test d'homogénéité de Hsiao (1989) Table 5: Specification test Source: BCEAO, IMF, WB, IFPRI and SIPRI, Freedom House. Graph 3 : Visual normality test
  • 14. Analysis of Public Investment Expenditure on Economic Growth in WAEMU Countries www.ijbmi.org 62 | Page Source: BCEAO, IMF, WB, IFPRI and SIPRI, Freedom House. Table 6: Autocorrelation, Heteroscedasticity, normality residual test Graph 4: Representation of countries fixed effects Source: BCEAO, IMF, WB, IFPRI and SIPRI, Freedom House. Table 7 : Fixed effects values and signification
  • 15. Analysis of Public Investment Expenditure on Economic Growth in WAEMU Countries www.ijbmi.org 63 | Page co u n try f ix e d e f f e ct p - v a lu e B e n in - 0.07 0.00 B u rk in a F a s o - 0.81 0.00 C o te d 'iv o ire 1.67 0.00 G u in e e B is s a u - 1.64 0.00 M a li 1.21 0.00 N ig e r 0.22 0.04 S e n e g a l 0.27 0.00 T o g o - 0.85 0.00 T o ta l 0.00 S tatistiq u e P -v alu e D é cisio n B re u sch -P agan (1980) 55.70 0.00 P e saran (2004)-C D te st 4.28 0.00 P e saran e t al. (2008) 5.55 0.00 Te st d e d é p e n d an ce D é p e n d an ce in te r-in d iv id u e lle 7.3. Individuals fixed effects estimation model with Driscoll-Kraay(1998) correction (1) (2) (3) (4) (5) (6) (7) (8) lgdp lgdp lgdp Lgdp lgdp lgdp lgdp lgdp lagri - 0.057 0.001 0.008 -0.046 -0.043 -0.048 -0.009 0.009 (0.53 2) (0.987) (0.99 6) (0.484) (0.488) (0.463 ) (0.868 ) (0.837) leduc 0.797 ** 0.564** 0.560 ** 0.439** 0.355** 0.471* * 0.329** 0.394** (0.00 0) (0.000) (0.00 0) (0.000) (0.000) (0.000 ) (0.000 ) (0.000) lheal 0.510 ** 0.448** 0.457 ** 0.500** 0.435** 0.526* * 0.425** 0.489** (0.00 6) (0.000) (0.00 0) (0.000) (0.000) (0.000 ) (0.000 ) (0.000) lmilit 0.178 * 0.087 0.092 0.004 0.006 0.005 - 0.0055 6 -0.009 (0.04 7) (0.193) (0.18 1) (0.943) (0.918) (0.930 ) (0.936 ) (0.868) lcagdp 0.118 0.203* 0.187 * 0.156* 0.119 0.183* 0.117 0.232* (0.19 9) (0.014) (0.02 6) (0.037) (0.116) (0.043 ) (0.100 ) (0.011) lpri 0.072 0.012 0.013 0.112** 0.128** 0.109* * 0.127** 0.123** (0.18 4) (0.795) (0.75 6) (0.004) (0.002) (0.005 ) (0.000 ) (0.000) llab 6.262** 6.184 ** 5.599** 5.482** 5.557* * 5.426** 4.982** (0.000) (0.00 0) (0.000) (0.000) (0.000 ) (0.000 ) (0.000) ltra 0.078 0.162* 0.242* 0.141* 0.261* 0.255*
  • 16. Analysis of Public Investment Expenditure on Economic Growth in WAEMU Countries www.ijbmi.org 64 | Page (0.25 4) (0.031) (0.018) (0.032 ) (0.018 ) (0.012) infl - 0.018** - 0.017** - 0.018* * - 0.017** - 0.015** (0.000) (0.000) (0.000 ) (0.000 ) (0.000) ind 0.044** 0.0152 (0.003) (0.456) qdi 0.034 0.202** (0.295 ) (0.000) ipr 0.034** 0.064** (0.001 ) (0.001) constant 20.18 ** -6.093* - 6.102 * -3.923+ -3.791 - 3.889+ -3.499 -2.878+ (0.00 0) (0.032) (0.03 0) (0.079) (0.129) (0.052 ) (0.176 ) (0.097) N 208 208 208 208 208 208 208 208 R² within 0.294 0.535 0.536 0.615 0.638 0.618 0.653 0.712 p-values in parentheses + p< 0.1, * p< 0.05, ** p< 0.01 Source: BCEAO, IMF, WB, IFPRI and SIPRI, Freedom House. 7.4. : Spatial dependence test Table 8 : Cross-sectional spatial dependence test Variable CD-test p-value corr abs(corr) lgdp 26.18 0.000 0.970 0.970 lagri -0.10 0.920 -0.004 0.254 leduc 4.56 0.000 0.169 0.338 lheal 4.75 0.000 0.176 0.396 lmilit -0.93 0.352 -0.035 0.461 lcagdp 0.75 0.452 0.028 0.273 lpri -0.86 0.392 -0.032 0.510 llab 15.41 0.000 0.571 0.585 ltra 6.64 0.000 0.246 0.386 infl 18.69 0.000 0.693 0.701 ind 8.99 0.000 0.333 0.345 qdi 4.16 0.000 0.154 0.278 ipr 12.30 0.000 0.456 0.456 Source: BCEAO, IMF, WB, IFPRI and SIPRI, Freedom House. 7.5.: Results of the tests of stationary and cointegration on panel data Table 9: Stationary test of first and second generations first generation second generation Breitung (2000) Maddala and Wu (1999) Pesaran (2007)
  • 17. Analysis of Public Investment Expenditure on Economic Growth in WAEMU Countries www.ijbmi.org 65 | Page Variables Level Diff Level Diff Level Diff p-value p-value p-value p-value p-value p-value lgdp 0.42 0.00 0.30 0.01 0.96 0.00 lagri 0.06 0.00 0.42 0.00 0.74 0.00 leduc 0.24 0.00 0.54 0.00 0.11 0.00 lheal 0.13 0.00 0.64 0.00 0.42 0.00 lmilit 0.25 0.00 0.06 0.00 0.93 0.00 lcagdp 0.63 0.00 0.34 0.00 0.92 0.00 lpri 0.87 0.05 0.79 0.00 0.99 0.07 llab 0.29 0.00 0.31 0.06 0.98 0.00 ltra 0.23 0.00 0.86 0.00 0.19 0.00 infl 0.26 0.00 0.00 0.00 0.00 0.00 ind 0.23 0.00 0.57 0.00 0.99 0.00 qdi 0.40 0.00 0.19 0.00 0.98 0.00 ipr 0.10 0.02 0.00 0.00 0.74 0.02 Source: BCEAO, IMF, WB, IFPRI and SIPRI, Freedom House. Table 10 : Results of Pedroni (1995,1999, 2004) cointegration test Test Stats. Panel Group V -1.385 - Rho 2.55 3.66 T -2.65 -2.87 Adf -1.29 -2.60 Source: BCEAO, IMF, WB, IFPRI and SIPRI, Freedom House. Table 11 : Unit Root test of first and second generations First generation Second generation Breitung (2000) Maddala and Wu (1999) Pesaran (2007) Variables Level Diff Level Diff Level Diff p-value p-value p-value p-value p-value p-value lgdp 0.42 0.00 0.30 0.01 0.96 0.00 lagri 0.06 0.00 0.42 0.00 0.74 0.00 leduc 0.24 0.00 0.54 0.00 0.11 0.00 lheal 0.13 0.00 0.64 0.00 0.42 0.00 lmilit 0.25 0.00 0.06 0.00 0.93 0.00 lcagdp 0.63 0.00 0.34 0.00 0.92 0.00 lpri 0.87 0.05 0.79 0.00 0.99 0.07 llab 0.29 0.00 0.31 0.06 0.98 0.00
  • 18. Analysis of Public Investment Expenditure on Economic Growth in WAEMU Countries www.ijbmi.org 66 | Page ltra 0.23 0.00 0.86 0.00 0.19 0.00 infl 0.26 0.00 0.00 0.00 0.00 0.00 ind 0.23 0.00 0.57 0.00 0.99 0.00 qdi 0.40 0.00 0.19 0.00 0.98 0.00 ipr 0.10 0.02 0.00 0.00 0.74 0.02 Source: BCEAO, IMF, WB, IFPRI and SIPRI, Freedom House. 7.6.: Results of the long term-DOLS (Dynamic Ordinary Least Squares)relation (1) (2) (3) (4) (5) (6) lgdp lgdp lgdp lgdp lgdp lgdp lagri 0.326** 0.234* 0.0591 0.0395 0.0742 0.258** (0.008) (0.015) (0.472) (0.630) (0.357) (0.001) leduc 2.639** 2.130** 1.567** 1.521** 1.560** 1.702** (0.000) (0.000) (0.000) (0.000) (0.000) (0.000) lheal 0.714** 1.102** 1.415** 1.376** 1.404** 0.743** (0.007) (0.000) (0.000) (0.000) (0.000) (0.000) lmilit -0.601** -0.260* -0.343** -0.344** -0.341** -0.374** (0.000) (0.029) (0.001) (0.000) (0.000) (0.000) lcagdp 0.398* 0.704** 0.838** 0.708** 0.868** 0.387** (0.026) (0.000) (0.000) (0.000) (0.000) (0.000) lpri 0.127 0.0873 0.147 0.231* 0.134 0.404** (0.336) (0.393) (0.102) (0.010) (0.130) (0.000) llab -0.392 -0.212 -0.378 -0.111 0.533 (0.823) (0.884) (0.795) (0.938) (0.675) ltra 1.342** 1.683** 1.613** 1.692** 1.298** (0.000) (0.000) (0.000) (0.000) (0.000) infl -0.0543** -0.0549** -0.0530** -0.0375** (0.000) (0.000) (0.000) (0.000) ind 0.00575 0.229** (0.750) (0.000) qdi 0.0596 0.312** (0.109) (0.000) ipr 0.0119 0.259** (0.290) (0.000) N 176 176 176 176 176 160 p-values in parentheses + p< 0.1, * p< 0.05, ** p< 0.01 Source: BCEAO, IMF, WB, IFPRI and SIPRI, Freedom House.
  • 19. Analysis of Public Investment Expenditure on Economic Growth in WAEMU Countries www.ijbmi.org 67 | Page 7.7.: SAC and SEM models comparison (spatial regression on panel data) Model Obs ll(null) ll(model) df AIC BIC Spatial Error Model (SEM) 208 . 29.501 14 -31.002 15.724 Spatial Autoregressive Model (SAC) 200 . 48.012 15 -66.024 -16.549 Source: BCEAO, IMF, WB, IFPRI and SIPRI, Freedom House. 7.8. : Spatial Autoregressive (SAC)model results (1) (2) (3) (4) (5) (6) lgdp lgdp lgdp lgdp lgdp lgdp lagri 0.039 0.049+ 0.033 0.025 0.048 0.054+ (0.260) (0.073) (0.282) (0.446) (0.117) (0.064) leduc 0.091 0.112 0.020** 0.077 0.015* 0.035** (0.237) (0.124) (0.007) (0.276) (0.010) (0.004) lheal -0.175* 0.016 0.025 0.044 0.030 0.098+ (0.013) (0.803) (0.675) (0.501) (0.610) (0.090) lmilit 0.107** 0.117** 0.077* 0.073* 0.075* 0.068* (0.001) (0.000) (0.014) (0.026) (0.017) (0.019) lcagdp 0.089* 0.108* 0.085* 0.107* 0.088* 0.132** (0.043) (0.014) (0.040) (0.016) (0.032) (0.001) lpri -0.047+ -0.024 0.043 0.027 0.045 0.059* (0.079) (0.427) (0.146) (0.352) (0.128) (0.039) llab 1.958** 1.812** 1.752** 1.825** 1.800** (0.000) (0.000) (0.000) (0.000) (0.000) ltra 0.037 0.005 0.043 0.022 (0.515) (0.939) (0.438) (0.677) infl -0.008** -0.009** -0.008** -0.007** (0.000) (0.000) (0.000) (0.000) ind 0.0214** 0.0154 (0.001) (0.256) qdi 0.00683 0.0915** (0.636) (0.000) ipr 0.0141** 0.0247** (0.000) (0.003) Spatial Rho 0.162* 0.239** 0.230** 0.230** 0.228** 0.219** (0.029) (0.000) (0.000) (0.000) (0.000) (0.000) Lambda 0.205** -0.061 -0.075 -0.040 -0.082 -0.130** (0.000) (0.188) (0.167) (0.567) (0.109) (0.005)
  • 20. Analysis of Public Investment Expenditure on Economic Growth in WAEMU Countries www.ijbmi.org 68 | Page Variance sigma2_e 0.044** 0.039** 0.032** 0.033** 0.031** 0.028** (0.000) (0.000) (0.000) (0.000) (0.000) (0.000) N 200 200 200 200 200 200 p-values in parentheses + p< 0.1, * p< 0.05, ** p< 0.01 Source: BCEAO, IMF, WB, IFPRI and SIPRI, Freedom House.