

Recommended
More Related Content
Similar to De Agostini 2017 Highlights
Similar to De Agostini 2017 Highlights (20)
More from DeA Capital S.p.A.
More from DeA Capital S.p.A. (20)
Recently uploaded
Recently uploaded (20)
De Agostini 2017 Highlights
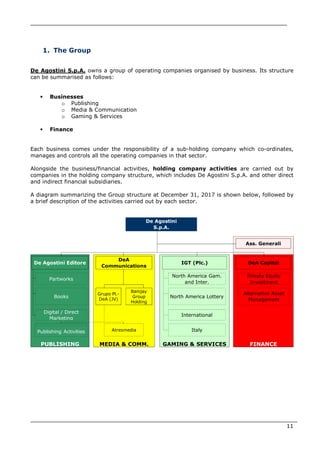
- 1. ___________________________________________________________________________ ______________________________________________________________________________ 11 1. The Group De Agostini S.p.A. owns a group of operating companies organised by business. Its structure can be summarised as follows: Businesses o Publishing o Media & Communication o Gaming & Services Finance Each business comes under the responsibility of a sub-holding company which co-ordinates, manages and controls all the operating companies in that sector. Alongside the business/financial activities, holding company activities are carried out by companies in the holding company structure, which includes De Agostini S.p.A. and other direct and indirect financial subsidiaries. A diagram summarizing the Group structure at December 31, 2017 is shown below, followed by a brief description of the activities carried out by each sector. De Agostini S.p.A. Ass. Generali De Agostini Editore DeA Communications IGT (Plc.) DeA Capital Italy Partworks North America Gam. and Inter. Private Equity Investment Books Grupo Pl.- DeA (JV) Banijay Group Holding North America Lottery Alternative Asset Management PUBLISHING MEDIA & COMM. GAMING & SERVICES FINANCE Digital / Direct Marketing International AtresmediaPublishing Activities
- 2. ___________________________________________________________________________ ______________________________________________________________________________ 12 PUBLISHING This sector is organized by business unit, based on the nature of products provided and the channels used: Partworks, which includes Italian and international activities managed by the subsidiary De Agostini Publishing. In this area, the Group offers collections, through newsstands, the internet and subscriptions, aimed at various target markets, including hobbies, cinema, products for children and cookery courses; in 2017, Partworks was removed, and the activities dedicated to Print & Collectibles, i.e. the sale of collections through the mail order channel, were transferred to the Direct Marketing Business Unit; Direct Marketing, which includes activities in the mail order sales channel for customers in many European countries in both the Print & Collectibles line and the Consumables line. In 2017, the Group started to gradually phase out these activities; Books, which includes traditional publishing activities in the book and school texts sectors, managed by the subsidiary De Agostini Libri. In the school texts sector, the Group mainly operates in the Italian market through De Agostini Scuola under a number of brands in the primary and secondary school, university and dictionary sectors. Following the transfer of the assets of De Agostini Libri's Publishing division on January 1, 2017, the Group now operates in the books sector through the associate DeA Planeta Libri, with a presence primarily in children's books, fiction, general reference and non- fiction; Digital, which includes activities relating to theme-based TV channels (‘DeA Kids’, ‘DeA Junior’ and ‘Super!’) designed for children and families on both satellite and digital terrestrial platforms, as well as a series of properties on digital platforms. The Digital area is also responsible for managing the ‘DeAbyDay’ web network, which has a female target audience, and manages the network of kids' websites (www.deakids.it and www.supertv.it). The sub-holding company for the Publishing activities is De Agostini Editore S.p.A. (De Agostini Editore), which is fully-owned directly by De Agostini S.p.A.
- 3. ___________________________________________________________________________ ______________________________________________________________________________ 13 MEDIA & COMMUNICATION The sector includes the Group's interests in media & communication; the relevant sub-holding company is DeA Communications S.A. (DeA Communications), which is fully-owned directly by De Agostini S.p.A.. At December 31, 2017, the business included the following companies: Banijay Group Holding (parent company of the Banijay Group), which is approximately 34% held on a fully diluted basis via LDH, a holding company that is 49.9% owned by DeA Communications which, in turn, is the holder of a 68.5% controlling stake in Banijay Group Holding. Banijay Group Holding is the largest independent producer of TV and multi-media content in the world, and is present in 16 countries (with fiction, factual, reality entertainment and docu-drama entertainment productions, and children’s and animation programs) and 61 brands (with a catalogue of over 20,000 hours of content distributed worldwide); Grupo Planeta-De Agostini, a 50:50 joint venture with Planeta Corporación, which controls: - Atresmedia, a Spanish national radio/TV broadcaster listed on the Madrid stock exchange; - DeA Planeta, active in cinema and content distribution in Spain. Based on the IAS/IFRS international accounting standards adopted by the Group in preparing the consolidated financial statements, the activities in question are recorded under "Investments in associates and joint ventures" and measured at equity.
- 4. ___________________________________________________________________________ ______________________________________________________________________________ 14 GAMING & SERVICES The business includes the Group’s activities in Gaming & Services. The sub-holding company for these activities is IGT Plc, with registered office in the UK. It is listed on the NYSE, and was 50.83% controlled by De Agostini S.p.A. as at December 31, 2017 (of which 4.95% is via DeA Partecipazioni, a wholly-owned subsidiary of De Agostini S.p.A., and merged by the latter effective January 1, 2018). IGT operates according to the following structure: North America Gaming & Interactive (NAGI). This business area, which is based in Las Vegas, Nevada, provides a full suite of casino-related products and solutions for the US and Canadian markets, through the development of games, systems and solutions for: (i) traditional casinos, (ii) online interactive betting systems, and (iii) the "DoubleU Games Double Down Casino" free-to-play application. It also develops, sells and licenses casino management systems, which help casinos improve operating efficiency and provide customized services and promotional offers to individual players. The business area's revenues are generated both by the sale/rental of gaming machines and software to casinos and by services relating to the maintenance of machines and systems. North America Lottery (NALO). This segment, which is headquartered in Providence, Rhode Island, develops and provides innovative solutions for lotteries and performs research and development for all lottery-related products worldwide. These solutions have enabled IGT to become the sole point of contact for most WLA (World Lottery Association) customers in North America by providing support to 39 of 45 lotteries in the US. Segment revenues are derived from both the sale and rental of hardware, software and terminals for lotteries, and from the direct management of two lotteries in Indiana and New Jersey through LMA (Lottery Management Agreement) contracts. Lastly, NALO generates revenues from the sale of instant lottery tickets; International Through this business area, IGT is the world's leading provider of innovative services and end-to-end solutions for all the regulated gaming channels and areas; it also provides a variety of interactive games such as poker, casino and bingo. The business area is responsible for the strategic development and operational management of IGT's full product portfolio for the following markets: Europe (excluding Italy), the Middle East, Central America, Latin America, the Caribbean, Asia and Oceania. Segment revenues are generated by both the sale and rental of gaming machines, software, centralized systems and other services to casinos, the sale of games and interactive solutions and sport betting, the sale and rental of hardware, software, terminals and services for lotteries, and the sale of instant lottery tickets, professional services in the form of lottery facility management, and lottery operation fees. Another source of revenues is from the provision of processing services to a number of lotteries in Latin America and the Caribbean, such as top-up services for mobile phones and utility payments. Italy This business area provides a broad range of business-to-consumer (B2C) games with five product lines: (i) lotteries; (ii) gaming machines; (iii) sports betting; (iv) commercial services; (v) interactive games. - Lotteries: since 1998, IGT has been the concession-holder for Gioco del Lotto in Italy, allowing it to capitalize on its significant experience in managing all activities throughout the entire lottery value chain (collection of bets through high-security processing systems, management of electronically connected terminals at retail outlets, advertising and promotion, staff training, assistance for license-holders and management of back office activities). In 2016, IGT was awarded a new nine-year concession for Lotto, via its subsidiary Lottomatica, acting in a consortium with other Italian and foreign operators. Since 2004,
- 5. ___________________________________________________________________________ ______________________________________________________________________________ 15 Lottomatica has also acted as the sole concession-holder for Scratch & Win acting in a consortium with other Italian and foreign operators; - Gaming Machines: IGT directly operates AWP gaming machines and video lottery terminals (VLT) that are installed in various retail outlets and connected to a central system. The company also sells and rents systems, machines and games to other concession-holders; - Sports Betting: In Italy IGT operates as a concession-holder to manage a broad network of agencies and mini-stores under the “Better” brand to collect sports and non-sports bets linked to a proprietary platform. It also provides call center solutions/services, internet-based betting technology and other services related to sports betting; - Interactive Games: IGT provides interactive games authorized in the Italian market, such as online poker, casino, bingo, roulette, blackjack and other skill- based games, sports and horse race betting, and online betting on car and motorcycle races in addition to the games ‘10 e Lotto’, ‘Win for Life’, ‘Eurojackpot’ and online ‘Scratch & Win’. - Commercial Services: IGT offers processing services for high volumes of commercial transactions not connected with lotteries, including top-up services for mobile phones, payments for utilities and taxes/stamp duties, reloading prepaid cards, and transport ticketing services.
- 6. ___________________________________________________________________________ ______________________________________________________________________________ 16 FINANCE This business includes the activities carried out by the Group in alternative investment, which are broken down into private equity investment and alternative asset management. The sub-holding company for the Finance business is DeA Capital S.p.A. (DeA Capital), which is listed on the FTSE Italia STAR segment of the Milan stock exchange and was controlled by De Agostini S.p.A. with a stake of around 58.3% at December 31, 2017. Private Equity Investment - In the Private Equity Investment business, DeA Capital has "permanent" capital, and therefore has the advantage – compared with traditional private equity funds, which are normally restricted to a pre-determined duration – of greater flexibility in optimizing the timing of entry into and exit from investments. In terms of investment policy, this flexibility allows it to adopt an approach based on value creation, including over the medium to long term. Alternative Asset Management - In the Alternative Asset Management business, DeA Capital – through its subsidiaries DeA Capital Real Estate SGR and DeA Capital Alternative Funds SGR – is Italy’s leading operator in real estate fund management and private equity funds respectively. The two asset management companies are active in the promotion, management and value enhancement of investment funds, using approaches based on sector experience and the ability to identify opportunities for achieving the best returns. Alternative Asset Management has been the Company's main focus for strategic development in recent years. The business also includes a minority shareholding in Assicurazioni Generali – one of Europe’s leading insurance companies and listed on the Milan stock exchange. Around 1.29% of the stake was held via DeA Partecipazioni (which was merged into De Agostini S.p.A. on January 1, 2018) at December 31, 2017. Holding company activities Holding company activities, including the activities carried out by the companies within the holding company structure, comprise De Agostini S.p.A. as well as other directly or indirectly controlled financial companies; specifically, these activities relate to the management of shareholdings in the sub-holding companies of the Group’s individual businesses, as well as its interests in non-strategic shareholdings and activities.
- 7. ___________________________________________________________________________ ______________________________________________________________________________ 17 2. Significant events during the year Publishing Start-up of the DeA Planeta Libri joint venture On January 1, 2017, De Agostini Libri and Planeta Corporación launched the activities of the 50:50 joint venture, DeA Planeta Libri, by contributing respectively the Publishing business division (consisting of assets in the Books segment) and cash of EUR 2.0 million each The company's objective is to develop business in the trade books sector in Italy. Establishment of the Super! Broadcast joint venture On February 20, 2017, De Agostini Editore established the company DeA Broadcast to which the Super! business division was transferred on April 1, 2017, including the Super! television station and corresponding website. Subsequently, on September 12, 50% of the stake in DeA Broadcast was sold and concurrently renamed Super! Broadcast, to the VIACOM Group for payment of EUR 2.1 million with the establishment of a jointly controlled company. Media & Communication Corporate reorganization of Banijay Group In June 2017, the corporate reorganization was completed, which led to the creation of a newco, Banijay Group Holding, to which the stakes held by LDH and Vivendi in the operating company, Banijay Group, were transferred. As a part of the reorganization: A number of capital increases have been carried out in the Banijay Group reserved for key managers to invest in the company’s equity, in a total amount of EUR 28.1 million, to be settled partly through the conversion of payables for earn-outs (EUR 20 million) and partly in cash (EUR 8.1 million); in addition, shares held by certain minority shareholders in the subsidiary Banijay Entertainment (EUR 12.8 million) were transferred to the Banijay Group; The entire debt of the operating company has been refinanced through: o the issue of a high yield bond totaling EUR 365 million (4.00% coupon and maturity in July 2022); o the signing of a new Senior Facilities Agreement with a syndicate of banks for a total of EUR 95 million (of which EUR 60 million is in the form of a term loan and EUR 35 million as a revolving credit facility); o the transfer and subsequent conversion to the Banijay Group Holding of the ICO Loan by Vivendi in the amount of EUR 40 million. Following the above reorganization, the Banijay Group is 90.32% owned by Banijay Group Holding and 9.68% owned by several managers, while Banijay Group Holding is 68.5% owned by LDH and 31.5% owned by Vivendi.
- 8. ___________________________________________________________________________ ______________________________________________________________________________ 18 Gaming & Services Sale of Double Down Interactive In 2017, agreements were signed and finalized relating to the sale by IGT of the social gaming division, Double Down Interactive, to DoubleU Games Co. (the Korean group operating in the same sector) for a cash consideration totaling USD 825 million (generating a capital gain in the income statement of about USD 27 million). As a part of the transaction, IGT signed agreements with the buyer, DoubleU Games Co., to provide innovative services to the latter in the social casino segment. Renewal of the Scratch & Win concession In December 2017, the Customs and Monopolies Agency awarded to Lotterie Nazionali, in which IGT/Lottomatica holds a 64% stake (with Scientific Games holding 20% and Arianna 2001 holding 16%), the renewal of the sole concession in Italy for Scratch & Win for nine years until September 30, 2028. As a part of the transaction, Lotterie Nazionali is required to pay an upfront fee totaling EUR 800 million (of which EUR 50 million was paid in December 2017, EUR 300 million in April 2018 and the remainder of EUR 450 million is to be paid in October 2018). Finance Disposal of shares of Migros In May 2017, Kenan Investments, an investee company in which DeA Capital holds an interest of about 17%, and which holds a 40.25% stake in Migros, completed the transactions relating to a put option on a stake of 9.75% in Migros. Subsequently, on November 22, 2017, Kenan Investments, through its wholly-owned subsidiary Moonlight Capital, completed the partial disposal of a stake of 7.3% in Migros, via an accelerated bookbuild. The combination of the above two transactions generated proceeds totaling EUR 30 million for DeA Capital and a consolidated gain for the DeA Capital Group of EUR 4.5 million. These transactions reduced the stake held by Kenan Investments in Migros from 40.25% to 23.2%, via an indirect pro-rata interest held by DeA Capital of approximately 4.0%. Increased voting rights for DeA Capital shares held by De Agostini S.p.A. On July 7, 2017, the increased voting rights attached to 178,795,798 DeA Capital shares owned by De Agostini S.p.A. became effective pursuant to art. 127-quinquies of the TUF and the Company's articles of association. As a result of this increase in voting rights, De Agostini S.p.A. – which holds about 58.3% of the share capital of DeA Capital – now has over 73% of the related voting rights.
- 9. ___________________________________________________________________________ ______________________________________________________________________________ 19 Rebranding of the two asset management companies Two asset management companies controlled by DeA Capital changed their name with effect from early October 2017. IDeA Capital Funds SGR was renamed DeA Capital Alternative Funds SGR and IDeA Fimit SGR became DeA Capital Real Estate SGR. Holding company activities Acquisition of De Agostini S.p.A. shares During the year, pursuant to put and call obligations on Category C shares of De Agostini S.p.A. executed by B&D Holding with Investendo Due, De Agostini S.p.A., as the company designated by B&D Holding to exercise the call option, acquired 2,423,208 Category C own shares from Investendo Due for a total outlay of about EUR 58.6 million. Dividends received/paid In June 2017, the shareholders' meeting of De Agostini S.p.A. approved the financial statements for the year ending December 31, 2016 reporting a net profit of EUR 16.3 million, and voted to pay a dividend totaling EUR 25.7 million (EUR 0.56 per share) on the eligible shares, partly from the net profit for the period (after allocation to the legal reserve) and partly from the reserves. In 2017 De Agostini S.p.A. recorded dividends from the operating companies amounting to EUR 87.9 million, of which EUR 66.4 million related to IGT (four quarterly dividends of USD 0.20 per share each) and EUR 21.5 million related to DeA Capital (deriving from the partial distribution of the share premium reserve at EUR 0.12 per share).
- 10. ___________________________________________________________________________ ______________________________________________________________________________ 20 3. Analysis of the Group’s operating performance and financial position 3.1 Introduction Legislative framework for the preparation of the financial statements The consolidated financial statements for the year ending December 31, 2017 were prepared on the basis of the International Accounting Standards (IAS/IFRS) approved by the European Union, with no change from the accounting standards used to prepare the consolidated financial statements as at December 31, 2016. The terms IAS and IFRS refer to all International Accounting Standards (IAS), International Financial Reporting Standards (IFRS) and associated interpretations of the International Financial Reporting Interpretations Committee (IFRIC) or its predecessor, the Standing Interpretations Committee (SIC). The provisions of Legislative Decree 38/2005 and of the IAS/IFRS constitute the legislative framework for the Company in preparing the Consolidated Financial Statements. In accordance with the provisions of Legislative Decree 38/2005, the Company prepares its financial statements pursuant to art. 2423 et seq. of the Italian Civil Code.
- 11. ___________________________________________________________________________ ______________________________________________________________________________ 21 Restated Consolidated Financial Statements The Consolidated Financial Statements and explanatory notes in this document have been supplemented with a number of performance indicators that enable the management to provide information on the performance of the Group’s businesses, in line with analysis and control parameters. For this reason, a set of restated Consolidated Financial Statements was prepared showing performance indicators more commonly used by the management than those shown in the above-mentioned Consolidated Financial Statements and explanatory notes. These are: Net revenues This represents the turnover of individual businesses and the Group as a whole, calculated as the income from sales and services. EBITDA This represents operating profit/(loss) before tax, financial income/charges, one-off items, profits/losses of shareholdings valued at equity, depreciation and amortization, and other non-cash items (e.g. impairment losses and gains/losses on the sale of tangible and intangible assets). Given the nature of the business carried out by the companies in the Finance business and the holding company structure, the net financial income relating to these activities is included in EBITDA. ORDINARY EBIT This is calculated using the EBITDA figure plus the profits/losses of shareholdings valued at equity, depreciation and amortization and other ordinary non- cash items. ORDINARY EBT This is calculated by subtracting the figure for net financial income/expenses from ORDINARY EBIT. This figure – like ORDINARY EBIT – does not include the effects of any impairment or other non-recurring items included in the NON-ORDINARY EBT figure, which is shown separately. NET FINANCIAL POSITION (NFP) This represents the difference between: (+) cash and cash equivalents, loans, receivables and certain available-for-sale financial assets or assets at fair value through profit and loss; and (-) financial liabilities. Net revenues, EBITDA, ORDINARY EBIT/EBT and net financial position are alternative performance indicators not determined according to IAS/IFRS; they are reported to help show performance trends, as well as to provide useful information on the Group’s ability to manage debt, and to assist in estimating the value of group assets. The restated Consolidated Financial Statements show the same net profit/(loss) and shareholders’ equity as the Consolidated Financial Statements and are used below to comment on both the consolidated results and those of the individual business areas.
- 12. ___________________________________________________________________________ ______________________________________________________________________________ 22 3.2 Restated Consolidated Financial Statements A summary is shown below of the Group’s key financial and operating performance indicators, based on the restated Consolidated Financial Statements, prepared in line with the above explanations. By way of introduction, note that the comparison of the results reported in 2017 with the final figures of 2016 was affected by the sale of Double Down Interactive, which resulted in its deconsolidation from the sale date (June 2017). Figures in EUR million 2017 2016 Absolute % REVENUES 4,794 5,193 (399) -8% EBITDA 1,484 1,584 (100) -6% Deprec., amort. and other non-cash items (922) (940) 18 Income (loss) from equity investments 41 45 (4) ORDINARY EBIT 603 689 (86) -12% Financial income/(charges) (417) (443) 26 ORDINARY EBT (A) 186 246 (60) -24% Impairment (689) (42) (647) Other non-recurring income/(charges) (484) 51 (535) NO - ORDINARY EBT (B) (1,173) 9 (1,182) n.a. EBT (A+B) (987) 255 (1,242) n.a. Taxes 25 (25) 50 Net profit (loss) from assets sold/discontinued operations 1 43 (42) Consolidated net profit (loss) (961) 273 (1,234) n.a. Of which: Net profit (loss) pertaining to minorities (444) 151 (595) n.a. Net profit (loss) pertaining to group (517) 122 (639) n.a. Net Financial Position (7,011) (8,085) 1,074 n.a. Of which: Games and Services (6,533) (7,523) 990 n.a. Change
- 13. ___________________________________________________________________________ ______________________________________________________________________________ 23 3.3 Operating performance Net revenues Consolidated net revenues in 2017 were EUR 4,794 million, a decrease of EUR 399 million on 2016 (EUR 5,193 million). These figures break down as follows: The Publishing business posted net revenues of EUR 387 million, a fall of EUR 57 million (- 12.7%) compared with 2016, which mainly involved the Direct Marketing business area (down EUR 40 million) following the start of the phase-out of the related activities. Gaming & Services reported net revenues of EUR 4,339 million, a decrease on 2016 (EUR 4,675 million) due mainly to the sale of Double Down Interactive and the amortization of the up-front fee for Lotto, which was recorded as a direct reduction in revenues. Excluding the deconsolidation of Double Down Interactive and amortization of the Lotto license, net revenues, on an equal exchange rate basis, were largely in line with 2016 figures. Specifically, Lotteries (excluding Italy) reported growth of +0.7% on 2016 (in terms of same store revenues), despite the unfavorable comparison with 2016 which benefited from the record receipts for the Powerball jackpot in January 2016. In Italy, however, a decline of about -3% was reported in terms of receipts, due to the extraordinary performance of the Lotto’s Late Numbers in 2016. On the other hand, revenues from the Gaming business were broadly in line with the previous year (excluding Double Down Interactive). Net revenues for the Finance business fell by EUR 7 million compared with 2016, to EUR 60 million (largely relating to the deconsolidation of Innovation Real Estate from June 2016); the revenues in question mainly related to alternative asset management fees and to revenues from service activities, particularly those relating to consultancy, management and the sale of properties in the real estate fund portfolios. EBITDA The Group recorded EBITDA of EUR 1,484 million for the year ending December 31, 2017, a decrease on the previous year. This breaks down as follows: EBITDA from Publishing was EUR -17 million, a deterioration of EUR 6 million compared with 2016, mainly attributable to the performance of Partworks, which underwent another year of restructuring in 2017. Note in addition that the result for 2017 was affected by the provision for all severance costs related to the phase-out of Direct Marketing. EBITDA Figures in EUR million 2017 % 2016 % Change Publishing (17) -1.1% (11) -0.7% (6) Games & Services 1,485 100.1% 1,599 100.9% (114) Finance 35 2.4% 40 2.5% (5) Holding Companies / Eliminations (19) -1.3% (44) -2.8% 25 Consolidated Total 1,484 100.0% 1,584 100.0% (100)
- 14. ___________________________________________________________________________ ______________________________________________________________________________ 24 EBITDA from Gaming & Services was EUR 1,485 million, representing a decrease on 2016 (EUR 1,599 million), primarily due to the effect of high profits in 2016 from the additional revenues generated by the jackpots for Powerball and Late Numbers, and the deconsolidation of Double Down Interactive. EBITDA for the Finance business was EUR 35 million (EUR 40 million in 2016), reflecting the dividend received from Assicurazioni Generali (EUR 16 million, versus EUR 14 million in 2016) and the contribution made by DeA Capital’s activities. EBITDA for holding company activities/other was negative at EUR 19 million, up by EUR 25 million on 2016, mainly due to the savings on structural costs and the allocation in 2016 of costs relating to long-term incentive plans. ORDINARY EBIT The Group’s ORDINARY EBIT for the year ending December 31, 2017 was EUR 603 million, after deducting depreciation/amortization charges and other ordinary non-cash items totaling EUR 922 million, and income from shareholdings measured at equity totaling EUR 41 million. Amortization, depreciation and other ordinary non-cash items break down as follows: EUR 556 million for amortization and write-downs of intangible assets (EUR 574 million in 2016), especially for customer relationships related to the IGT acquisition in 2016; EUR 366 million relating to depreciation and write-downs of tangible assets (EUR 366 million in 2016). In 2017, the Group reported profit of EUR 41 million from shareholdings measured at equity, compared with a profit of EUR 45 million in 2016; in particular, the 2017 figure included the profit from Grupo Planeta-De Agostini of EUR +30 million (EUR +28 million in 2016) and of LDH/Banijay Group Holding of EUR +5 million (EUR +13 million in 2016). ORDINARY EBIT Figures in EUR million 2017 2016 Change EBITDA 1,484 1,584 (100) Deprec., amort. and other non-cash items (922) (940) 18 Income (loss) from equity investments 41 45 (4) ORDINARY EBIT 603 689 (86)
- 15. ___________________________________________________________________________ ______________________________________________________________________________ 25 Net profit (loss) The table below shows the relationship between ORDINARY EBIT and consolidated net profit/(loss): ORDINARY EBT for 2017 was positive at EUR 186 million, after taking into account net financial expenses of EUR 417 million. A breakdown of net financial charges for 2017 (compared with the corresponding values for 2016) is as follows: EUR -7 million relating to the Publishing business (EUR -8 million in 2016); EUR -396 million relating to the Gaming & Services business (EUR -415 million in 2016); EUR -14 million relating to holding company activities (EUR -20 million in 2016). Non-ordinary charges totaling EUR -1,173 million in 2017 (versus non-ordinary income totaling EUR +9 million in 2016) were included in the NON-ORDINARY EBT figure. Note in particular the following items recorded in 2017: Impairment of EUR -689 million, of which EUR -643 million concerns the Gaming and Services business, primarily relating to goodwill for the North America Gaming & Interactive (NAGI) business of EUR -642 million. This value adjustment had no cash impact, and thus, no impact on the company’s net financial position, and was based on the results of an impairment test performed in view of recent growth projections for the activities in question, which indicated a delay relative to what was projected in the business plan at the end of 2016. In this regard, it should still be noted that, from an analysis of the overall value of IGT – therefore also including operations in Italy, the North American Lottery (NALO) and International – the total figures reported in the latest impairment test were largely confirmed relative to those at the end of 2016 due mainly Net profit (loss) Figures in EUR million 2017 2016 Change ORDINARY EBIT 603 689 (86) Financial income/(charges) (417) (443) 26 ORDINARY EBT (A) 186 246 (60) Impairment (689) (42) (647) Other non-recurring income/(charges) (484) 51 (535) NO - ORDINARY EBT (B) (1,173) 9 (1,182) EBT (A+B) (987) 255 (1,242) Taxes 25 (25) 50 Net profit (loss) from assets sold/discontinued operations 1 43 (42) Consolidated net profit (loss) (961) 273 (1,234) Of which: Net profit (loss) pertaining to minorities (444) 151 (595) Net profit (loss) pertaining to group (517) 122 (639)
- 16. ___________________________________________________________________________ ______________________________________________________________________________ 26 to the significant increase in fair value reported by operations in Italy. In other words, the impairment does not actually reflect a reduction in the overall fair value of the IGT Group, but rather a different distribution in value among the various business units, which penalizes Gaming as a result of lower actual and future performance than projected in previous business plans. The item Impairment also includes EUR -46 million related to financial assets, primarily related to the goodwill of DeA Capital Real Estate totaling EUR -34 million; Other non-recurring income/(charges) totaling EUR -484 million, of which EUR -391 million relates to the USD/EUR exchange rate effect, mainly due to the conversion of IGT's dollar-based loans into euros. In terms of taxes, income of EUR 25 million was shown in 2017 (compared with a cost of EUR 25 million in 2016); the improvement was due to lower taxable income in 2017. In addition, taxes for 2017 included the tax charge related to the sale of Double Down Interactive, which was offset by the tax benefit from the recent change in US tax regulations. Profit from sold/discontinued operations totaled EUR +1 million in 2017 in relation to the sale of Sigla/SiCollection by DeA Capital. Profit from sold/discontinued operations was EUR +43 million in 2016 due to the capital gain from the sale of Atlas For Men (EUR +32 million) and the reversal to the income statement of the fair value reserve for Banijay Group (EUR +12 million). To summarize, the consolidated net loss for 2017 was EUR 961 million, compared with a profit of EUR 273 million in 2016. The net loss attributable to the Group was EUR 517 million, compared with a profit of EUR 122 million in 2016. In 2017, the net loss attributable to minorities was EUR 444 million (compared with a profit of EUR 151 million in 2016), and mainly reflected EUR -428 million relating to the pro-rata share of the IGT Group's net loss (EUR +150 million in 2016).
- 17. ___________________________________________________________________________ ______________________________________________________________________________ 27 Statement of Performance – IAS 1 A summary version of the Comprehensive Income or Statement of Performance – IAS 1, is shown below. It reports the net profit/(loss) for the year as the sum of the portion recorded on the Income Statement and that posted directly to shareholders' equity: Gains/(losses) relating to available-for-sale financial assets amounted to a positive balance of EUR 33 million in 2017 (negative balance of EUR 46 million in 2016, which included a reduction in the fair value of Assicurazioni Generali totaling EUR -56 million), attributable in particular to fair value increases for Assicurazioni Generali (EUR +22 million) and the IDeA Taste of Italy fund (EUR +10 million) managed by DeA Capital Alternative Funds. Exchange rate gains and losses largely reflect the effects of the conversion into euro of the financial statements of the Group’s companies that are prepared in different currencies. This related in particular to the Gaming & Services business (EUR -232 million compared with EUR +53 million in 2016 and was due mainly to the devaluation of the US dollar against the euro). To summarize, the comprehensive net loss for 2017 was EUR -1,179 million compared with net income of EUR 292 million in 2016; the portion attributable to the Group was a loss of EUR -621 million compared with income of EUR 105 million in 2016. Statement of Performance - IAS 1 Figures in EUR million 2017 2016 Net Profit/(Loss) (A) (961) 273 Items that could be subsequently reclassified within the profit (loss) for the period Profit / (loss) on available-for-sale financial assets 33 (46) Profit / (loss) on traslating foreign operations (235) 48 Profit / (loss) on cash flow hedge (4) 5 Profit / (loss) on investments valued at equity (15) 11 Tax effect 1 1 Items that could be subsequently reclassified within the profit (loss) for the period Profit/(loss) on remeasurement of defined benefit plans 2 - Tax effect - - Other comprehensive income/(loss) (B) (218) 19 Total comprehensive income/(loss) (A+B) (1,179) 292 Of which: Net profit (loss) pertaining to minorities (558) 187 Net profit (loss) pertaining to group (621) 105
- 18. ___________________________________________________________________________ ______________________________________________________________________________ 28 3.4 Statement of financial position The table below shows a summary of the Group’s key figures from the statement of financial position: Goodwill At December 31, 2017, goodwill was EUR 5,005 million (EUR 6,766 million at December 31, 2016), broken down as follows: EUR 34 million relating to the Publishing business (unchanged from December 31, 2016), entirely attributable to School Texts; EUR 4,877 million attributable to the Gaming & Services business (EUR 6,602 million at December 31, 2016); the decrease from December 31, 2016 (EUR -1,725 million) was due to acquisitions (EUR +20 million), the sale of Double Down Interactive (EUR -414 million), impairment related to NAGI (EUR -642 million) and the change in the conversion differences on goodwill denominated in foreign currencies (EUR -689 million); EUR 94 million related to the Finance business (EUR 129 million at December 31, 2016) regarding the acquisition of DeA Capital Alternative Funds SGR (EUR 31 million) and IFIM/FIMIT SGR, now called DeA Capital Real Estate SGR (EUR 62 million). The change compared with December 31, 2016 mainly reflects the impairment of the goodwill of DeA Capital Real Estate totaling EUR -34 million. Other intangible assets Other intangible assets include intellectual property rights, concessions, licenses and trademarks, as well as other intangibles. At December 31, 2017, Other intangible assets totaled EUR 1,946 million (EUR 2,781 million at December 31, 2016), comprising: EUR 33 million relating to the Publishing business (EUR 35 million at December 31, 2016), mainly in respect of publishing investments relating to School Texts, intellectual property rights and basic software and applications; Figures in EUR million Change Goodwill 5,005 6,766 (1,761) Other intangible assets 1,946 2,781 (835) Tangible assets 1,379 1,501 (122) Investments 1,535 1,547 (12) Cash and cash equivalents 1,192 511 681 Other net assets 421 175 246 TOTAL 11,478 13,281 (1,803) for hedging: Financial liabilities 8,441 8,818 (377) Shareholders' equity 3,037 4,463 (1,426) 31.12.2017 31.12.2016
- 19. ___________________________________________________________________________ ______________________________________________________________________________ 29 EUR 1,890 million relating to the Gaming & Services business (EUR 2,719 million at December 31, 2016), primarily for customer agreements, concessions, licenses and capitalized software. The decrease totaling EUR -829 million in 2017 was attributable to the sale/deconsolidation of Double Down Interactive (EUR -231 million, mainly customer relationships and brands), amortization for the period (EUR -355 million) and the change in conversion differences (EUR -275 million); EUR 23 million relating to the Finance business (EUR 27 million at December 31, 2016), chiefly due to customer contracts and performance fees for asset management, project management and agency activities. Tangible assets At December 31, 2017, tangible assets totaled EUR 1,379 million (EUR 1,501 million at December 31, 2016), which breaks down as follows: Real estate totaling EUR 81 million (EUR 230 million at December 31, 2016); Other tangible assets totaling EUR 1,298 million (EUR 1,271 million at December 31, 2016). Real estate (EUR 81 million) includes: EUR 19 million relating to the Publishing business (EUR 20 million at December 31, 2016); EUR 61 million relating to the Gaming & Services business (EUR 208 million at December 31, 2016). The decrease in this item was for the sale, in March 2017, of the property located in Reno, Nevada, and the concurrent signing of a sale and leaseback agreement; EUR 1 million relating to the Finance business (EUR 2 million at December 31, 2016); Other tangible assets totaled EUR 1,298 million, including: EUR 4 million relating to the Publishing business (EUR 6 million at December 31, 2016); EUR 1,288 million relating to the Gaming & Services business (EUR 1,259 million at December 31, 2016), mainly for terminals and contract-related systems; EUR 5 million relating to holding company activities (EUR 6 million at December 31, 2016). Investments At December 31, 2017, the Group’s investments totaled EUR 1,535 million, a decrease of EUR 12 million on the figure of EUR 1,547 million at end 2016. The table below shows a breakdown of this item: At December 31, 2017, investment property totaled EUR 51 million (EUR 61 million at December 31, 2016) attributable to the Venere Fund (managed by DeA Capital Alternative Funds), De Investments Figures in EUR million 31.12.2017 31.12.2016 Change Investment properties 51 61 (10) Equity Investments 546 554 (8) Loans and receivables 198 171 27 Available-for-sale financial assets 683 701 (18) Financial assets at fair value through profit or loss 57 60 (3) Total group 1,535 1,547 (12)
- 20. ___________________________________________________________________________ ______________________________________________________________________________ 30 Agostini S.p.A. and Immobiliare San Rocco; the decrease from December 31, 2016 was due to sales of real estate units held by the Venere Fund. Depreciation and write-downs of EUR 1 million were charged for the period (in line with 2016). Shareholdings measured at equity included Grupo Planeta-De Agostini at EUR 338 million (EUR 352 million at December 31, 2016) and LDH/Banijay Group at EUR 133 million (EUR 128 million at December 31, 2016). Loans and receivables totaled EUR 198 million, an increase of EUR 27 million on the balance at December 31, 2016 (EUR 171 million), and mainly include customer financing receivables of IGT. At December 31, 2017, available-for-sale financial assets totaled EUR 683 million, compared with EUR 701 million at December 31, 2016. These mainly include shareholdings not held for trading and units in mutual investment funds. The largest component relates to the investment (included under financial assets) in Assicurazioni Generali shares, recorded at a value of EUR 306 million (EUR 284 million at December 31, 2016), which represented the closing price on December 31, 2017 (EUR 15.20 per share compared with EUR 14.12 per share at December 31, 2016). At December 31, 2017, the Group owned 1.29% of the share capital of Assicurazioni Generali, i.e. 20,130,815 of its shares (unchanged compared with December 31, 2016). Available-for-sale financial assets also included investments in funds (EUR 183 million, of which EUR 170 million is held through the Finance business and EUR 13 million through holding company activities, compared with EUR 193 million at December 31, 2016) and other shareholdings/assets (EUR 191 million, of which EUR 97 million relates to the Finance business and, in particular, the shareholding in Kenan Investments/Migros and in the special-purpose acquisition companies Crescita and IDeaMI, and EUR 81 million to holding company activities, compared with EUR 224 million at December 31, 2016). At December 31, 2017, "Financial assets at fair value through profit and loss" totaled EUR 57 million (EUR 60 million at December 31, 2016); these break down into EUR 1 million relating to the Publishing business (EUR 1 million at December 31, 2016), EUR 5 million relating to the Gaming & Services business (EUR 8 million at December 31, 2016), EUR 35 million relating to the Finance business (EUR 36 million at December 31, 2016), and EUR 16 million relating to holding company activities (EUR 15 million at December 31, 2016). Other net current assets At December 31, 2017, "Other net current assets" totaled EUR +421 million (EUR +175 million at December 31, 2016). The table below shows the items included in this balance, compared with the corresponding values at the end of 2016: Other net assets Figures in EUR million 31.12.2017 31.12.2016 Change Trade receivables/payables: net balance (131) (60) (71) Net balance of non-current assets/liabilities or of discontinued operations held for sale - 11 (11) Net balance of tax assets/liabilities (452) (769) 317 Net balance of other assets/liabilities 1,095 1,097 (2) Provisions (91) (104) 13 Total group 421 175 246
- 21. ___________________________________________________________________________ ______________________________________________________________________________ 31 The net balance of "Trade receivables and payables" comprises trade receivables of EUR 876 million (EUR 1,002 million at December 31, 2016) and trade payables of EUR 1,007 million (EUR 1,062 million at December 31, 2016). At December 31, 2016, "Held-for-sale assets/liabilities" related entirely to Sigla/SiCollection, following the launch, at the end of 2015, of a process to sell these holdings (this process was finalized in 2017). The net balance of "Tax assets and liabilities” includes deferred tax assets of EUR 58 million (EUR 57 million at December 31, 2016) and deferred tax liabilities of EUR 397 million (EUR 705 million at December 31, 2016). The net balance of "Other assets/liabilities" includes other assets totaling EUR 2,530 million (EUR 2,132 million at December 31, 2016), of which EUR 296 million relates to inventories (EUR 384 million at December 31, 2016), and other liabilities totaling EUR 1,435 million (EUR 1,035 million at December 31, 2016). At December 31, 2017, "Provisions" of EUR 91 million (EUR 104 million at December 31, 2016) mainly relate to employment severance indemnity for EUR 19 million (EUR 19 million at December 31, 2016), other employee benefits for EUR 20 million (EUR 26 million at December 31, 2016), the agent severance fund for EUR 4 million (EUR 4 million at December 31, 2016) and provisions for risks and charges, including those for investee companies for EUR 48 million (EUR 54 million at December 31, 2016). Shareholders' equity At December 31, 2017, Group and minorities' consolidated shareholders’ equity totaled EUR 3,037 million (versus EUR 4,463 million at end-2016); Group shareholders’ equity was EUR 1,651 million (EUR 2,464 million at end-2016), while minority interests accounted for EUR 1,386 million (EUR 1,999 million at end-2016). The decrease of EUR 813 million in Group shareholders’ equity in 2017 was due to: net loss of EUR -517 million for 2017; the payment of dividends totaling EUR -23 million; the impact of EUR -58 million from the purchase and sale of own shares; other changes totaling EUR -215 million (including the impact of the exchange rate differences arising on the conversion of the financial statements of the Group’s foreign subsidiaries that have a functional currency other than the euro, totaling EUR -118 million). Shareholders' equity relating to minority interests fell by EUR -613 million due to: net loss of EUR -444 million for 2017; the payment of dividends totaling EUR -126 million (to the minority shareholders of IGT, DeA Capital and De Agostini S.p.A.); other changes totaling EUR -43 million (including the impact of the exchange rate differences arising on the conversion of the financial statements of the Group’s foreign subsidiaries that have a functional currency other than the euro, totaling EUR -115 million).
- 22. ___________________________________________________________________________ ______________________________________________________________________________ 32 Net Financial Position (NFP) The table below shows the Group’s net financial position broken down by business area: The main change in the balance recorded at end-2017 compared with the figure at end-2016 at both Group level and the Gaming & Services business level is due to the positive impact from the sale of Double Down Interactive and the USD/EUR exchange rate effect. With specific reference to holding company activities, the net financial position at December 31, 2017 was a negative figure of EUR -503 million, including payables to banks of EUR -587 million, a De Agostini S.p.A. convertible bond with a nominal value of EUR -80 million, cash and cash equivalents of EUR +154 million and other assets/liabilities of EUR +10 million; the net financial position at December 31, 2017 improved by EUR +79 million over the end-2016 balance due mainly to dividends from investee companies of EUR +153 million, dividends paid to shareholders of EUR -23 million (net of the portion collected by DeA Partecipazioni on the De Agostini S.p.A. shares), purchase of De Agostini S.p.A own shares for EUR -58 million and structural and financial/other charges totaling EUR +7 million. As mentioned earlier, the net financial position is calculated using the figures reported in the financial statements, and is the difference between: (+) cash and cash equivalents, loans, receivables and certain available-for-sale financial assets or assets at fair value through profit and loss; and (-) financial liabilities. The reconciliation statement below shows the key figures in the Consolidated Statement of Financial Position at December 31, 2017 as compared with the amounts included in the net financial position. Net Financial Position Figures in EUR million 31.12.2017 31.12.2016 Change Publishing (108) (89) (19) Games & Services (6,533) (7,523) 990 Finance 133 107 26 Holding (503) (580) 77 Total group (7,011) (8,085) 1,074 Figures in EUR million Carrying amount at 31.12.2017 of which in Net Financial Position INVESTMENTS - NON-CURRENT ASSETS 717 19 Available-for-sale financial assets 679 16 Financial assets at fair value through profit or loss 38 3 LOANS AND RECEIVABLES - NON-CURRENT ASSETS 64 64 INVESTMENTS - CURRENT ASSETS 24 24 Available-for-sale financial assets 5 5 Financial assets at fair value through profit or loss 19 19 LOANS AND RECEIVABLES - CURRENT ASSETS 134 134 CASH AND CASH EQUIVALENTS 1,192 1,188 NON-CURRENT FINANCIAL LIABILITIES (7,442) (7,442) CURRENT FINANCIAL LIABILITIES (998) (998) Net Financial Position - Group (6,309) (7,011)
- 23. ___________________________________________________________________________ ______________________________________________________________________________ 33 The differences, which can be seen in "Available-for-sale financial assets", broadly relate to the classification under this latter asset item that do not meet the requirements for being included in the calculation of net financial position, according to the Group’s accounting principles; specifically, at December 31, 2017, as at December 31, 2016, the most significant differences related to the value of the investments in Assicurazioni Generali, and in funds and other financial investments. For information on the use of financial instruments, pursuant to art. 2428, para. 2, point 6-bis of the Italian Civil Code, please refer to the Notes to the Consolidated Financial Statements for the Year Ending December 31, 2017. * * * In addition to the commentary on the consolidated results, with the related breakdown by business, see the following websites for details on the financial information of the Group’s main businesses, which mainly consist of companies whose shares are traded on regulated markets: www.atresmedia.com www.igt.com www.deacapital.it www.generali.com.
- 24. ___________________________________________________________________________ ______________________________________________________________________________ 34 3.5 Main risks and uncertainties to which the Parent Company and consolidated Group companies are exposed As mentioned in the first section of the Report on Operations, the Group operates in a number of business sectors and in finance and is organized accordingly; each business activity comes under a sub-holding company, which is responsible for the coordination, management and control of all the companies that pertain to it. Alongside the above-mentioned activities, holding company activities are carried out by companies in the holding company structure, which includes the Parent Company and other directly- and indirectly-controlled financial companies. Given its structure and the international arena in which it operates, the Group is exposed to a number of risks and uncertainties, which can be categorized as either systemic risks or specific risks. Such risks may significantly affect the operating performance and financial position of the Parent Company and the other companies included in the Group's Consolidated Financial Statements. Systemic risks relate to trends in macroeconomic variables in the different countries in which the Group operates, and at global level, including GDP, interest rates, inflation, exchange rates and unemployment, as well as the state of the financial markets – which particularly affects access to capital and return on investment (especially financial investment). Specific risks can be analyzed according to individual business areas, and include: for the Publishing business, risks connected with the demand for published products (i.e. partworks, school texts and others), the costs of producing these items, legislative changes and the efficiency and effectiveness of logistics systems; for the Media & Communication business, risks associated with the performance of TV broadcasters (in turn affected by trends in advertising revenues) and the creative abilities required to launch new program formats on the market; for the Gaming & Services business, risks connected with the renewal of existing contracts or licenses, the innovation required to launch new gaming and services products, production capacity for new gaming/lottery management systems, the possibility of a technological malfunction (system and/or terminals) that prevents collection of receipts, and fixed-odds sports betting, where the operator bears the bookmaking risk; for the Finance business, risks connected with typical private equity activity and alternative asset management activity (undertaken by DeA Capital Real Estate SGR and DeA Capital Alternative Funds SGR), and the performance of the investments made. Risks for each business, common to all business areas in which the Group is highly diversified, are also associated with the attitude of management, relationships with employees and suppliers, and integration policies. The specific risks relating to the holding company activities – in addition to those connected with the management of the operations in the above-mentioned business sectors and Finance, and the associated effects on cash flow or dividends – include exposure to specific sectors or investments and the difficulties of identifying opportunities for investments or disposals. Although we stress the significance of the above-mentioned risks for the Group’s operating performance and financial position, we have put in place appropriate measures to limit the impact of any serious negative developments.
- 25. ___________________________________________________________________________ ______________________________________________________________________________ 35 With regard to systemic risks, in the early 2000s the Group started to diversify its investments, both by sector and by geographical area. It now has a widely diversified portfolio of activities combining resilient businesses (such as gaming and related services) with others that have good long-term growth prospects (such as media and content production), all with a strong international footprint. With regard to specific risks, the Group believes it has adopted a modern system of governance for its businesses, facilitating the effective management of complexity and the achievement of the strategic goals of the sub-holding companies and the Group. Specifically, this governance system has set out the procedures for managing relationships between the Parent Company and sub-holding companies, and the responsibilities of the latter concerning the coordination, management and control of all operating companies under their responsibility.