
Recommended
Recommended
More than Just Lines on a Map: Best Practices for U.S Bike Routes
This session highlights best practices and lessons learned for U.S. Bike Route System designation, as well as how and why these routes should be integrated into bicycle planning at the local and regional level.
Presenters:
Presenter: Kevin Luecke Toole Design Group
Co-Presenter: Virginia Sullivan Adventure Cycling AssociationMore than Just Lines on a Map: Best Practices for U.S Bike Routes
More than Just Lines on a Map: Best Practices for U.S Bike RoutesProject for Public Spaces & National Center for Biking and Walking
More Related Content
Featured
More than Just Lines on a Map: Best Practices for U.S Bike Routes
This session highlights best practices and lessons learned for U.S. Bike Route System designation, as well as how and why these routes should be integrated into bicycle planning at the local and regional level.
Presenters:
Presenter: Kevin Luecke Toole Design Group
Co-Presenter: Virginia Sullivan Adventure Cycling AssociationMore than Just Lines on a Map: Best Practices for U.S Bike Routes
More than Just Lines on a Map: Best Practices for U.S Bike RoutesProject for Public Spaces & National Center for Biking and Walking
Featured (20)
AI Trends in Creative Operations 2024 by Artwork Flow.pdf
AI Trends in Creative Operations 2024 by Artwork Flow.pdf
Content Methodology: A Best Practices Report (Webinar)
Content Methodology: A Best Practices Report (Webinar)
How to Prepare For a Successful Job Search for 2024
How to Prepare For a Successful Job Search for 2024
Social Media Marketing Trends 2024 // The Global Indie Insights
Social Media Marketing Trends 2024 // The Global Indie Insights
Trends In Paid Search: Navigating The Digital Landscape In 2024
Trends In Paid Search: Navigating The Digital Landscape In 2024
5 Public speaking tips from TED - Visualized summary
5 Public speaking tips from TED - Visualized summary
Google's Just Not That Into You: Understanding Core Updates & Search Intent
Google's Just Not That Into You: Understanding Core Updates & Search Intent
The six step guide to practical project management
The six step guide to practical project management
Beginners Guide to TikTok for Search - Rachel Pearson - We are Tilt __ Bright...
Beginners Guide to TikTok for Search - Rachel Pearson - We are Tilt __ Bright...
Unlocking the Power of ChatGPT and AI in Testing - A Real-World Look, present...
Unlocking the Power of ChatGPT and AI in Testing - A Real-World Look, present...
More than Just Lines on a Map: Best Practices for U.S Bike Routes
More than Just Lines on a Map: Best Practices for U.S Bike Routes
Graph exp
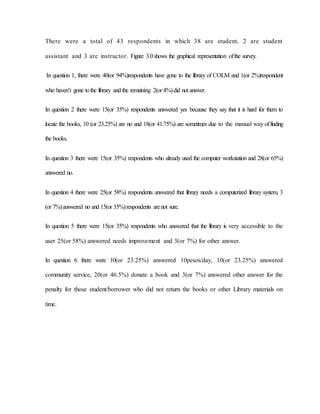
- 1. There were a total of 43 respondents in which 38 are student, 2 are student assistant and 3 are instructor. Figure 3.0 shows the graphical representation of the survey. In question 1, there were 40(or 94%)respondents have gone to the library of COLM and 1(or 2%)respondent who haven’t gone to the library and the remaining 2(or 4%) did not answer. In question 2 there were 15(or 35%) respondents answered yes because they say that it is hard for them to locate the books, 10 (or 23.25%) are no and 18(or 41.75%) are sometimes due to the manual way of finding the books. In question 3 there were 15(or 35%) respondents who already used the computer workstation and 28(or 65%) answered no. In question 4 there were 25(or 58%) respondents answered that library needs a computerized library system, 3 (or 7%) answered no and 15(or 35%) respondents are not sure. In question 5 there were 15(or 35%) respondents who answered that the library is very accessible to the user 25(or 58%) answered needs improvement and 3(or 7%) for other answer. In question 6 there were 10(or 23.25%) answered 10pesos/day, 10(or 23.25%) answered community service, 20(or 46.5%) donate a book and 3(or 7%) answered other answer for the penalty for those student/borrower who did not return the books or other Library materials on time.