COMPARATIVE STUDY OF DOUBLE CHAMBER MICROBIAL FUEL CELLS (DC-MFCS) USING MFENSI CLAY AS ION-EXCHANGE-PARTITION: EFFECT OF POT SIZE
•
1 like•307 views

An alternative answer to the vital issues of power production and wastewater treatment leads to the application of microbial fuel cells. These present cells were constructed from cheap Mfensi clay as ion-exchange-partition and anode chamber. The performance of the cells has no significant variations in relation to their volumes. Experimental results showed that the maximum power densities of 69 mW/m2 and 55 mW/m2 were obtained for Pot1 and Pot2 at 1000 Ω load respectively.

Recommended
Recommended
More Related Content
What's hot
What's hot (19)
Viewers also liked
Viewers also liked (20)
Similar to COMPARATIVE STUDY OF DOUBLE CHAMBER MICROBIAL FUEL CELLS (DC-MFCS) USING MFENSI CLAY AS ION-EXCHANGE-PARTITION: EFFECT OF POT SIZE
Similar to COMPARATIVE STUDY OF DOUBLE CHAMBER MICROBIAL FUEL CELLS (DC-MFCS) USING MFENSI CLAY AS ION-EXCHANGE-PARTITION: EFFECT OF POT SIZE (20)
More from International Journal of Technical Research & Application
More from International Journal of Technical Research & Application (20)
Recently uploaded
Recently uploaded (20)
COMPARATIVE STUDY OF DOUBLE CHAMBER MICROBIAL FUEL CELLS (DC-MFCS) USING MFENSI CLAY AS ION-EXCHANGE-PARTITION: EFFECT OF POT SIZE
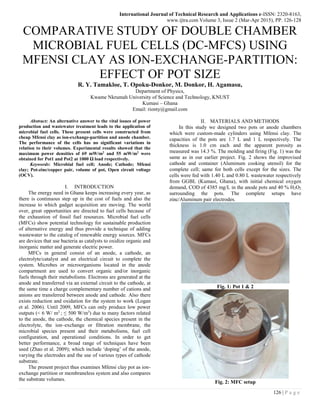
- 1. International Journal of Technical Research and Applications e-ISSN: 2320-8163, www.ijtra.com Volume 3, Issue 2 (Mar-Apr 2015), PP. 126-128 126 | P a g e COMPARATIVE STUDY OF DOUBLE CHAMBER MICROBIAL FUEL CELLS (DC-MFCS) USING MFENSI CLAY AS ION-EXCHANGE-PARTITION: EFFECT OF POT SIZE R. Y. Tamakloe, T. Opoku-Donkor, M. Donkor, H. Agamasu, Department of Physics, Kwame Nkrumah University of Science and Technology, KNUST Kumasi – Ghana Email: rionty@gmail.com Abstract: An alternative answer to the vital issues of power production and wastewater treatment leads to the application of microbial fuel cells. These present cells were constructed from cheap Mfensi clay as ion-exchange-partition and anode chamber. The performance of the cells has no significant variations in relation to their volumes. Experimental results showed that the maximum power densities of 69 mW/m2 and 55 mW/m2 were obtained for Pot1 and Pot2 at 1000 Ω load respectively. Keywords: Microbial fuel cell; Anode; Cathode; Mfensi clay; Pot-zinc/copper pair, volume of pot, Open circuit voltage (OCV). I. INTRODUCTION The energy need in Ghana keeps increasing every year, as there is continuous step up in the cost of fuels and also the increase to which gadget acquisition are moving. The world over, great opportunities are directed to fuel cells because of the exhaustion of fossil fuel resources. Microbial fuel cells (MFCs) show potential technology for sustainable production of alternative energy and thus provide a technique of adding wastewater to the catalog of renewable energy sources. MFCs are devices that use bacteria as catalysts to oxidize organic and inorganic matter and generate electric power. MFCs in general consist of an anode, a cathode, an electrolyte/catalyst and an electrical circuit to complete the system. Microbes or microorganisms located in the anode compartment are used to convert organic and/or inorganic fuels through their metabolisms. Electrons are generated at the anode and transferred via an external circuit to the cathode, at the same time a charge complementary number of cations and anions are transferred between anode and cathode. Also there exists reduction and oxidation for the system to work (Logan et al. 2006). Until 2009, MFCs can only produce low power outputs (< 6 W/ m2 ; ≤ 500 W/m3 ) due to many factors related to the anode, the cathode, the chemical species present in the electrolyte, the ion–exchange or filtration membrane, the microbial species present and their metabolisms, fuel cell configuration, and operational conditions. In order to get better performance, a broad range of techniques have been used (Zhao et al. 2009); which include ‘doping’ of the anode, varying the electrodes and the use of various types of cathode substrate. The present project thus examines Mfensi clay pot as ion- exchange partition or membraneless system and also compares the substrate volumes. II. MATERIALS AND METHODS In this study we designed two pots or anode chambers which were custom-made cylinders using Mfensi clay. The capacities of the pots are 1.7 L and 1 L respectively. The thickness is 1.0 cm each and the apparent porosity as measured was 14.3 %. The molding and firing (Fig. 1) was the same as in our earlier project. Fig. 2 shows the improvised cathode and container (Aluminum cooking utensil) for the complete cell; same for both cells except for the sizes. The cells were fed with 1.40 L and 0.80 L wastewater respectively from GGBL (Kumasi, Ghana), with initial chemical oxygen demand, COD of 4385 mg/L in the anode pots and 40 % H2O2 surrounding the pots. The complete setups have zinc/Aluminum pair electrodes. Fig. 1: Pot 1 & 2 Fig. 2: MFC setup
- 2. International Journal of Technical Research and Applications e-ISSN: 2320-8163, www.ijtra.com Volume 3, Issue 2 (Mar-Apr 2015), PP. 126-128 127 | P a g e III. RESULTS AND DISCUSSION This experiment sorts to compare pot sizes in relationship with the performance. Zinc rod was inserted in the clay/anode pot with aluminum as the cathodic electrode and substrate chamber. As usual we connected the two MFCs to the Datalogger (Campbell Datalogger CR10X) to measure and store initial OCV and potential drop across 1000 Ω resistor for 30 days. Data collected via computer interface and evaluated. The idea is to observe if the there is a significant change in voltage production with the sizes of pot. The two cells were operated at the temperature range of 25 to 27 o C. The results plotted in Fig. 3 show the initial OCV of 863 mV and 844 mV respectively. The drop in voltages at 1000 Ω load was connected similar for both pots. The addition of 1000 Ω load had no significant effect on the potential drops. The expectation in Fig. 4 was that the bigger pot (Pot-1) would produce higher potential difference than the smaller pot. Fig. 3: Variation in potential drop with time Another expectation was that higher current would be produced by the bigger pot since that has more substrate than the smaller pot, but Fig. 4 did not show significant distinction in the two sets of curves. Fig. 4: Variation of potential drop in relation to current with external load applied to the two pots. Fig. 5: Polarization curves for the two pots The polarization and power density curves were obtained by operating the cells at different external circuit resistances (100 –15000 Ω). Potential differences were measured using a Peak Tech (2010DMM) voltmeter and the current were calculated using I = V/R. Current density (I/A)
- 3. International Journal of Technical Research and Applications e-ISSN: 2320-8163, www.ijtra.com Volume 3, Issue 2 (Mar-Apr 2015), PP. 126-128 128 | P a g e and power density (Cur den x V) were calculated and normalized by the anode electrode surface area. Fig. 5 shows current density versus potential drop and power density. By polarization characteristic it is observed that MFC with Pot 1 maintains a voltage as a function of the current production for a longer range. Same range was also depicted in the power curve than Pot 2. The peak occurred lower for Pot 2 than Pot 1 which seems to reach a value beyond 260 mW/m2 . IV. CONCLUSIONS The polarization curves and the plot of power densities versus current densities for both cells loaded with 100 Ω to 15000 Ω were depicted in Fig. 5. It was shown here that power generation by MFC with clay system was greatly influenced by the COD rather than the size of pot. The compensative advantage for pot1 was that it takes longer time to run down than pot2; for the fact that it contains more wastewater. What this means is that we can equally achieve a voltage of about 1.2 V with Mfensi clay cell wShen the volume is reduced to 1 cm operating diameter. Our further studies would tend to focus on reducing the volume more towards a size that makes it portable. Table 1 compared data for the two pots. Table 1 – Selected characteristics of MFCs in this work Pot-1 Pot –2 Initial COD 4385 mg/L 4385 mg/L Final COD 571 mg/L 522 mg/L % COD Removal 86.98 88.10 Apparent Porosity 14.3 % 14.3 % OCV (mV) 863 844 Imax (mA/m2 ) at 1k 100 89 Pmax (mW/m2 ) at 1k 69 55 ACKNOWLEDGEMENTS The authors thank the management of Guiness Ghana Breweries Limited (GGBL) and staffs for the supply of wastewater and their help with the analytical measurements of COD for the entire project. REFERENCES [1] Halliday D, Resnick R, Walker J. In: Extended Fundamentals of Physics. 2010 African Reprint: John Wiley & Sons Co., ISBN 978-81-265-0823-5. Pg 640 [2] Logan, B.E., Hamelers, B., Rozendal, R., Schroder, U., Keller, J., Freguia, S., Aelterman, P., Verstrate, W., Rabaey, K. (2006). “Microbial Fuel Cells: Methodology and Technology”. Environ. Sci. & Technol. /Vol. 40, No. 17. 2006 [3] Logan, B.E. (2008). “Microbial Fuel Cells”. 1Ed; U.S.A: John Wiley and Sons Inc. pp 32-44. [4] Rabaey, K and Verstraete, W, “Microbial fuel cells: novel biotechnology for energy generation”. Trends in Biotechnology Vol.23 No.6 June 2005. [5] Opoku-Donkor, T., Tamakloe, R. Y., Nkum R. K. and Singh, K., “Effect of Cod on OCV, Power Production and Coulombic Efficiency of Single-Chambered Microbial Fuel Cells”, International Journal of Advanced Research in Engineering & Technology (IJARET), Volume 4, Issue 7, 2013, pp. 198 - 206, ISSN Print: 0976-6480, ISSN Online: 0976-6499. [6] Tamakloe, R.Y., Singh, K., Opoku-Donkor, T. (2014). “ as electron acceptor in Double-Chamber Microbial Fuel Cells”. International Journal of Advanced Research in Engineering and Technology. Volume 5, Issue 1, January 2014, pp. 01-06. [7] Zhao, F Robert C. T. Slade, J. R. Varcoe, “Techniques for the study and development of microbial fuel cells:” an electrochemical perspective Chemical Sciences, University of Surrey, Guildford, GU2 7XH, United Kingdom, http://pubs.rsc.org/en/content/articlelanding/2009/cs/b819866 g/unauth#! 17/4/2014 [8] Zielke, E. A., Thermodynamic Analysis of a single chamber Microbial Fuel Cell. May 5, 2006.