Fordham -How effective decision-making is within the IT department - Analysis...
EDM European Equity Strategy Review
1. EDM Strategy Return Date: 31/12/2011
European Equities Portfolio Date: 30/09/2011
Snapshot Fund´s Data
Name EDM Intl Strategy Inception Date 10/31/1990
Global Category Europe Equity Large Cap NAV (Daily, €) 253.92
Custodian / Administrator RBC Dexia Investor Services Bank S.A.
Fund Size (€) 65,497,234.00
Auditor Deloitte S.A.
Domicile Luxembourg Base Currency Euro
UCITS Yes ISIN LU0028445327
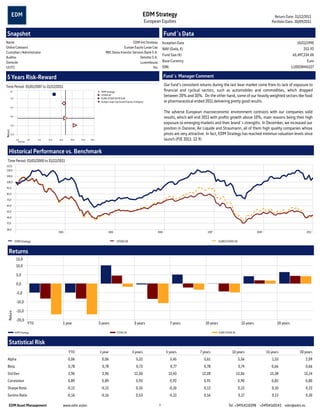
5 Years Risk-Reward Fund´s Manager Comment
Time Period: 01/01/2007 to 31/12/2011 Our fund’s consistent returns during the last bear market come from its lack of exposure to
1,0 EDM Strategy financial and cyclical sectors, such as automobiles and commodities, which dropped
STOXX 50 between 20% and 30%. On the other hand, some of our heavily weighted sectors like food
-2,0 EURO STOXX 50 PR EUR
Europe Large-Cap Growth Equity (Category) or pharmaceutical ended 2011 delivering pretty good results.
-5,0
The adverse European macroeconomic environment contrasts with our companies solid
-8,0
results, which will end 2011 with profits growth above 10%; main reasons being their high
-11,0
exposure to emerging markets and their brand´s strengths. In December, we increased our
position in Danone, Air Liquide and Straumann, all of them high quality companies whose
Return
-14,0 prices are very attractive. In fact, EDM Strategy has reached minimun valuation levels since
0,0
Std Dev
4,0 8,0 12,0 16,0 20,0 24,0 28,0 launch (P/E 2011: 12.9)
Historical Performance vs. Benchmark
Time Period: 01/01/2000 to 31/12/2011
127,0
118,0
109,0
100,0
91,0
82,0
73,0
64,0
55,0
46,0
37,0
28,0
2001 2003 2005 2007 2009 2011
EDM Strategy STOXX 50 EURO STOXX 50
Returns
15,0
10,0
5,0
0,0
-5,0
-10,0
-15,0
Return
-20,0
YTD 1 year 3 years 5 years 7 years 10 years 15 years 20 years
EDM Strategy STOXX 50 EURO STOXX 50
Statistical Risk
YTD 1 year 3 years 5 years 7 years 10 years 15 years 20 years
Alpha 0,06 0,06 5,32 5,45 5,61 3,56 1,53 2,09
Beta 0,78 0,78 0,73 0,77 0,78 0,74 0,66 0,66
Std Dev 3,96 3,96 12,50 13,43 12,28 13,06 13,38 13,14
Correlation 0,89 0,89 0,93 0,92 0,91 0,90 0,82 0,80
Sharpe Ratio -0,12 -0,12 0,35 -0,10 0,12 0,13 0,10 0,22
Sortino Ratio -0,16 -0,16 0,53 -0,13 0,16 0,17 0,13 0,30
EDM Asset Management www.edm.es/en -1- Tel. +34914110398 +34934160143 edm@edm.es
2. EDM Strategy Return Date: 31/12/2011
Portfolio Date: 30/09/2011
European Equities
Portfolio Holdings Equity Sectors Equity Country Exposure
% %
Roche Holding AG 7,1
%
Capita Group (The) PLC 7,0 Basic Materials 3,8
Tesco PLC 6,3 Denmark 7,4
Consumer Cyclical 5,0
Danone 6,2
Sap AG 5,9 Financial Services 4,2 France 21,3
Grifols SA 5,0
Eutelsat Communications 4,4 Real Estate 0,0 Germany 13,2
Bolsas y Mercados Espanoles 4,2 Consumer Defensive 17,4
Coloplast 4,1 Spain 15,7
Essilor International 3,9 Healthcare 26,5
Brenntag AG 3,8 Switzerland 14,6
Utilities 0,0
Industria de Diseño Textil,S.A."inditex" 3,6
Wincor Nixdorf Aktiengesellschaft 3,5 Communication Services 5,5 United Kingdom 27,8
HomeServe PLC 3,3
Novo Nordisk A/S 3,2
Energy 0,0
Straumann Holding AG 3,2 Industrials 25,1
Other 25,2
Total 100,0 Technology 12,4
Portfolio construction Stock picking methodology
• Long-only traditional investment style (bottom-up) •Focus on understandable and predictable businesses at reasonable prices
• Stock picking. No benchmarking (low overlapping against its benchmark) • Management quality & integrity are crucial for us
• Long-term investment horizon (5 years on average) • Demanding criteria: High quality of the business (ROE = 31%)
• Low turnover (15% average for the last 6 years) • Sustainable EPS growth (11%)
• High liquidity (92% of the portfolio can be sold within one trading day) • Low debt balance-sheet (Net Debt/EBITDA = 0,9)
• Restricted investment universe: only 100 companies globally • Recurrent and solid cash-flows
• Concentrated portfolio, maximum 30 companies • Companies focused on emerging markets to generate growth (1/3 Sales)
• Always fully equity invested (competition among stocks) • Following certain long-term Macro-trends
• 100% currency hedged (we do not predict currency fluctuations) • Lack of sectors whose profits are not easily foreseen
Equity Sectors vs benchmarks Style Box
Portfolio Date: 30/09/2011
Morningstar Equity Style Box™
Euro
Strategy Stoxx 50 Market Cap %
Large
Stoxx
Basic Materials 3,84 7,37 5,93 Market Cap Giant 40,1
Mid
Market Cap Large 12,8
Consumer Cyclical 5,00 3,48 9,52
Market Cap Mid 42,7
Small
Financial Services 4,21 19,30 23,21 Market Cap Small 4,3
Market Cap Micro 0,0
Real Estate 0,00 0,00 0,98 Value Blend Growth
Consumer Defensive 17,38 16,30 9,74
Holdings-Based Style
EDM Strategy 30/09/2011
Healthcare 26,53 18,55 7,56 STOXX 50 31/12/2011
Giant
EURO STOXX 50 31/12/2011
Utilities 0,00 3,99 9,06 Europe Large-Cap Growth Equity (Category) 31/12/2011
Large
Communication Services 5,53 9,10 9,21
Mid
Energy 0,00 14,35 9,87
Small
Industrials 25,06 5,04 9,81
Technology 12,44 2,52 5,12
Micro
Deep-Val Core-Val Core Core-Grth High-Grth
EDM Asset Management www.edm.es/en -2- Tel. +34914110398 +34934160143 edm@edm.es