Partnership for Impact Event_Brussels-Nkonya
•Download as PPTX, PDF•
2 likes•1,318 views

"Partnering for Impact: IFPRI-European Research Collaboration for Improved Food and Nutrition Security" presentation by Ephraim Nkonya, IFPRI, on 25 November 2013 in Brussels, Belgium.

Recommended
Recommended
More Related Content
What's hot
What's hot (20)
Similar to Partnership for Impact Event_Brussels-Nkonya
Similar to Partnership for Impact Event_Brussels-Nkonya (20)
More from International Food Policy Research Institute (IFPRI)
More from International Food Policy Research Institute (IFPRI) (20)
Recently uploaded
Recently uploaded (20)
Partnership for Impact Event_Brussels-Nkonya
- 1. Economic Impact of Land Degradation in the Himalayan region & Sub-Saharan Africa & policy implications Dr. Ephraim Nkonya1 Dr. Melanie Requier Desjardins2 Dr. Ho Young Kwon1 Professor Raghavan Srinivasan3 1 International Food Policy Research Institute 2 Researcher, Centre of Economics and Ethics for Environment and Development & member of the French Scientific Committee on Desertification (CSFD) 3 Texas A&M University
- 2. Bhutan, in Pursuit of Happiness • Bhutan measures its economic development in terms of Gross Domestic Happiness (GPH) – Enhancing traditional values, improving people’s standard of living and environmental sustainability • 72% of land area covered with forest – Deforestation rate in 1990-2010 only 0.03% - mainly conversion to built land • 51% of land area protected • Ag land area only 1.8%, but employs 67% of population • Hydroelectric power (HEP) accounts for 22% of GDP – largest sector
- 3. The cost of land degradation • Bhutan spends US$9.6 million to repair turbines damaged by sediment loading, which is 0.53% of country’s GDP – SLM reduces sediment loading by 50% Table 1: Impact of SLM on sediment loading, SWAT results orest Agriculture Citrus orchards Area in 000 Km2 26.31 1.22 0.039 Sediment under SLM T/ha 1.75 4.58 2.98 Baseline % Change Sediment T/ha 3.5 5.93 5.96 50% 23% 50%
- 4. On-farm & off-farm benefits of Sustainable Forest Management (SFM) Benefit of SFM (million US$) in Bhutan The large off-benefit suggests The need for PES to farmers Practicing SLM 7.8 10.14 On-farm Off-site
- 5. What can be done to achieve SFM? • Payment for ecosystem services (PES) with direct tangible benefits to land users – Currently DGPC pays the government 1% of its revenue for encouraging SFM but land users hardly link the PES to SFM • Turn publicly managed forests to community forests – this can increase forest density by 25% (Agarwal 2009 • Secure land tenure, access to roads & extension services enhance SLM
- 7. Economics of land degradation • We evaluate losses due to land degrading land management practices on crops. Empirical models used to determine impact of land management on maize yield • We use past studies and secondary to determine land degradation due to deforestation
- 8. Crop loss due to land degrading practices • Annual yield loss: – Empirical model 2% for two thirds of farmers using low management practices – Long-term experiment, Kenya 4.6% • Such loss is enormous and has negative implications on achieving food security and poverty reduction
- 10. Cropland change in SSA % change Country Botswana Guinea Ethiopia Senegal Equatorial Guinea Baseline, 1973-83 Endline, 1997-2007 Million ha Countries with declining cropland area 0.40 0.24 3.56 3.12 13.63 12.23 3.21 3.08 0.23 0.22 SSA countries with >70% increase in cropland area Benin 1.53 Ghana 3.54 Sierra Leone 0,51 Mauritania 0.22 Mali 2.01 SSA 103.97 2.73 6.34 0.98 0.45 5.17 202.36 -41 -12 -10 -4 -3 79 79 93 106 157 23 Botswana’s large investment into R&D partly explains the countries decrease in Crop land area
- 11. Why farmers replace forests with cropland? Forest ecosystem value Sustainable timber harvesting Fuelwood NTFPs Genetic info Recreation Watershed benefits Climate benefit Existence value Tangible local benefits Global benefits US$/ha 1480 40 50 1500 236 47.5 1280 7 1570 2780 Ecosystem value of forest (US$/ha) Tangible local benefits Global benefits
- 12. Tropical forest vs maize production Benefit (US$/ha) 1800 1600 1400 1200 1000 800 600 400 200 0 1570 Maize has greater returns than forest with no timber deforestation Farmer also need food more than forest products 573 90 Tangible local benefits (no timber) maize proudction Tangible local benefits (with timber)
- 13. Cost of land Degradation in SSA
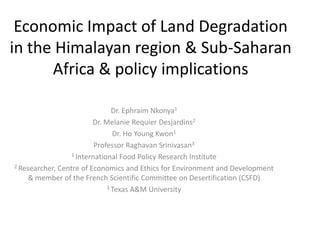
- 14. Cost of desertification in North Africa The Cost of Desertification in North Africa : % of GDP 1,6 1,4 1,2 1 0,8 0,6 % of GDP 0,4 0,2 0 Algeria Sarraf, 2004 Tunisia Morocco Egypt
- 15. Cost of land degradation in SSA Country, year Type of loss Cost AGDP Main Elements of Methodology Rwanda, 2003 Agriculture 3,5% Agr P ; loss of human productivity Ethiopia 2003 Agr, Livstk, For 4% Depth of soil and loss in productivity Ethiopia, 1986 Agriculture <1% Modelling of crop WRS Zimbabwe, 1994 Agriculture <1% Modelling of plants growth, erosion mapping Zimbabwe, 1992 Agriculture, Livestock 8% Cost of replacement, main soils and farms types Malawi, 1992 Agriculture 3% Modelling of soil losses and drop in productivity Berry et al. 2003, Bojo, 1996
- 16. Implications • Direct and tangible local benefits should form basis of decision making • Incentives Build SLM on solid ground – effective governance • PES programs can enhance SLM – especially if they are grounded on local buyers and sellers of ecosystem services • R&D will help increase intensification – lead to saving the forests