Insights from VDSA Meso Level database
•
0 likes•253 views

Agricultural production in India is diversifying from production of cereals towards fruits and vegetables and livestock products such as milk and meat. Between Triennium Ending (TE) 1980-81 and TE 2009-10 the share of value of cereal output in total value of output in agriculture is declining while the shares of high value commodities like fruits, vegetables, milk and meat, is increasing.
Recommended

Recommended
More Related Content
What's hot
What's hot (20)
Viewers also liked
Viewers also liked (16)
Similar to Insights from VDSA Meso Level database
Similar to Insights from VDSA Meso Level database (20)
More from ICRISAT
More from ICRISAT (20)
Recently uploaded
Recently uploaded (20)
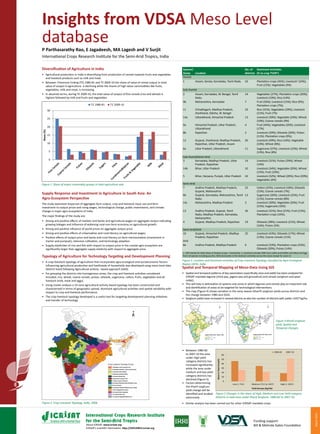
Insights from VDSA Meso Level database
- 1. System/ Zones Location No. of districts Dominant Activities (% to crop TVOP1 ) Humid 1 Assam, Kerala, Karnataka, Tamil Nadu 16 Plantation crops (45%); Livestock2 (24%); Fruit (15%); Vegetables (9%) Sub-Humid 2 Assam, Karnataka, W. Bengal, Tamil Nadu 14 Vegetables (27%); Plantation crops (20%); Livestock (19%); Rice (14%) 9b Maharashtra, Karnataka 7 Fruit (56%); Livestock (15%); Rice (9%); Plantation crops (7%); 11 Chhattisgarh, Madhya Pradesh, Jharkhand, Odisha, W. Bengal 33 Rice (31%); Vegetables (29%); Livestock (21%); Fruit (7%) 14a Uttarakhand, Himachal Pradesh 13 Livestock (39%); Vegetable (24%); Wheat (10%); Coarse cereals (9%) 9a Himachal Pradesh, Uttar Pradesh, Uttarakhand 4 Fruit (44%); Vegetables (20%); Livestock (17%) 8b Rajasthan 2 Livestock (29%); Oilseeds (26%); Pulses (11%); Plantation crops (9%); 12 Gujarat, Jharkhand, Madhya Pradesh, Rajasthan, Uttar Pradesh, Assam 20 Livestock (49%); Rice (16%); Vegetable (10%); Wheat (8%); 6a Uttar Pradesh, Uttarakhand 11 Sugarcane (37%); Livestock (23%); Wheat (13%); Rice (8%) Sub-Humid/Semi-Arid 3 Karnataka, Madhya Pradesh, Uttar Pradesh, Rajasthan 14 Livestock (31%); Pulses (29%); Wheat (14%) 14b Bihar, Uttar Pradesh 10 Livestock (34%); Vegetable (20%); Wheat (15%); Fruit (10%); 5 Bihar, Haryana, Punjab, Uttar Pradesh 42 Livestock (32%); Wheat (26%); Rice (20%); Vegetables (6%) Semi-Arid 7 Andhra Pradesh, Madhya Pradesh, Gujarat, Maharashtra 22 Cotton (25%); Livestock (18%); Oilseeds (15%); Coarse cereals (7%); 6b Gujarat, Karnataka, Maharashtra, Tamil Nadu 13 Sugarcane (26%); Livestock (25%); Fruit (11%); Coarse cereals (8%) 14c Maharashtra, Madhya Pradesh 3 Livestock (30%); Vegetable (20%); Fruit (15%); Sugarcane (10%) 13 Andhra Pradesh, Gujarat, Tamil Nadu, Madhya Pradesh, Karnataka, Maharashtra 36 Livestock (31%); Rice (21%); Fruit (13%); Plantation crops (10%); 4 Gujarat, Madhya Pradesh, Rajasthan 19 Oilseeds (38%); Livestock (21%); Wheat (16%); Pulses (5%) Semi-Arid/Arid 10 Gujarat, Himachal Pradesh, Madhya Pradesh, Rajasthan 25 Livestock (43%); Oilseeds (17%); Wheat (13%); Coarse cereals (11%) Arid 8a Andhra Pradesh, Madhya Pradesh 6 Livestock (33%); Plantation crops (23%); Oilseeds (20%); Pulses (14%) 1. VOP stands for total Value of Output (crops + livestocks). 2. Livestock includes Milk from cattle and buffalo and Meat and Egg from all species including poultry. Milk dominates in the livestock activities across the zones except for zone 13. March2015 Insights from VDSA Meso Level databaseP Parthasarathy Rao, E Jagadeesh, MA Lagesh and V Surjit International Crops Research Institute for the Semi-Arid Tropics, India Diversification of Agriculture in India • Agricultural production in India is diversifying from production of cereals towards fruits and vegetables and livestock products such as milk and meat. • Between Triennium Ending (TE) 1980-81 and TE 2009-10 the share of value of cereal output in total value of output in agriculture is declining while the shares of high value commodities like fruits, vegetables, milk and meat, is increasing. • In absolute terms, during TE 2009-10, the total value of output of fine cereals (rice and wheat) is highest followed by milk and fruits and vegetables. Spatial and Temporal Mapping of Meso-Data Using GIS • Spatial and temporal patterns of key parameters (specifically area and yield) has been analyzed for ICRISAT mandate legume (chick pea, pigeon pea and groundnut) and cereals (sorghum and pearl millet). • This will help in delineation of systems and zones in which legumes and cereals play an important role and identification of areas to be targeted for technological interventions. • The map (Figure 4) shows variation in the rainy season (kharif) sorghum yields across districts and the change between 1980 and 2010. • Sorghum yields have increased in several districts as also the number of districts with yields >1057 kg/ha. Sciencewithahumanface About ICRISAT: www.icrisat.org ICRISAT’s scientific information: http://EXPLOREit.icrisat.org VILLAGE DYNAMICS IN SOUTH ASIA Funding support: Bill & Melinda Gates Foundation Supply Response and Investment in Agriculture in South Asia: An Agro-Ecosystem Perspective The study examined responses of aggregate farm output, crop and livestock input use and farm investment to output prices and rising wages, technological change, public investments, and climate change in major agro-ecosystems of India. The major findings of the study are: • Strong and positive effects of markets and banks and agricultural wages on aggregate output indicating growing linkages and influence of widening rural non-farm economy on agricultural growth. • Strong and positive influence of world prices on aggregate output price. • Strong and positive effects of urbanization and rural literacy on agricultural wages. • Positive effects of output price and banks and rural literacy on farm mechanization (investment in tractor and pumpset), intensive cultivation, and technology adoption. • Supply elasticities of rice and fish with respect to output price in the coastal agro-ecosystem are significantly larger than aggregate supply elasticity with respect to aggregate price. Typology of Agriculture for Technology Targeting and Development Planning • A crop-livestock typology of agriculture that incorporates agro-ecological and socioeconomic factors influencing agricultural production and livelihoods of households was developed using meso-level data (district level) following Agricultural activity - based approach (AAA). • For grouping the districts into homogenous zones, the crop and livestock activities considered included, rice, wheat, coarse cereals, pulses, oilseeds, sugarcane, cotton, fruits, vegetables and all livestock (milk, meat and eggs). • Using cluster analysis a 14-zone agricultural activity based typology has been constructed and characterized in terms of geographic spread, dominant agricultural activities and spatial variability with respect to crop and livestock performance. • The crop-livestock typology developed is a useful tool for targeting development planning initiatives and transfer of technology Figure 1. Share of major commodity groups in total agriculture vale. Figure 2. Crop Livestock Typology, India, 2008. Figure 4 Kharif sorghum yield: Spatial and Temporal changes. Figure 5 Changes in the share of High, Medium and Low Yield category Districts in total area under Kharif Sorghum, 1980-82 to 2007-10. Figure 3. Location and Dominant activities of Crop-Livestock Typology classified by Agro-Ecological Region (AER), India. • Between 1980-82 to 2007-10 the area under High yield category districts has increased significantly while the area under medium and low yield category districts has declined (Figure 5). • Factors determining the Kharif sorghum yield change will be identified and studied extensively • Similar analysis has been carried out for other ICRISAT mandate crops.