2. FIRST BASIC MODELS OF THE ECONOMY
3.) Production Possibilities Curve
1.) Circular Flow Model
2.) Business Cycle Model
3. FIRST BASIC MODELS OF THE ECONOMY
3.) Production Possibilities Curve
1.) Circular Flow Model
2.) Business Cycle Model
3.5) More details about
the PPC
4. 3.) Production
Possibilities Curve
(PPC)
Production
Possibilities Frontier
(PPF)
Also called:
- a graph that shows the
combinations of
two goods the economy
can possibly produce given
the available resources and
the available technology.
FIRST BASIC MODELS OF THE ECONOMY
5. 3.) Production Possibilities Curve
The production possibility
frontier illustrates the trade-
offs facing an economy that
produces only two goods. It
shows the maximum quantity
of one good that can be
produced with available
resources and technology for
any given production of the
other.
Textbook Definition: Mr. H’s Definition:
It’s a simplified
way to show your
trade-offs and
efficiency in
trying to grow an
economy.
6. What concepts are shown on the PPC?
Increasing Opportunity Costs
Trade-offs
Scarcity
Efficiency
Economic Growth
3.) Production Possibilities Curve
7. 1.) Full employment: all resources are used
2.) Productive efficiency: goods are being
produced in the least costly way
4.) Fixed 不变 amount of resources
5.) Fixed 不变 amount of technology
3.) Production Possibilities Curve
Assumptions 假定:
8. 3.) Production Possibilities Curve
A simple Example: A country that only produces two things.
- This is a country with a given
number of people and a given
amount of resources and
technology at a given time.
9. 3.) Production Possibilities Curve
A simple Example: A country that only produces two things.
- Let’s say they take all of their resources
and use it all to only produce butter.黄油
10. 3.) Production Possibilities Curve
A simple Example: A country that only produces two things.
- Or say they take all of their resources and
use it all to only produce guns.枪炮
11. 0
1,000
2,000
3,000
4,000
5,000
6,000
0 100 200 300 400 500 600
AxisTitle
Axis Title
A
E
枪炮
黄油
3.) Production Possibilities Curve
So to put all this onto a graph:
If the country only
made Butter this is
the most they can
make (point E)
If the country only
made Guns this is
the most they can
make (point A)
12. 0
1,000
2,000
3,000
4,000
5,000
6,000
0 100 200 300 400 500 600
AxisTitle
Axis Title
A
B
C
D
E
枪炮
黄油
3.) Production Possibilities Curve
Let’s say they started
by only make guns…
and now they have
decided to make
some butter too.
Which means some
resources are
diverted 转移 from
making guns to making
butter (point B)
The more butter you
make the less guns
you can make…
The line of all the
possible combinations
is the Production
Possibilities Curve!
13. - Economy has 50,000 labor hours per month available for production.
3.) Production Possibilities Curve
So to see this example again with a little more data..
- Two goods: Guns and Butter
-One resource: labor (measured in hours)
-To Produce 1 Gun requires
100 hours labor.
-To Produce 1 Butter requires
10 hours labor.
15. Point
on
graph
Production
枪炮 黄油
A 500 0
B 400 1,000
C 250 2,500
D 100 4,000
E 0 5,000 0
1,000
2,000
3,000
4,000
5,000
6,000
0 100 200 300 400 500 600
AxisTitle
Axis Title
A
B
C
D
E
枪炮
黄油
3.) Production Possibilities Curve
16. 0
1,000
2,000
3,000
4,000
5,000
6,000
0 100 200 300 400 500 600
AxisTitle
Axis Title
A
B
C
D
E
枪炮
黄油
3.) Production Possibilities Curve
So to put all this onto a graph:
If the country only
made Butter this is
the most they can
make (point E)
If the country only
made Guns this is
the most they can
make (point A)
All points along the
curve make up the
Production
Possibilities Frontier!
17. 0
1,000
2,000
3,000
4,000
5,000
6,000
0 100 200 300 400 500 600
AxisTitle
Axis Title
The PPC could be a
straight line, or bow-
shaped.
Depends on what
happens to
opportunity cost
as economy shifts
resources from one
industry
to the other.
3.) Production Possibilities Curve
枪炮
黄油
18. 3.) Production Possibilities Curve
Why the PPC line is curved and not straight?
Increasing
Opportunity
Costs
- At a certain point the
resources used to make
something are less
effective.
19. 3.) Production Possibilities Curve
A simple example: A country that only produces two things.
- ½ of the population are farmers.
- The only thing that they produce is butter.黄油
Why the PPC line is curved and not straight?
20. 3.) Production Possibilities Curve
A simple example: A country that only produces two things.
- ½ of the population are in the military.
- The only thing that they produce is guns.
Why the PPC line is curved and not straight?
21. 3.) Production Possibilities Curve
A simple Example: A country that only produces two things.
- Farmers and their butter. - Military and their guns.
22. 0
1,000
2,000
3,000
4,000
5,000
6,000
0 100 200 300 400 500 600
AxisTitle
Axis Title
3.) Production Possibilities Curve
枪炮
黄油
A
So on this curve this
country is producing
at point A
A = 350 guns
A = 3500 butter
23. 3.) Production Possibilities Curve
A simple Example: A country that only produces two things.
What if the country decided it
wanted to produce more guns?
That means it would have to give
up some of it’s butter production to
get more guns.
However those resources
used in making butter are
not as good at making guns,
so you get more guns but
lose more butter.
24. 0
1,000
2,000
3,000
4,000
5,000
6,000
0 100 200 300 400 500 600
AxisTitle
Axis Title
3.) Production Possibilities Curve
枪炮
黄油
A
Now the country is
producing at point B
A = 350 guns
B
B = 450 guns
A = 3500 butter
+100
-1500
B = 2000 butter
25. 3.) Production Possibilities Curve
A simple Example: A country that only produces two things.
Then if they wanted to
produce even more guns they
would have to give up even
more butter, because these
resources that are good at
making butter are not good at
making guns.
26. 0
1,000
2,000
3,000
4,000
5,000
6,000
0 100 200 300 400 500 600
AxisTitle
Axis Title
3.) Production Possibilities Curve
枪炮
黄油
A
Now the country is
producing at point C
A = 350 guns
B
B = 450 guns
A = 3500 butter
+100
-1500
B = 2000 butter
C
+50
C = 500 guns
-2000
C = 0 butter
27. FIRST BASIC MODELS OF THE ECONOMY
3.) Production Possibilities Curve
1.) Circular Flow Model
2.) Business Cycle Model
3.5) More details about
the PPC
28. More Details about the PPC
What concepts are shown on the PPC?
Increasing Opportunity Costs
Trade-offs
Scarcity
Efficiency
Economic Growth
29. More Details about the PPC
Economic Growth - Sustained expansion of
the production
possibilities frontier
- to have economic growth
means to increase the PPF
so more can be produced
without having to trade-off
for as much.
30. 0
1,000
2,000
3,000
4,000
5,000
6,000
0 100 200 300 400 500 600
AxisTitle
Axis Title
枪炮
黄油
A
So from now on I will
replace guns and
butter with “Capital
goods” and
Consumption goods”
B
C
More Details about the PPC
Consumption
goods
Capital
goods
31. More Details about the PPC
Economic Growth
- The more resources allocated to
consumption goods the more
stuff you have now, but no
increase is made in the future.
-The more resources allocated to
capital goods the more stuff you
can make and the larger your
economy grows
Consumption
goods
Capital
goods
32. 0
1,000
2,000
3,000
4,000
5,000
6,000
0 100 200 300 400 500 600
AxisTitle
Axis Title
More Details about the PPC
Consumption
goods
Capital
goods
A
B
C
Any point that is
OUTSIDE the PPC is
Impossible!
Impossible!
33. 0
1,000
2,000
3,000
4,000
5,000
6,000
0 100 200 300 400 500 600
AxisTitle
Axis Title
More Details about the PPC
Consumption
goods
Capital
goods
A
B
C
D
Any point that is
WITHIN the PPC is
Inefficient.
It means the resources
are not completely
being used.
Inefficient
All
Area!
34. 0
1,000
2,000
3,000
4,000
5,000
6,000
0 100 200 300 400 500 600
AxisTitle
Axis Title
More Details about the PPC
Consumption
goods
Capital
goods
A
B
C
D
Any point that is ON
the PPC is Efficient.
It means the
resources being
completely used.
Efficient
All are
Points!
*** However there are
2 types of efficiency
to discuss here.
35. More Details about the PPC
Productive Efficiency
Types of Efficiency
– Point were resources are being
used efficiently, even if they are
not making the most desired
things are amounts.
***Any point along the PPC line
36. 0
1,000
2,000
3,000
4,000
5,000
6,000
0 100 200 300 400 500 600
AxisTitle
Axis Title
More Details about the PPC
Consumption
goods
Capital
goods
A
B
C
D
Productively
Efficient
Productive Efficiency
Any point along the PPC
line.
All are
Points!
37. More Details about the PPC
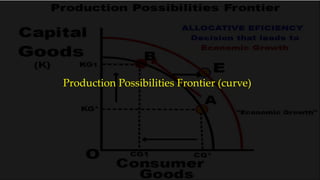
Allocative Efficiency
Types of Efficiency
– A situation in which the quantities
of goods and services produced are
those that people value most and
more can’t be produced unless you
give up something else valued
more highly.
***Only 1 point along the PPC line.
The point you want to be on.
38. 0
1,000
2,000
3,000
4,000
5,000
6,000
0 100 200 300 400 500 600
AxisTitle
Axis Title
More Details about the PPC
Consumption
goods
Capital
goods
A
B
C
D
Allocative
Efficient
Allocative Efficiency
***Only 1 point along the
PPC line.
The point you want to be
on.
Which
single
point do
you want
to produce
at?
39. 0
1,000
2,000
3,000
4,000
5,000
6,000
0 100 200 300 400 500 600
AxisTitle
Axis Title
More Details about the PPC
Consumption
goods
Capital
goods
Economic Growth
- Sustained expansion of
the production
possibilities frontier
- to have economic
growth means to
increase the PPF so
more can be produced
without having to
trade-off for as much.
40. 0
1,000
2,000
3,000
4,000
5,000
6,000
0 100 200 300 400 500 600
AxisTitle
Axis Title
Consumption
goods
Capital
goods
A
Allocative Efficiency
+
Economic Growth
By producing more Capital
goods today, that means
you can have more
Capital goods and
Consumption goods in
the future.
More Details about the PPC
42. 3.) Production Possibilities Curve
The production possibility
frontier illustrates the trade-
offs facing an economy that
produces only two goods. It
shows the maximum quantity
of one good that can be
produced with available
resources and technology for
any given production of the
other.
Textbook Definition: Mr. H’s Definition:
It’s a simplified
way to show your
trade-offs and
efficiency in
trying to grow an
economy.
43. 1.) Full employment: all resources are used
2.) Productive efficiency: goods are being
produced in the least costly way
4.) Fixed 不变 amount of resources
5.) Fixed 不变 amount of technology
3.) Production Possibilities Curve
Assumptions 假定:
44. Point
on
graph
Production
枪炮 黄油
A 500 0
B 400 1,000
C 250 2,500
D 100 4,000
E 0 5,000 0
1,000
2,000
3,000
4,000
5,000
6,000
0 100 200 300 400 500 600
AxisTitle
Axis Title
A
B
C
D
E
枪炮
黄油
3.) Production Possibilities Curve
45. 0
1,000
2,000
3,000
4,000
5,000
6,000
0 100 200 300 400 500 600
AxisTitle
Axis Title
A
B
C
D
E
枪炮
黄油
3.) Production Possibilities Curve
Let’s say they started
by only make guns…
and now they have
decided to make
some butter too.
Which means some
resources are
diverted 转移 from
making guns to making
butter (point B)
The more butter you
make the less guns
you can make…
The line of all the
possible combinations
is the Production
Possibilities Curve!
46. 3.) Production Possibilities Curve
Why the PPC line is curved and not straight?
Increasing
Opportunity
Costs
- At a certain point the
resources used to make
something are less
effective.
47. 0
1,000
2,000
3,000
4,000
5,000
6,000
0 100 200 300 400 500 600
AxisTitle
Axis Title
The PPC could be a
straight line, or bow-
shaped.
Depends on what
happens to
opportunity cost
as economy shifts
resources from one
industry
to the other.
3.) Production Possibilities Curve
枪炮
黄油
48. 0
1,000
2,000
3,000
4,000
5,000
6,000
0 100 200 300 400 500 600
AxisTitle
Axis Title
3.) Production Possibilities Curve
枪炮
黄油
A
Go from point A to Point C
is not equal an trade-off
along the curve.
A = 350 guns
B
B = 450 guns
A = 3500 butter
+100
-1500
B = 2000 butter
C
+50
C = 500 guns
-2000
C = 0 butter
49. 0
1,000
2,000
3,000
4,000
5,000
6,000
0 100 200 300 400 500 600
AxisTitle
Axis Title
Consumption
goods
Capital
goods
A
B
C
D
Any point that is ON
the PPC is Efficient.
It means the
resources being
completely used.
Efficient
All are
Points!
3.) Production Possibilities Curve
50. 0
1,000
2,000
3,000
4,000
5,000
6,000
0 100 200 300 400 500 600
AxisTitle
Axis Title
Consumption
goods
Capital
goods
A
B
C
D
Any point that is
WITHIN the PPC is
Inefficient.
It means the resources
are not completely
being used.
Inefficient
All
Area!
3.) Production Possibilities Curve
51. 0
1,000
2,000
3,000
4,000
5,000
6,000
0 100 200 300 400 500 600
AxisTitle
Axis Title
Consumption
goods
Capital
goods
A
B
C
Any point that is
OUTSIDE the PPC is
Impossible!
Impossible!
3.) Production Possibilities Curve
52. 0
1,000
2,000
3,000
4,000
5,000
6,000
0 100 200 300 400 500 600
AxisTitle
Axis Title
Consumption
goods
Capital
goods
Economic Growth
- Sustained expansion of
the production
possibilities frontier
- to have economic
growth means to
increase the PPF so
more can be produced
without having to
trade-off for as much.
3.) Production Possibilities Curve
53. 0
1,000
2,000
3,000
4,000
5,000
6,000
0 100 200 300 400 500 600
AxisTitle
Axis Title
Consumption
goods
Capital
goods
A
Allocative Efficiency
+
Economic Growth
By producing more Capital
goods today, that means
you can have more
Capital goods and
Consumption goods in
the future.
3.) Production Possibilities Curve