2. International Journal of Management (IJM), ISSN 0976 – 6502(Print), ISSN 0976 - 6510(Online),
Volume 4, Issue 6, November - December (2013)
INTRODUCTION
Small firms, with limited opportunities, limited markets and limited resources, must use
every means available for improving performance and insuring survival. Although many human
resource management (HRM) practices are advocated as leading to firm improvement
and/or survival, little research in this area pertains to small businesses.
The future success of any organization relies on the ability to manage a diverse talent that can
bring innovative ideas, perspectives and views to their work. The challenge and problems faced of
workplace diversity can be turned into a strategic organizational asset if an organization is able to
capitalize on this melting pot of diverse talents.
When Total Quality Management (TQM) first broke onto the management scene, it was
hailed as a revolutionary idea that would speed up production, increase efficiency, and generally
bring success to any organization that pledged allegiance to it. TQM was supposed to bring quality to
the whole organization, changing cultures and breaking down departmental barriers.
And for some organizations, this did indeed turn out be the case. TQM was introduced,
adopted and sustained to create tangible business results. However, for many more this concept
simply failed to deliver. Why? Because in their haste to introduce this culture or mindset to their
businesses, senior managers forgot about the key factor that would make or break this initiative;
people.
Many executives simply did not grasp the fundamental ethos behind TQM – that you could
not introduce systems and procedures to overcome resistance and that diagrams or flow charts would
not equate to culture change. TQM is all about empowering people to make the necessary changes
towards quality and to incorporate this way of working into their everyday tasks. Whilst it is
relatively easy to introduce TQM to a business, the real test comes in sustaining these practices and
making them part of a culture rather than something people feel they “have to do”. In other words
moving from obligation to willful participation.
In today’s era of outsourcing it has been more important to see whether outsourcing has
helped to increase the job opportunities as number of tiers involved in the process increases. Small
units in developing economics are known for technologically backwardness and India is not an
exception. In majority of Indian SSIs there is lack of competitive strength which is due to use of
outdated technology. It is observed that Indian industries are almost the last imitator when it comes
to adaptation of technology. And due to low technology and small scale units the machines and no
hi-tech machines and thus it requires large number of labour force hence the researcher had decided
to probe into this that whether multi tier outsourcing increased employment opportunities and if so
due to large human intervention in the process had it affected the quality adversely.
APPLIED METHODOLOGY
Idea Generation
The automobile industry has seen phenomenal growth during last two decades or so. It was
observed that there was a tremendous pressure on the giants in this field to produce vehicles and
fulfill the production processes carried out by these companies. These changes are distinct from the
changes forced by the technological development. Further, these changes have added different
dimensions to the traditional approaches in almost every function of the business. Certain new
concepts have emerged, such as, Vendor Development, Supply Chain Management, forward and
backward Integration of the production processes, outsourcing etc. While introducing each of such
new concepts, it has been stated that these concepts will lead to reduction of cost with high quality
and greater speed in the production processes.
53
3. International Journal of Management (IJM), ISSN 0976 – 6502(Print), ISSN 0976 - 6510(Online),
Volume 4, Issue 6, November - December (2013)
OBJECTIVE OF THE STUDY
1)
2)
3)
4)
To study the impact of outsourcing on employment generation.
To study the quality of workforce employed at each tier.
To study the impact of human resources on quality of the product.
To study the impact of experience and qualification on the quality of the output.
Universe
There are close to 400 players in the organized sector i.e. tier-I and over 5,000 in the
unorganized sector i.e. tier-II and tier-III. Players in organized sector supply to organized vehicle
manufacturers directly. The unorganized sector, on the other hand, mostly has small units, producing
low-technology components and supply to tier-I organized supplier and predominantly competing in
after-market spare.
Sample size
1) 114 number of tier-II manufacturer who falls under unorganized sector and who are suppliers
to tier –I manufacturer.
Sampling technique used
It was not possible, nor it was necessary, to collect information from the total population.
Instead, a smaller subgroup of the target population or a sample was selected for the purpose of
study. Sampling is the strategy of selecting a smaller section of the population that will accurately
represent the patterns of the target population at large. The main purpose of the sampling was to
improve quality of data by focusing on a smaller group.
The research is about Automobile Sector in Pune region. Pune region has been selected as
there are plenty of SSI’s in this sector and secondly, the researcher found it convenient to focus on
the region on the grounds of vicinity. Tier-I- who are direct vendors to the giant’s vehicles
manufacturer.
Though multi stage sampling is a part of random sampling the researcher has used multistage
sampling for non random sampling for Tier-II vendors.
Sampling design for Tier-II vendors
• N=1000 approximate
• n=114
• sampling ratio 11.4%
• Sampling technique- Non random- Combination of convenience and Judgmental
sampling.
Data Collection
Taking into consideration all the facts the researcher has used.
1) Questionnaire: A structured questionnaire was prepared.
2) Records: Information, data specifically related to the rejection rate and outsourcing tendency
was taken from the records.
3) Individual interviews: Individual’s responses, opinions and views were considered.
54
4. International Journal of Management (IJM), ISSN 0976 – 6502(Print), ISSN 0976 - 6510(Online),
Volume 4, Issue 6, November - December (2013)
Data analysis
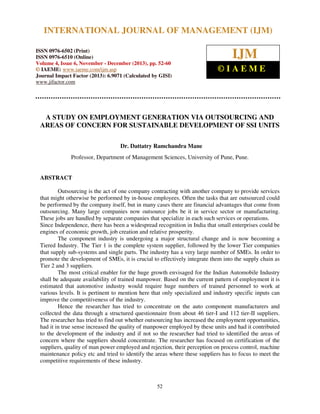
1) Certified Units and their turnover: Proportion of Certified units and there turn over
Percentage of Certified Units
and their Turnover
25 lakhs
4% 50 lakhs
10%
1 cr
19%
1 cr and
above
67%
Observation: From the data analysis it is found that majority of the certified units has turnover of
1Crore and above followed by 50 Lakhs – 1Crore.
2) Non Certified Units and their turnover: Proportion of Non Certified units and there turn
over.
Percentage of Non Certified Units
and their Turnover
25 lakhs
11%
50 lakhs
15%
1 cr and
above
46%
1 cr
28%
Observation: From the data analysis it is found that majority of the non certified units has turnover
of 1Crore and above followed by 50 Lakhs – 1Crore.
3) Employment in certified units
Turn over
25L
50L
1CR
1 CR+
Managers
2
8
23
119
Permanent
Operators
20
45
151
560
55
Contractual
Operators
46
82
75
730
Total
68
135
249
1409
5. International Journal of Management (IJM), ISSN 0976 – 6502(Print), ISSN 0976 - 6510(Online),
Volume 4, Issue 6, November - December (2013)
Observations: From the analysis it is observed that increase in turnover increases employment. It is
also observed that there is more employment generation in companies whose turnover is greater than
1 Cr.
Comments: It is observed that the proportion of contractual operators is greater than that of
permanent operators when the companies turnover is higher than 1 Cr this is due to the technology
which is installed as the company goes for hi-tech machines and automation where human
interference in the process is reduced to a considerable extent and the operator has not much control
on the machine and hence quality of the product is assured due to automation.
4)
Employment in non certified units:
Managers/
Permanent
Turn over Supervisors
Operators
6
31
25L
12
98
50L
36
137
1CR
43
249
1 CR+
Contractual
Operators
50
39
69
234
Total
87
165
287
626
Observations: It is also observed that there is more employment generation in the companies whose
turnover is greater than 1 crore.
Comments: It is revealed that in the initial stage i.e. when the units are small in terms of turnover
the proportion of contractual operators is more but as the turnover increases the proportion of
permanent operators to contractual operators increases which is because of constant growth and
assurance of business and also these units has to maintain quality and the delivery schedules as these
units are not preferred by the OEMs as they are not certified hence to be in the business they have to
focus on quality and delivery schedule to remain in the business hence the proportion of permanent
operators increases as the turn over increases as from the analysis it is observed that permanent
operators are better in quality and rejection is less as compared to contractual operators.
It is also found from the discussions that non certified units are not technology oriented they use
conventional machines and don’t go for hi-tech machines and also automation in the process is not at
a larger scale hence the operators are the key factor for success and hence these operators are made
permanent so that they will remain with them for a longer period.
5) Comparison of Employment in Certified and Non Certified units
Turn over
25L
50L
1CR
1 CR+
Certified
68
135
249
1409
Non Certified
87
165
287
626
Observation: it is revealed that there is growth in employment as the turnover of the company
increases.
Conclusion: it can be concluded that irrespective of the certification there is increase in employment
in both the case due to increase in turnover.
56
6. International Journal of Management (IJM), ISSN 0976 – 6502(Print), ISSN 0976 - 6510(Online),
Volume 4, Issue 6, November - December (2013)
6) Average employment
Average Employment
Certified
4
Non Certified
22.520.62
25 lakhs
22.619.13
50 lakhs
14.5
36.12
25.04
1 cr
1 cr and
above
Observation: it is revealed that there is growth in employment as the turnover of the company
increases.
Conclusion: it can be concluded that irrespective of the certification there is increase in employment
in both the case due to increase in turnover.
7) Category wise manpower employed by certified units
Category wise Manpower
Employed by Certified Units in %
Managers
67.6
60.7
25 Lakhs
Operators
60.6
33.3
29.4
2.9
Supervisors
51.8
39.7
30.1
9.2
6
25-50 Lakhs
50-1 Cr
8.4
1Cr & above
Observation: From the analysis it is observed that there is increase in the proportion of Managers
and Supervisors with increase in turnover which has compensated by reduction in operators.
Comments: Increase in the percentage of managers and supervisors and reduction in operators is
seen with increase in turnover of the company is the result of technology installed by these units. The
turnover increases due to the demand increased as once the company is tried and tested and if they
had delivered the quality products and the scheduled is maintained they are loaded with more jobs
(load) which increases the volume of production. This volume will allow the units to go for SPMs
(special purpose machines) and hi-tech machines which further increases the output without
increasing the manpower (operators). And hence for managing this technology qualified and trained
people are required this resulted in increase in managers and supervisors proportion.
57
7. International Journal of Management (IJM), ISSN 0976 – 6502(Print), ISSN 0976 - 6510(Online),
Volume 4, Issue 6, November - December (2013)
8) Category wise manpower employed by non certified units
Category wise Manpower Employed by
Non Certified units in %
Managers
59.4
57.5
35.6
7.27
6.9
25 Lakhs
Supervisors
Operators
47.7
23.6
25-50 Lakhs
39.7 37.4
24
12.5
6.9
50-1 Cr
1Cr & above
Observation: From the analysis it is observed that there is increase in the proportion of Managers
and Supervisors with increase in turnover which is compensated by reduction in operators.
9) Tier-II certified and non certified in house and outsource rejection in PPM
Tier-II Certified & Non Certified Rejection per
process in PPM
Rejection in PPM
7000
5941
6000
4788
5000
4000
3000
Certified
2740
Non Certified
2309
2000
1000
0
In house Rejection
Outsource Rejection
Observation: After comparing the data for both the groups it is observed that rejection is higher in
case of operation which are outsourced in both the groups. It is also observed that proportion of
rejection per process is more in case of non certified suppliers in both the categories i.e. in house and
outsource operations.
Comments: In house higher rejection by non certified suppliers is due to non standard component
which requires different skill sets and learning. It is also observed that as these orders are non
uniform and in less volume and many times non repetitive in nature, it is not possible for these
suppliers to design a standard process and go for special purpose machines which is designed for
carrying out a specific operation with higher productivity, less chances of rejection and at lower cost.
It is also not possible to do any modification on the machines and also design a measuring instrument
to measure the performance which will reduce rejection and save inspection time if required by that
particular job. The reason is that the order is not of repetitive nature (i.e. assured business) and
volume is also not that high and ensured.
58
8. International Journal of Management (IJM), ISSN 0976 – 6502(Print), ISSN 0976 - 6510(Online),
Volume 4, Issue 6, November - December (2013)
10) Further analysis
Factors
Rejection (per
process)
in
PPM ( Parts
Per Million)
Rework (total)
in PPM
Manager
to
Operator ratio
Permanent
Operators
Technically
qualified
Managers
Rejection
Technically
qualified
supervisor
Rejection
Experience of
Supervisor
Technically
qualified
Operators
Rejection
Experience of
operator
Tier-II
Certified
2309
Tier-II Non
Certified
4788
Comments
10646
22175
8%
Managers
45%
10%
Managers
57%
98%
85%
11823
13780
71%
57%
11455
17188
High
Low
33%
26%
Larger number of technically qualified
operators is employed by certified suppliers.
11525
14365
High
Low
It is found that employing technically qualified
operators reduces rejection.
Higher the experience, lower the rejection
Rejection per process is higher in case of non
certified suppliers and average operation on a
component come out to be 8 operations per
component.
Rework is more than double in case of non
certified suppliers
Better in case of non certified suppliers
Ratio of permanent operators is better in case of
non certified suppliers.
Larger number of technically qualified
managers is employed by certified suppliers.
It is found that employing technically qualified
managers reduces rejection.
Larger number of technically qualified
supervisors is employed by certified suppliers.
It is found that employing technically qualified
supervisors reduces rejection.
Higher the experience, lower the rejection
FINDINGS
1)
2)
3)
4)
5)
6)
From the data analysis it is found that majority of the certified units has turnover of 1Crore
and above followed by 50 Lakhs – 1Crore.
From the data analysis it is found that majority of the non certified units has turnover of
1Crore and above followed by 50 Lakhs – 1Crore.
From the analysis it is observed that increase in turnover increases employment. It is also
observed that there is more employment generation in the companies whose turnover is
greater than 1 Cr.
From the analysis it is observed that increase in turnover increases employment. It is also
observed that there is more employment generation in the companies whose turnover is
greater than 1 Cr.
It is revealed that there is growth in employment as the turnover of the company increases.
From the analysis it is observed that there is increase in the proportion of Managers and
Supervisors with increase in turnover which is compensated by reduction in operators.
59
9. International Journal of Management (IJM), ISSN 0976 – 6502(Print), ISSN 0976 - 6510(Online),
Volume 4, Issue 6, November - December (2013)
7)
8)
9)
10)
11)
12)
13)
After comparing the data for both the groups it is observed that rejection is higher in case of
operation which are outsourced in both the groups. It is also observed that proportion of
rejection per process is more in case of non certified suppliers in both the categories i.e. in
house and outsource operations.
It is revealed that there is growth in employment as the turnover of the company increases
When we distinguish managers into technical and non technical educational qualifications, it
is found that there is not much difference between non certified suppliers and certified
suppliers. It is also found that qualifications of managers have positive impact on quality i.e.
technically qualified managers reduce rejection levels.
In case of supervisors, it is found that non certified suppliers employ less number of
technically qualified supervisors than those of certified suppliers. When we compare the data
for rejection with the qualification of the supervisor, it is found that suppliers employing
more number of technically qualified supervisors have less rejection levels than the supplier
employing non technical supervisor. Hence the researcher can conclude that the technical
qualification of supervisors play an important role in reducing rejection.
It is found that tier-II certified suppliers employ supervisors with higher experience. It is also
revealed from the data that higher the experience, lesser is the rejection. (Certified companies
need to have necessary organization and infrastructures, besides many of them are well
established, growing, large and providing relatively better packages and facilities. Such
companies are able to retain experienced persons).
When we compare the rejection with the qualification of the operator, it is observed that
suppliers employing large number of technically qualified operators have less rejection than
suppliers employing less number of technically qualified operators. From the analysis, it is
also found that percentage of supplier employing technically qualified operators is less in
case of non certified suppliers, hence rejection is higher. Hence the researcher can conclude
that one of the reasons, behind higher rejection at non certified suppliers is employment of
larger number of non technical operators. (Role of skill, education and experience on quality
and productivity is yet to be fully appreciated by many tier II and III vendors).
It is observed that operators employed by non certified suppliers are less experienced than
those employed by certified suppliers. It is also revealed that rejection is higher in non
certified suppliers. (Causes of high employee turnover in non certified company need further
investigation).
REFERENCE
1)
2)
3)
4)
http://www.scribd.com/doc/13653138/Importance-Of-HRM
TQM and HRM – The Human Side to Quality
http://shop.emeraldinsight.com/product_info.htm/products_id/71
Study of Technological Change in Small Enterprises of A Developing Nation: Analytical
framework and empirical examination Institute of economic growth Delhi- India
T.A.Bhavani http://www.iegindia.org/adipub.htm:
5) Dr. Dattatry Ramchandra Mane, “To Study the Impact of Multi-Vendor Outsourcing on the
Performance of the Suppliers and Rejection Levels”, International Journal of Management
(IJM), Volume 4, Issue 2, 2013, pp. 273 - 284, ISSN Print: 0976-6502, ISSN Online:
0976-6510.
60