
Empfohlen
Empfohlen
Weitere ähnliche Inhalte
Ähnlich wie Visualizing Methods for Communication Design
Ähnlich wie Visualizing Methods for Communication Design (20)
Kürzlich hochgeladen
Kürzlich hochgeladen (20)
Visualizing Methods for Communication Design
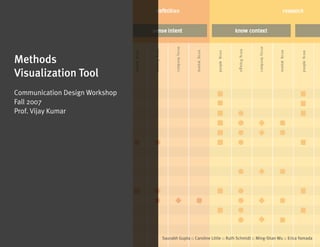
- 1. Methods Visualization Tool Communication Design Workshop Fall 2007 Prof. Vijay Kumar Saurabh Gupta :: Caroline Little :: Ruth Schmidt :: Ming-Shan Wu :: Erica Yamada
- 2. ing Index: project introduction + hypothesis p 2-3 research methods p 4-6 insights p 7-8 early concepts p 9-11 final concept p 12-44 Barney p 13-24 Indira p 25-34 Eduardo p 35-44 steps for moving forward p 45 1
- 3. ng Project Introduction: Currently, data about and supporting ID methods exists in three separate locations: • The ID Wiki • The Innovation Exchange • Project Gallery on Institute of Design website ID Wiki Innovation Exchange Project Gallery 2
- 4. Project Hypothesis: Create a user-friendly system that combines: information... about methods from the ID wiki case studies... from the Innovation Exchange student project examples... from the project gallery 3
- 5. Research Methods: Overview (14) interviews conducted with the following constituents: • Recent alumni • ID staff • Foundation students • First year students • Second year students 1.5 hour long in-class workshop conducted to explore preliminary ideas and gain feedback on what kind of information is most important to users 4
- 6. Research Methods: Personas Personas were created out of information gathered from interview responses. Because the audience for the Methods Visualization Tool encompasses users with a wide range of experience with methods, the Tool needs to provide different levels of information. (3) main types of users were identified: • beginner (incoming ID student) • intermediate (second year ID student) • expert (ID alum) 5
- 7. Research Methods: In-Class Workshop Workshop participants were given a one of the three personas and a use case scenario and then asked to brainstorm types of information needed to perform the user goal in the Methods Visualization Tool. Then, participants used a target to rank the types of information, with the bulls-eye marking the most important data and the outer rings being less important. 6
- 8. Insights: User Needs • Ability to search by class in which method was taught, or by “trusted source” • Filters to narrow methods by process step, inputs, outputs, etc. • Visual cues as memory prompts: names don’t always stick • Case studies/real world examples • Ability to view methods in context/by relationships, not just by individual pages per method • Identification of “packages” that indicate which methods work well together • Increased profile of Innovation Toolkit • Multiple visualizations of underlying data to support various user goals 7
- 9. Insights: Information Analysis All information presented by the Methods Visualization tool can roughly be broken down according to granular, concrete information or higher-level, abstract thoughts. In this way, all types of users are accommodated. concrete abstract detailed method basic method description information higher-level connections method use case between sets of methods information innovation case studies student projects that not linked to a particular support a specific mode method of method use 8
- 10. Early Concepts: ideas explored: use of methods timeline pop-up window for more information keyword search for quick access to data color to separate and differentiate methods 9
- 11. Early Concepts, continued: ideas explored: “favorite” methods tabs on pop-up window to organize information different colors to represent stages in innovation process 10
- 12. Early Concepts, continued: ideas explored: showing visual connections between methods using target shape to visualize methods and year information 11
- 13. Final Concept: The final concept is illustrated through use cases of the three personas established earlier in the process. 12
- 14. Barney 1st year ID student: new to methods Needs: • multiple, intuitive ways to browse the methods collection • examples of how other students have used methods and comments on which methods were most effective • the ability to see the granular detail within the context of the big picture 13
- 15. Barney’s goal: Choose a research method for his Observing Users project. Kind of information Barney needs: concrete abstract 14
- 16. Once signed in to the Methods Visualization Tool, Barney uses the quick search module to search for methods taught in the Observing Users course. 15
- 17. A list of all methods taught in the class appears in alphabetical order. Barney can see the overall rating of each, as well as the relative time required and the innovation phase for each method. 16
- 18. Barney narrows the list by selecting “show only network recommended” option. 17
- 19. Barney has heard good things about the Ethnographic Interview method, so he clicks on the name to see more information and read the summary. 18
- 20. Based on the summary info, Ethnographic Interviews looks like a lot of work, so he checks out Field Observation instead. This method sounds more promising, and takes less time. 19
- 21. He moves the granularity slider in the summary to show specifics and clicks ‘“view details.” 20
- 22. Detailed information about the Field Observation method enlarges as a pop-up window. 21
- 23. Barney clicks over the the “Read Reviews” tab to see what other members said about the usefulness of the Field Observation method. 22
- 24. He then clicks over to the “Project Examples” tab and reviews other projects to see how previous students have used Field Observation in projects. He can tell in which innovation phase Field Observation was used based on the position of the white dot. The length of the colored bars also tells him the relative length of time of each phase. 23
- 25. Barney selects a project to review further and it loads as a pdf. 24
- 26. Indira 2nd year ID student: comfortable with methods Needs: • quick ways to mark and access “favorite” methods • the ability to see methods within the scope of an overall project toolkit (connections between methods, etc..) • a network of community sources she can trust to review method usefulness and time input required 25
- 27. Indira’s goal: Use the Methods Visualization Tool to increase the scope of her methods knowledge. She currently uses similar methods together on a regular basis and is hoping the tool can help her discover new toolkits suitable for upcoming projects. Kind of information Indira needs: concrete abstract 26
- 28. Indira has frequently used the Compelling Experience Framework and is looking for a similar method to map experiences, so she uses the quick search box to go directly to CEF. 27
- 29. The search page returns the result and shows her summary information about the Compelling Experiences Framework. 28
- 30. Indira switches the view of the list by choosing “browse by goal” from the pull-down menu. This allows her to see which methods are similar to the Compelling Experiences Framework. 29
- 31. Indira selects ELITO to look at the summary information. Wanting to know more, Indira selects the medium level of detail and clicks “view details”. 30
- 32. In the pop-up window, she sees information about how ELITO is associated with other methods, which reflects Indira’s need for less granular information. She notices that the Compelling Experience Framework is listed as an analogous method, then selects the comments tab. 31
- 33. On the comments tab, she gets information at a glance—the diameter of the circle indicates how many people viewed a comment, and the amount of yellow indicates how many people thought that comment was useful. Lines indicate which other comments were considered useful by those who viewed the selected one in the center. 32
- 34. She then selects the project view in the pop-up window to see student projects that have used this method in the past. It looks like ELITO would be a good fit, so she clicks the “add to favorites” button. 33
- 35. The ELITO toolkit now appears under Indira’s favorites. 34
- 36. Eduardo ID alum: experienced methods practitioner Needs: • efficient way to search for and visualize real-world innovation case studies • a personalized page that stores personal methods toolkits used • quick search options that allow direct access to the information 35
- 37. Eduardo’s goal: Refresh memory on the use of specific methods and research past method toolkits he used in school to help inform successful strategies for future work projects. Kind of information Eduardo needs: concrete abstract 36
- 38. Eduardo clicks on “my toolkits” and sees a list of his current work projects. He has just started working on a project on healthcare and is curious what archived projects from school he has on the subject. 37
- 39. Eduardo searches the archives for the healthcare. A list of projects appears, including his Healthcare Planning Workshop project. 38
- 40. Eduardo selects the Healthcare Planning Workshop and, by expanding the scratchpad, is able to see the methods toolkit his team used. 39
- 41. Eduardo selects a specific method, the Field Observations, for a refresher on its use and current student comments. 40
- 42. Satisfied with his search for his healthcare project, Eduardo clicks over to InnovationXchange to search for real world innovation examples. 41
- 43. When Eduardo searches for healthcare and emerging markets, case studies are removed from the matrix. 42
- 44. Eduardo zooms in on the capabilities quadrant and names of specific case studies appear. 43
- 45. Eduardo selects one of the case studies for a brief description and link to a pdf download. 44
- 46. Steps for moving forward: • link tool to Project Gallery to allow for access to student projects • ask user community to tag past projects with comments and input ratings and comments on methods themselves • allow users to input their own methods for community review • attempt to classify new InnovationXchange case studies according to method to create new type of data 45