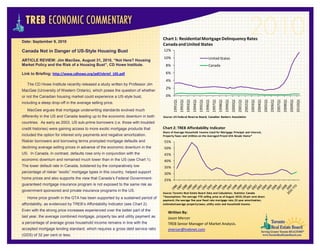
1. Chart 1: Residential Mortgage Delinquency Rates
Date: September 9, 2010
Canada and United States
Canada Not in Danger of US-Style Housing Bust 12%
10% United States
ARTICLE REVIEW: Jim MacGee, August 31, 2010, “Not Here? Housing
Market Policy and the Risk of a Housing Bust”, CD Howe Institute. 8% Canada
Link to Briefing: http://www.cdhowe.org/pdf/ebrief_105.pdf 6%
4%
The CD Howe Institute recently released a study written by Professor Jim
2%
MacGee (University of Western Ontario), which poses the question of whether
or not the Canadian housing market could experience a US-style bust, 0%
1991Q1
1992Q1
1993Q1
1994Q1
1996Q1
1998Q1
2000Q1
2002Q1
2004Q1
2006Q1
2008Q1
2009Q1
2010Q1
1995Q1
1997Q1
1999Q1
2001Q1
2003Q1
2005Q1
2007Q1
including a steep drop-off in the average selling price.
MacGee argues that mortgage underwriting standards evolved much
differently in the US and Canada leading up to the economic downturn in both Source: US Federal Reserve Board; Canadian Bankers Association
countries. As early as 2003, US sub-prime borrowers (i.e. those with troubled
credit histories) were gaining access to more exotic mortgage products that Chart 2: TREB Affordability Indicator
Share of Average Household Income Used for Mortgage Principal and Interest,
included the option for interest only payments and negative amortization. Property Taxes and Utilities on the Averaged Priced GTA Resale Home*
Riskier borrowers and borrowing terms prompted mortgage defaults and 55%
declining average selling prices in advance of the economic downturn in the 50%
US. In Canada, in contrast, defaults rose only in conjunction with the 45%
economic downturn and remained much lower than in the US (see Chart 1). 40%
The lower default rate in Canada, bolstered by the comparatively low 35%
percentage of riskier “exotic” mortgage types in this country, helped support 30%
home prices and also supports the view that Canada’s Federal Government- 25%
guaranteed mortgage insurance program is not exposed to the same risk as
government sponsored and private insurance programs in the US.
Source: Toronto Real Estate Board Data and Calculation; Statistics Canada
*Assumptions: The average YTD selling price as of August 2010; 20 per cent down
Home price growth in the GTA has been supported by a sustained period of
payment; the average five year fixed rate mortgage rate; 25 year amortization;
affordability, as evidenced by TREB’s Affordability Indicator (see Chart 2). estimated average property taxes, utility costs and household income.
Even with the strong price increases experienced over the better part of the
Written By:
last year, the average combined mortgage, property tax and utility payment as Jason Mercer
a percentage of average gross household income remains in line with the TREB Senior Manager of Market Analysis.
accepted mortgage lending standard, which requires a gross debt service ratio jmercer@trebnet.com
(GDS) of 32 per cent or less.