SlideShare a Scribd company logo
1 of 12
perceptual mapping
A technique used in marketing to depict how brands are
perceived relative to one another, when mapped in two or more
dimensions. Also called ‘position mapping’. A list of brands is
specified, e.g. say, ten brands of curry paste. Respondents are
asked to say how similar they think these brands are to one
another (A is similar to C, D is similar to E, etc.). It is
respondents' perceptions of similarity that are captured — these
might not accurately mirror objective similarities, e.g. people
may think A is similar to C when, in fact, the two brands of
curry paste have quite different ingredients. A statistical
procedure is employed to obtain spatial positions of the brands
in multidimensional space to reflect these perceptions. A
common procedure is multidimensional scaling, for which there
is off-the-shelf software, e.g. PREFMAP, INDSCAL. Output is
depicted as a map. This conveys the relative position of the
brands, but does not relate to any absolute measure of distance.
The number of dimensions (two, three, etc.) depends on how
many are needed to plot the data without incurring an
intolerable level of stress. The dimensions themselves are
derived without labels, and great care must be taken in labelling
them. A formal way to label dimensions involves the use of
attribute ratings. At the same time as similarity data are
collected, the researcher asks respondents to rate (on a ratings
scale) each brand for a number of attributes (taste, quality
ingredients, price and so forth). Each attribute is assessed for
how closely it corresponds with the dimensions (low-high price
may be closest to dimension 1; thus, dimension 1 is labelled the
price axis). Although formal, the selection of attributes is
subjective.
In marketing, a popular alternative to the use of similarity data
is the use of preference data, i.e. data where an evaluation of
one item dominates another. Data may be in the form of paired
comparisons (is A preferred over C?) or rankings (A is most
preferred, followed by C, etc.). Similar procedures apply, but
with preference data it is possible to investigate ‘ideal points’,
e.g. by including a hypothetical brand X into the preference
comparisons or ranking. The word ‘ideal’ here is misleading
because X may be far from ideal. It is also possible to locate
ideal combinations of attributes on the map — either for
individual consumers or segments — and see which brands (if
any) are close to the ideal. Various marketing implications
might follow, including the possibility of designing a new
product for an unmet market (seen as an empty quadrant on the
perceptual map) or repositioning an existing product to be
closer to the ideal point of a segment than competitors. This
form of analysis is very beguiling but it can be very misleading,
e.g. an empty quadrant may represent an unmet need or a
phantom market, and a new brand may get closer to the ideal
point of a segment but, in so doing, change the whole
configuration of the map (including a relative shift in the ideal
point). One of the most popular business games, MARKSTRAT,
uses these facets of perceptual mapping to simulate the dynamic
interplay of competing firms in established and new markets.
The technique is applied in product and brand positioning
studies. new product development; positioning; segment-target-
position strategy. Informally, the ideas behind perceptual
mapping are reflected in the thinking of many marketing
managers, even though they may never make use of the formal
techniques.
Exhibit 4–14
“Product Space”
Representing
Consumers’
Perceptions for
Different Brands of
Bar Soap
Each segment may
have its own
preferences
The circles in Exhibit 4-14 show different sets (submarkets) of
consumers clustered
near their ideal soap preferences. Groups of respondents with a
similar ideal product are
circled to show apparent customer concentrations. In this graph,
the size of the circles
suggests the size of the segments for the different ideals.
Ideal clusters 1 and 2 are the largest and are close to two
popular brands—Dial and
Lever 2000. It appears that customers in cluster 2 want more
moisturizing than they see
in Dial. However, exactly what this brand should do about this
isn’t clear. Perhaps Dial
should leave its physical product alone—but emphasize
moisturizing more in its promotion
to make a stronger appeal to those who want moisturizers. A
marketing manager
talking about this approach might simply refer to it as
“positioning the brand as a good
moisturizer.” Of course, whether the effort is successful
depends on whether the whole
marketing mix delivers on the promise of the positioning
communication.
Note that ideal cluster 7 is not near any of the present brands.
This may suggest an opportunity
for introducing a new product—a strong moisturizer with some
deodorizers. A
firm that chooses to follow this approach would be making a
segmenting effort.
Combining versus segmenting
Positioning analysis may lead a firm to combining—rather than
segmenting—if managers
think they can make several general appeals to different parts of
a “combined” market.
For example, by varying its promotion, Coast might try to
appeal to segments 8, 1, and 2
with one product. These segments are all quite similar (close
together) in what they want in
an ideal brand. On the other hand, there may be clearly defined
submarkets—and some
parts of the market may be “owned” by one product or brand. In
this case, segmenting efforts
may be practical—moving the firm’s own product into another
segment of the general
market area where competition is weaker.
A positioning analysis helps managers understand how
customers see their market. It is
a visual aid to understanding a product-market. The first time
such an analysis is done,
managers may be shocked to see how much customers’
perceptions of a market differ
from their own. For this reason alone, positioning analysis may
be crucial. But a positioning
analysis usually focuses on specific product features and brands
that are closecompetitors in the product-market. Thus, it is a
product-oriented approach. Important
customer -related dimensions—including needs and attitudes—
may be overlooked.
Premature emphasis on product features is dangerous in other
ways as well. As our bar
soap example shows, starting with a product-oriented definition
of a market and how bar
soaps compete against other bar soaps can make a firm miss
more basic shifts in markets.
For example, bars have lost popularity to liquid soaps. Other
products, like bath oils or
body washes for use in the shower, are now part of the relevant
competition also. Managers
wouldn’t see these shifts if they looked only at alternative bar
soap brands—the focus
is just too narrow.
It’s also important to realize that the way consumers look at a
product isn’t just a
matter of chance. Let’s return to our bar soap example. While
many consumers do
think about soap in terms of moisturizing and deodorizing, other
needs shouldn’t be
overlooked. For example, some consumers are especially
concerned about wiping out
germs. Marketers for Dial soap recognized this need and
developed ads that positioned
Dial as “the choice” for these target customers. This helped Dial
win new customers,
including those who switched from Lifebuoy—which was
otherwise similar to Dial
(see Exhibit 4-14). In fact, what happened to Lifebuoy
highlights what happens if
managers don’t update their marketing strategy as customer
needs and competition
change. Lifebuoy was the first deodorant soap on the market; it
was a leading brand
for over 100 years. But it gradually lost sales to competitors
with stronger marketing
mixes (clearer differentiation, better positioning, and superior
customer value) until
sales declined and Lever stopped selling it.
Sometimes marketing managers use a positioning statement to
provide focus for a
marketing mix. A pos i tioning statement concisely identifies
the firm’s desired target market,
product type, primary benefit or point of differentiation, and the
main reasons a
buyer should believe the firm’s claims. The one or two benefits
highlighted in the statement
should be those most important to the target market—and
unique to the brand.
It’s important that everyone involved in planning the marketing
strategy agree with the
positioning statement because it helps narrow options and guide
the selection of a marketing
mix.
Some firms use a template like the following to aid in
preparation of a positioning
stat e ment:
For ( our target market ), ( our brand ) of all ( product type )
delivers ( key benefit or point of differenti
a tion ) because ( our brand ) is ( reasons to believe ).
A few years ago, marketing managers for Mountain Dew used
this template to develop
the following pos i tioning statement:
For 16 to 24-year-old males, who embrace excitement,
adventure, and fun, Mountain Dew of
all ca r bonated soft drinks, delivers great taste that exhilarates
like no other because Mountain
Dew is energizing, thirst-quenching, and has a one-of-a-kind ci
t rus flavor.
The positioning statement provided Mountain Dew’s advertising
agency with a dire
c tion to follow that lead to a series of television commercials
that reinforced this pos itioning.
The statement guided decisions about packaging, point-of-
purchase prom o tion,
sponsorships, the look and feel of a website, and new flavors.
The marketing strategy
based on this positioning helped Mountain Dew gain market
share with this target
market. 17
As we emphasize throughout the text, you must understand
potential needs and attitudes
when planning marketing strategies. If customers treat different
products as substitutes,
then a firm has to position itself against those products too.
Customers won’t always
be conscious of all of the detailed ways that a firm’s marketing
mix might be different, but
careful positioning can help highlight a unifying theme or
benefits that relate to the determining
dimensions of the target market. Thus, it’s useful to think of
positioning as part of
the broader strategy planning process—because the purpose is
to ensure that the whole
marketing mix is positioned for competitive advantage.
Positioning statement
provides direction for
marketing strategy
perceptual mapping
A technique used in marketing to depict how brands are
perceived relative to one another, when mapped
in two or more dimensions. Also called ‘position mapping’. A
list of brands is specified, e.g. say, ten
brands of curry paste. Respondents are asked to sa
y how similar they think these brands are to one
another (A is similar to C, D is similar to E, etc.). It is
respondents' perceptions of similarity that are
captured
—
these might not accurately mirror objective similarities, e.g.
people may think A is sim
ilar to C
when, in fact, the two brands of curry paste have quite different
ingredients. A statistical procedure is
employed to obtain spatial positions of the brands in
multidimensional space to reflect these perceptions.
A common procedure is multidimens
ional scaling, for which there is off
-
the
-
shelf software, e.g.
PREFMAP, INDSCAL. Output is depicted as a map. This
conveys the relative position of the brands, but
does not relate to any absolute measure of distance.
The number of dimensions (two, three, e
tc.) depends on how many are needed to plot the data without
incurring an intolerable level of stress. The dimensions
themselves are derived without labels, and great
care must be taken in labelling them. A formal way to label
dimensions involves the use o
f attribute
ratings. At the same time as similarity data are collected, the
researcher asks respondents to rate (on a
ratings scale
) each brand for a number of attributes (taste, quality
ingredients, price and so forth). Each
attribute is assessed for how closely it corresponds with the
dimensions (low
-
high price may be closest to
dimension 1; thus, dimension 1 is labelled the price a
xis). Although formal, the selection of attributes is
subjective.
In marketing, a popular alternative to the use of similarity data
is the use of preference data, i.e. data
where an evaluation of one item dominates another. Data may
be in the form of paire
d comparisons (is A
preferred over C?) or rankings (A is most preferred, followed by
C, etc.). Similar procedures apply, but
with preference data it is possible to investigate ‘ideal points’,
e.g. by including a hypothetical brand X into
the preference com
parisons or ranking. The word ‘ideal’ here is misleading
because X may be far from
ideal. It is also possible to locate ideal combinations of
attributes on the map
—
either for individual
consumers or segments
—
and see which brands (if any) are close to t
he ideal. Various marketing
implications might follow, including the possibility of
designing a new product for an unmet market (seen
as an empty quadrant on the perceptual map) or repositioning an
existing product to be closer to the ideal
point of a segm
ent than competitors. This form of analysis is very beguiling but
it can be very misleading,
e.g. an empty quadrant may represent an unmet need or a
phantom market, and a new brand may get
closer to the ideal point of a segment but, in so doing, change
the
whole configuration of the map
(including a relative shift in the ideal point). One of the most
popular business games, MARKSTRAT,
uses these facets of perceptual mapping to simulate the dynamic
interplay of competing firms in
established and new markets.
The technique is applied in product and brand positioning
studies.
new product development
;
positioning
;
segment
-
target
-
position strategy
. Informally, the ideas behind perceptual mapping are
reflected in the thinking of
many marketing managers, even though they may never make
use of the
formal techniques.
perceptual mapping
A technique used in marketing to depict how brands are
perceived relative to one another, when mapped
in two or more dimensions. Also called ‘position mapping’. A
list of brands is specified, e.g. say, ten
brands of curry paste. Respondents are asked to say how similar
they think these brands are to one
another (A is similar to C, D is similar to E, etc.). It is
respondents' perceptions of similarity that are
captured — these might not accurately mirror objective
similarities, e.g. people may think A is similar to C
when, in fact, the two brands of curry paste have quite different
ingredients. A statistical procedure is
employed to obtain spatial positions of the brands in
multidimensional space to reflect these perceptions.
A common procedure is multidimensional scaling, for which
there is off-the-shelf software, e.g.
PREFMAP, INDSCAL. Output is depicted as a map. This
conveys the relative position of the brands, but
does not relate to any absolute measure of distance.
The number of dimensions (two, three, etc.) depends on how
many are needed to plot the data without
incurring an intolerable level of stress. The dimensions
themselves are derived without labels, and great
care must be taken in labelling them. A formal way to label
dimensions involves the use of attribute
ratings. At the same time as similarity data are collected, the
researcher asks respondents to rate (on a
ratings scale) each brand for a number of attributes (taste,
quality ingredients, price and so forth). Each
attribute is assessed for how closely it corresponds with the
dimensions (low-high price may be closest to
dimension 1; thus, dimension 1 is labelled the price axis).
Although formal, the selection of attributes is
subjective.
In marketing, a popular alternative to the use of similarity data
is the use of preference data, i.e. data
where an evaluation of one item dominates another. Data may
be in the form of paired comparisons (is A
preferred over C?) or rankings (A is most preferred, followed by
C, etc.). Similar procedures apply, but
with preference data it is possible to investigate ‘ideal points’,
e.g. by including a hypothetical brand X into
the preference comparisons or ranking. The word ‘ideal’ here is
misleading because X may be far from
ideal. It is also possible to locate ideal combinations of
attributes on the map — either for individual
consumers or segments — and see which brands (if any) are
close to the ideal. Various marketing
implications might follow, including the possibility of
designing a new product for an unmet market (seen
as an empty quadrant on the perceptual map) or repositioning an
existing product to be closer to the ideal
point of a segment than competitors. This form of analysis is
very beguiling but it can be very misleading,
e.g. an empty quadrant may represent an unmet need or a
phantom market, and a new brand may get
closer to the ideal point of a segment but, in so doing, change
the whole configuration of the map
(including a relative shift in the ideal point). One of the most
popular business games, MARKSTRAT,
uses these facets of perceptual mapping to simulate the dynamic
interplay of competing firms in
established and new markets.
The technique is applied in product and brand positioning
studies. new product development;
positioning; segment-target-position strategy. Informally, the
ideas behind perceptual mapping are
reflected in the thinking of many marketing managers, even
though they may never make use of the
formal techniques.

More Related Content

Similar to perceptual mapping A technique used in marketing to depict how b.docx

L-5.3 Strategic Marketing.pptx
L-5.3 Strategic Marketing.pptxL-5.3 Strategic Marketing.pptx
L-5.3 Strategic Marketing.pptxFuad Hasan
 
Unit2 market segmentation2
Unit2 market segmentation2Unit2 market segmentation2
Unit2 market segmentation2Subhajit Sanyal
 
Product and Services Strategies
Product and Services StrategiesProduct and Services Strategies
Product and Services StrategiesISAAC Jayant
 
Importing, Exporting and SourcingWhat’s this chapter about
Importing, Exporting and SourcingWhat’s this chapter aboutImporting, Exporting and SourcingWhat’s this chapter about
Importing, Exporting and SourcingWhat’s this chapter aboutMalikPinckney86
 
Recently, Walmart announced it would begin selling organic food prod.docx
Recently, Walmart announced it would begin selling organic food prod.docxRecently, Walmart announced it would begin selling organic food prod.docx
Recently, Walmart announced it would begin selling organic food prod.docxdanas19
 
Aaker 1996 Measuring Brand Equity Across Products And Markets
Aaker 1996 Measuring Brand Equity Across Products And MarketsAaker 1996 Measuring Brand Equity Across Products And Markets
Aaker 1996 Measuring Brand Equity Across Products And MarketsJim Webb
 
Brand equity presentation
Brand equity presentationBrand equity presentation
Brand equity presentationutuutkarsh
 
Why Do Firms Cluster in Strategic Groups ©
 Why Do Firms Cluster in Strategic Groups     ©  Why Do Firms Cluster in Strategic Groups     ©
Why Do Firms Cluster in Strategic Groups © MoseStaton39
 
Balancing Centrality and Distinctiveness for Mapping Brand Strategy
Balancing Centrality and Distinctiveness for Mapping Brand StrategyBalancing Centrality and Distinctiveness for Mapping Brand Strategy
Balancing Centrality and Distinctiveness for Mapping Brand StrategyMd. Moulude Hossain
 
LO1 workbook Marketing and PR
LO1 workbook Marketing and PRLO1 workbook Marketing and PR
LO1 workbook Marketing and PRTheJellehKed
 
Marketing mix-Types-4 p's,7p's-scope and Importance.
Marketing mix-Types-4 p's,7p's-scope and Importance.Marketing mix-Types-4 p's,7p's-scope and Importance.
Marketing mix-Types-4 p's,7p's-scope and Importance.ranjith13004
 

Similar to perceptual mapping A technique used in marketing to depict how b.docx (20)

Market plan
Market planMarket plan
Market plan
 
L-5.3 Strategic Marketing.pptx
L-5.3 Strategic Marketing.pptxL-5.3 Strategic Marketing.pptx
L-5.3 Strategic Marketing.pptx
 
MARKETING-CH5
MARKETING-CH5MARKETING-CH5
MARKETING-CH5
 
LO1 Workbook
LO1 Workbook LO1 Workbook
LO1 Workbook
 
Unit2 market segmentation2
Unit2 market segmentation2Unit2 market segmentation2
Unit2 market segmentation2
 
Product and Services Strategies
Product and Services StrategiesProduct and Services Strategies
Product and Services Strategies
 
Importing, Exporting and SourcingWhat’s this chapter about
Importing, Exporting and SourcingWhat’s this chapter aboutImporting, Exporting and SourcingWhat’s this chapter about
Importing, Exporting and SourcingWhat’s this chapter about
 
Recently, Walmart announced it would begin selling organic food prod.docx
Recently, Walmart announced it would begin selling organic food prod.docxRecently, Walmart announced it would begin selling organic food prod.docx
Recently, Walmart announced it would begin selling organic food prod.docx
 
Aaker 1996 Measuring Brand Equity Across Products And Markets
Aaker 1996 Measuring Brand Equity Across Products And MarketsAaker 1996 Measuring Brand Equity Across Products And Markets
Aaker 1996 Measuring Brand Equity Across Products And Markets
 
Positioning
PositioningPositioning
Positioning
 
Brand equity presentation
Brand equity presentationBrand equity presentation
Brand equity presentation
 
Why Do Firms Cluster in Strategic Groups ©
 Why Do Firms Cluster in Strategic Groups     ©  Why Do Firms Cluster in Strategic Groups     ©
Why Do Firms Cluster in Strategic Groups ©
 
Slide_R_A_A2 slide #7
Slide_R_A_A2 slide #7Slide_R_A_A2 slide #7
Slide_R_A_A2 slide #7
 
Advertising
AdvertisingAdvertising
Advertising
 
How To Write A Killer Marketing Plan
How To Write A Killer Marketing Plan How To Write A Killer Marketing Plan
How To Write A Killer Marketing Plan
 
How To Write A Killer Marketing Plan
How To Write A Killer Marketing PlanHow To Write A Killer Marketing Plan
How To Write A Killer Marketing Plan
 
Brand
BrandBrand
Brand
 
Balancing Centrality and Distinctiveness for Mapping Brand Strategy
Balancing Centrality and Distinctiveness for Mapping Brand StrategyBalancing Centrality and Distinctiveness for Mapping Brand Strategy
Balancing Centrality and Distinctiveness for Mapping Brand Strategy
 
LO1 workbook Marketing and PR
LO1 workbook Marketing and PRLO1 workbook Marketing and PR
LO1 workbook Marketing and PR
 
Marketing mix-Types-4 p's,7p's-scope and Importance.
Marketing mix-Types-4 p's,7p's-scope and Importance.Marketing mix-Types-4 p's,7p's-scope and Importance.
Marketing mix-Types-4 p's,7p's-scope and Importance.
 

More from herbertwilson5999

Write a 5-7 page paper describing the historical development of info.docx
Write a 5-7 page paper describing the historical development of info.docxWrite a 5-7 page paper describing the historical development of info.docx
Write a 5-7 page paper describing the historical development of info.docxherbertwilson5999
 
Write a  5 paragraph essay related to the healthcare fieldthree.docx
Write a  5 paragraph essay related to the healthcare fieldthree.docxWrite a  5 paragraph essay related to the healthcare fieldthree.docx
Write a  5 paragraph essay related to the healthcare fieldthree.docxherbertwilson5999
 
Write at least a six-page paper, in which youIdentify the.docx
Write at least a six-page paper, in which youIdentify the.docxWrite at least a six-page paper, in which youIdentify the.docx
Write at least a six-page paper, in which youIdentify the.docxherbertwilson5999
 
Write a 2 page paper analyzing the fact pattern scenario below. Plea.docx
Write a 2 page paper analyzing the fact pattern scenario below. Plea.docxWrite a 2 page paper analyzing the fact pattern scenario below. Plea.docx
Write a 2 page paper analyzing the fact pattern scenario below. Plea.docxherbertwilson5999
 
Write a 2 page paper analyzing the fact pattern scenario below. .docx
Write a 2 page paper analyzing the fact pattern scenario below. .docxWrite a 2 page paper analyzing the fact pattern scenario below. .docx
Write a 2 page paper analyzing the fact pattern scenario below. .docxherbertwilson5999
 
Write a 100-word response in Spanish that addresses both of .docx
Write a 100-word response in Spanish that addresses both of .docxWrite a 100-word response in Spanish that addresses both of .docx
Write a 100-word response in Spanish that addresses both of .docxherbertwilson5999
 
Write a  Request for Proposal (approx. 3 - 4 pages in a word doc.docx
Write a  Request for Proposal (approx. 3 - 4 pages in a word doc.docxWrite a  Request for Proposal (approx. 3 - 4 pages in a word doc.docx
Write a  Request for Proposal (approx. 3 - 4 pages in a word doc.docxherbertwilson5999
 
Write a  5 paragraph essay related to Physical Therapy Assistant th.docx
Write a  5 paragraph essay related to Physical Therapy Assistant th.docxWrite a  5 paragraph essay related to Physical Therapy Assistant th.docx
Write a  5 paragraph essay related to Physical Therapy Assistant th.docxherbertwilson5999
 
Write a  5 page paper with  at-least three images that represent.docx
Write a  5 page paper with  at-least three images that represent.docxWrite a  5 page paper with  at-least three images that represent.docx
Write a  5 page paper with  at-least three images that represent.docxherbertwilson5999
 
Write a  5 paragraph essay related to the healthcare fieldthree maj.docx
Write a  5 paragraph essay related to the healthcare fieldthree maj.docxWrite a  5 paragraph essay related to the healthcare fieldthree maj.docx
Write a  5 paragraph essay related to the healthcare fieldthree maj.docxherbertwilson5999
 
Write at least Ten sentences on your discussion. Compare and con.docx
Write at least Ten sentences on your discussion. Compare and con.docxWrite at least Ten sentences on your discussion. Compare and con.docx
Write at least Ten sentences on your discussion. Compare and con.docxherbertwilson5999
 
Write at least a three-page analysis using the case study on pages.docx
Write at least a three-page analysis using the case study on pages.docxWrite at least a three-page analysis using the case study on pages.docx
Write at least a three-page analysis using the case study on pages.docxherbertwilson5999
 
Write at least a six-page paper, in which you Identify th.docx
Write at least a six-page paper, in which you Identify th.docxWrite at least a six-page paper, in which you Identify th.docx
Write at least a six-page paper, in which you Identify th.docxherbertwilson5999
 
Write at least a paragraph for each.1) What is your understand.docx
Write at least a paragraph for each.1) What is your understand.docxWrite at least a paragraph for each.1) What is your understand.docx
Write at least a paragraph for each.1) What is your understand.docxherbertwilson5999
 
Write at least 500 words analyzing a subject you find in this .docx
Write at least 500 words analyzing a subject you find in this .docxWrite at least 500 words analyzing a subject you find in this .docx
Write at least 500 words analyzing a subject you find in this .docxherbertwilson5999
 
Write at least 750 words paper on Why is vulnerability assessme.docx
Write at least 750 words paper on Why is vulnerability assessme.docxWrite at least 750 words paper on Why is vulnerability assessme.docx
Write at least 750 words paper on Why is vulnerability assessme.docxherbertwilson5999
 
Write As if You Are Writing in Your Journal (1st Person)Your T.docx
Write As if You Are Writing in Your Journal (1st Person)Your T.docxWrite As if You Are Writing in Your Journal (1st Person)Your T.docx
Write As if You Are Writing in Your Journal (1st Person)Your T.docxherbertwilson5999
 
Write an original, Scholarly Paper, addressing a topic relevant to t.docx
Write an original, Scholarly Paper, addressing a topic relevant to t.docxWrite an original, Scholarly Paper, addressing a topic relevant to t.docx
Write an original, Scholarly Paper, addressing a topic relevant to t.docxherbertwilson5999
 
Write an observation essay that explains the unique significance.docx
Write an observation essay that explains the unique significance.docxWrite an observation essay that explains the unique significance.docx
Write an observation essay that explains the unique significance.docxherbertwilson5999
 
Write an introduction in APA format in about 2 pages to describe.docx
Write an introduction in APA format in about 2 pages to describe.docxWrite an introduction in APA format in about 2 pages to describe.docx
Write an introduction in APA format in about 2 pages to describe.docxherbertwilson5999
 

More from herbertwilson5999 (20)

Write a 5-7 page paper describing the historical development of info.docx
Write a 5-7 page paper describing the historical development of info.docxWrite a 5-7 page paper describing the historical development of info.docx
Write a 5-7 page paper describing the historical development of info.docx
 
Write a  5 paragraph essay related to the healthcare fieldthree.docx
Write a  5 paragraph essay related to the healthcare fieldthree.docxWrite a  5 paragraph essay related to the healthcare fieldthree.docx
Write a  5 paragraph essay related to the healthcare fieldthree.docx
 
Write at least a six-page paper, in which youIdentify the.docx
Write at least a six-page paper, in which youIdentify the.docxWrite at least a six-page paper, in which youIdentify the.docx
Write at least a six-page paper, in which youIdentify the.docx
 
Write a 2 page paper analyzing the fact pattern scenario below. Plea.docx
Write a 2 page paper analyzing the fact pattern scenario below. Plea.docxWrite a 2 page paper analyzing the fact pattern scenario below. Plea.docx
Write a 2 page paper analyzing the fact pattern scenario below. Plea.docx
 
Write a 2 page paper analyzing the fact pattern scenario below. .docx
Write a 2 page paper analyzing the fact pattern scenario below. .docxWrite a 2 page paper analyzing the fact pattern scenario below. .docx
Write a 2 page paper analyzing the fact pattern scenario below. .docx
 
Write a 100-word response in Spanish that addresses both of .docx
Write a 100-word response in Spanish that addresses both of .docxWrite a 100-word response in Spanish that addresses both of .docx
Write a 100-word response in Spanish that addresses both of .docx
 
Write a  Request for Proposal (approx. 3 - 4 pages in a word doc.docx
Write a  Request for Proposal (approx. 3 - 4 pages in a word doc.docxWrite a  Request for Proposal (approx. 3 - 4 pages in a word doc.docx
Write a  Request for Proposal (approx. 3 - 4 pages in a word doc.docx
 
Write a  5 paragraph essay related to Physical Therapy Assistant th.docx
Write a  5 paragraph essay related to Physical Therapy Assistant th.docxWrite a  5 paragraph essay related to Physical Therapy Assistant th.docx
Write a  5 paragraph essay related to Physical Therapy Assistant th.docx
 
Write a  5 page paper with  at-least three images that represent.docx
Write a  5 page paper with  at-least three images that represent.docxWrite a  5 page paper with  at-least three images that represent.docx
Write a  5 page paper with  at-least three images that represent.docx
 
Write a  5 paragraph essay related to the healthcare fieldthree maj.docx
Write a  5 paragraph essay related to the healthcare fieldthree maj.docxWrite a  5 paragraph essay related to the healthcare fieldthree maj.docx
Write a  5 paragraph essay related to the healthcare fieldthree maj.docx
 
Write at least Ten sentences on your discussion. Compare and con.docx
Write at least Ten sentences on your discussion. Compare and con.docxWrite at least Ten sentences on your discussion. Compare and con.docx
Write at least Ten sentences on your discussion. Compare and con.docx
 
Write at least a three-page analysis using the case study on pages.docx
Write at least a three-page analysis using the case study on pages.docxWrite at least a three-page analysis using the case study on pages.docx
Write at least a three-page analysis using the case study on pages.docx
 
Write at least a six-page paper, in which you Identify th.docx
Write at least a six-page paper, in which you Identify th.docxWrite at least a six-page paper, in which you Identify th.docx
Write at least a six-page paper, in which you Identify th.docx
 
Write at least a paragraph for each.1) What is your understand.docx
Write at least a paragraph for each.1) What is your understand.docxWrite at least a paragraph for each.1) What is your understand.docx
Write at least a paragraph for each.1) What is your understand.docx
 
Write at least 500 words analyzing a subject you find in this .docx
Write at least 500 words analyzing a subject you find in this .docxWrite at least 500 words analyzing a subject you find in this .docx
Write at least 500 words analyzing a subject you find in this .docx
 
Write at least 750 words paper on Why is vulnerability assessme.docx
Write at least 750 words paper on Why is vulnerability assessme.docxWrite at least 750 words paper on Why is vulnerability assessme.docx
Write at least 750 words paper on Why is vulnerability assessme.docx
 
Write As if You Are Writing in Your Journal (1st Person)Your T.docx
Write As if You Are Writing in Your Journal (1st Person)Your T.docxWrite As if You Are Writing in Your Journal (1st Person)Your T.docx
Write As if You Are Writing in Your Journal (1st Person)Your T.docx
 
Write an original, Scholarly Paper, addressing a topic relevant to t.docx
Write an original, Scholarly Paper, addressing a topic relevant to t.docxWrite an original, Scholarly Paper, addressing a topic relevant to t.docx
Write an original, Scholarly Paper, addressing a topic relevant to t.docx
 
Write an observation essay that explains the unique significance.docx
Write an observation essay that explains the unique significance.docxWrite an observation essay that explains the unique significance.docx
Write an observation essay that explains the unique significance.docx
 
Write an introduction in APA format in about 2 pages to describe.docx
Write an introduction in APA format in about 2 pages to describe.docxWrite an introduction in APA format in about 2 pages to describe.docx
Write an introduction in APA format in about 2 pages to describe.docx
 

Recently uploaded

Active Learning Strategies (in short ALS).pdf
Active Learning Strategies (in short ALS).pdfActive Learning Strategies (in short ALS).pdf
Active Learning Strategies (in short ALS).pdfPatidar M
 
Choosing the Right CBSE School A Comprehensive Guide for Parents
Choosing the Right CBSE School A Comprehensive Guide for ParentsChoosing the Right CBSE School A Comprehensive Guide for Parents
Choosing the Right CBSE School A Comprehensive Guide for Parentsnavabharathschool99
 
ECONOMIC CONTEXT - PAPER 1 Q3: NEWSPAPERS.pptx
ECONOMIC CONTEXT - PAPER 1 Q3: NEWSPAPERS.pptxECONOMIC CONTEXT - PAPER 1 Q3: NEWSPAPERS.pptx
ECONOMIC CONTEXT - PAPER 1 Q3: NEWSPAPERS.pptxiammrhaywood
 
Barangay Council for the Protection of Children (BCPC) Orientation.pptx
Barangay Council for the Protection of Children (BCPC) Orientation.pptxBarangay Council for the Protection of Children (BCPC) Orientation.pptx
Barangay Council for the Protection of Children (BCPC) Orientation.pptxCarlos105
 
4.16.24 21st Century Movements for Black Lives.pptx
4.16.24 21st Century Movements for Black Lives.pptx4.16.24 21st Century Movements for Black Lives.pptx
4.16.24 21st Century Movements for Black Lives.pptxmary850239
 
How to do quick user assign in kanban in Odoo 17 ERP
How to do quick user assign in kanban in Odoo 17 ERPHow to do quick user assign in kanban in Odoo 17 ERP
How to do quick user assign in kanban in Odoo 17 ERPCeline George
 
HỌC TỐT TIẾNG ANH 11 THEO CHƯƠNG TRÌNH GLOBAL SUCCESS ĐÁP ÁN CHI TIẾT - CẢ NĂ...
HỌC TỐT TIẾNG ANH 11 THEO CHƯƠNG TRÌNH GLOBAL SUCCESS ĐÁP ÁN CHI TIẾT - CẢ NĂ...HỌC TỐT TIẾNG ANH 11 THEO CHƯƠNG TRÌNH GLOBAL SUCCESS ĐÁP ÁN CHI TIẾT - CẢ NĂ...
HỌC TỐT TIẾNG ANH 11 THEO CHƯƠNG TRÌNH GLOBAL SUCCESS ĐÁP ÁN CHI TIẾT - CẢ NĂ...Nguyen Thanh Tu Collection
 
Grade 9 Quarter 4 Dll Grade 9 Quarter 4 DLL.pdf
Grade 9 Quarter 4 Dll Grade 9 Quarter 4 DLL.pdfGrade 9 Quarter 4 Dll Grade 9 Quarter 4 DLL.pdf
Grade 9 Quarter 4 Dll Grade 9 Quarter 4 DLL.pdfJemuel Francisco
 
Field Attribute Index Feature in Odoo 17
Field Attribute Index Feature in Odoo 17Field Attribute Index Feature in Odoo 17
Field Attribute Index Feature in Odoo 17Celine George
 
Q4-PPT-Music9_Lesson-1-Romantic-Opera.pptx
Q4-PPT-Music9_Lesson-1-Romantic-Opera.pptxQ4-PPT-Music9_Lesson-1-Romantic-Opera.pptx
Q4-PPT-Music9_Lesson-1-Romantic-Opera.pptxlancelewisportillo
 
Activity 2-unit 2-update 2024. English translation
Activity 2-unit 2-update 2024. English translationActivity 2-unit 2-update 2024. English translation
Activity 2-unit 2-update 2024. English translationRosabel UA
 
Incoming and Outgoing Shipments in 3 STEPS Using Odoo 17
Incoming and Outgoing Shipments in 3 STEPS Using Odoo 17Incoming and Outgoing Shipments in 3 STEPS Using Odoo 17
Incoming and Outgoing Shipments in 3 STEPS Using Odoo 17Celine George
 
Visit to a blind student's school🧑‍🦯🧑‍🦯(community medicine)
Visit to a blind student's school🧑‍🦯🧑‍🦯(community medicine)Visit to a blind student's school🧑‍🦯🧑‍🦯(community medicine)
Visit to a blind student's school🧑‍🦯🧑‍🦯(community medicine)lakshayb543
 
How to Add Barcode on PDF Report in Odoo 17
How to Add Barcode on PDF Report in Odoo 17How to Add Barcode on PDF Report in Odoo 17
How to Add Barcode on PDF Report in Odoo 17Celine George
 
AUDIENCE THEORY -CULTIVATION THEORY - GERBNER.pptx
AUDIENCE THEORY -CULTIVATION THEORY -  GERBNER.pptxAUDIENCE THEORY -CULTIVATION THEORY -  GERBNER.pptx
AUDIENCE THEORY -CULTIVATION THEORY - GERBNER.pptxiammrhaywood
 
Karra SKD Conference Presentation Revised.pptx
Karra SKD Conference Presentation Revised.pptxKarra SKD Conference Presentation Revised.pptx
Karra SKD Conference Presentation Revised.pptxAshokKarra1
 
Concurrency Control in Database Management system
Concurrency Control in Database Management systemConcurrency Control in Database Management system
Concurrency Control in Database Management systemChristalin Nelson
 
ROLES IN A STAGE PRODUCTION in arts.pptx
ROLES IN A STAGE PRODUCTION in arts.pptxROLES IN A STAGE PRODUCTION in arts.pptx
ROLES IN A STAGE PRODUCTION in arts.pptxVanesaIglesias10
 
ANG SEKTOR NG agrikultura.pptx QUARTER 4
ANG SEKTOR NG agrikultura.pptx QUARTER 4ANG SEKTOR NG agrikultura.pptx QUARTER 4
ANG SEKTOR NG agrikultura.pptx QUARTER 4MiaBumagat1
 

Recently uploaded (20)

FINALS_OF_LEFT_ON_C'N_EL_DORADO_2024.pptx
FINALS_OF_LEFT_ON_C'N_EL_DORADO_2024.pptxFINALS_OF_LEFT_ON_C'N_EL_DORADO_2024.pptx
FINALS_OF_LEFT_ON_C'N_EL_DORADO_2024.pptx
 
Active Learning Strategies (in short ALS).pdf
Active Learning Strategies (in short ALS).pdfActive Learning Strategies (in short ALS).pdf
Active Learning Strategies (in short ALS).pdf
 
Choosing the Right CBSE School A Comprehensive Guide for Parents
Choosing the Right CBSE School A Comprehensive Guide for ParentsChoosing the Right CBSE School A Comprehensive Guide for Parents
Choosing the Right CBSE School A Comprehensive Guide for Parents
 
ECONOMIC CONTEXT - PAPER 1 Q3: NEWSPAPERS.pptx
ECONOMIC CONTEXT - PAPER 1 Q3: NEWSPAPERS.pptxECONOMIC CONTEXT - PAPER 1 Q3: NEWSPAPERS.pptx
ECONOMIC CONTEXT - PAPER 1 Q3: NEWSPAPERS.pptx
 
Barangay Council for the Protection of Children (BCPC) Orientation.pptx
Barangay Council for the Protection of Children (BCPC) Orientation.pptxBarangay Council for the Protection of Children (BCPC) Orientation.pptx
Barangay Council for the Protection of Children (BCPC) Orientation.pptx
 
4.16.24 21st Century Movements for Black Lives.pptx
4.16.24 21st Century Movements for Black Lives.pptx4.16.24 21st Century Movements for Black Lives.pptx
4.16.24 21st Century Movements for Black Lives.pptx
 
How to do quick user assign in kanban in Odoo 17 ERP
How to do quick user assign in kanban in Odoo 17 ERPHow to do quick user assign in kanban in Odoo 17 ERP
How to do quick user assign in kanban in Odoo 17 ERP
 
HỌC TỐT TIẾNG ANH 11 THEO CHƯƠNG TRÌNH GLOBAL SUCCESS ĐÁP ÁN CHI TIẾT - CẢ NĂ...
HỌC TỐT TIẾNG ANH 11 THEO CHƯƠNG TRÌNH GLOBAL SUCCESS ĐÁP ÁN CHI TIẾT - CẢ NĂ...HỌC TỐT TIẾNG ANH 11 THEO CHƯƠNG TRÌNH GLOBAL SUCCESS ĐÁP ÁN CHI TIẾT - CẢ NĂ...
HỌC TỐT TIẾNG ANH 11 THEO CHƯƠNG TRÌNH GLOBAL SUCCESS ĐÁP ÁN CHI TIẾT - CẢ NĂ...
 
Grade 9 Quarter 4 Dll Grade 9 Quarter 4 DLL.pdf
Grade 9 Quarter 4 Dll Grade 9 Quarter 4 DLL.pdfGrade 9 Quarter 4 Dll Grade 9 Quarter 4 DLL.pdf
Grade 9 Quarter 4 Dll Grade 9 Quarter 4 DLL.pdf
 
Field Attribute Index Feature in Odoo 17
Field Attribute Index Feature in Odoo 17Field Attribute Index Feature in Odoo 17
Field Attribute Index Feature in Odoo 17
 
Q4-PPT-Music9_Lesson-1-Romantic-Opera.pptx
Q4-PPT-Music9_Lesson-1-Romantic-Opera.pptxQ4-PPT-Music9_Lesson-1-Romantic-Opera.pptx
Q4-PPT-Music9_Lesson-1-Romantic-Opera.pptx
 
Activity 2-unit 2-update 2024. English translation
Activity 2-unit 2-update 2024. English translationActivity 2-unit 2-update 2024. English translation
Activity 2-unit 2-update 2024. English translation
 
Incoming and Outgoing Shipments in 3 STEPS Using Odoo 17
Incoming and Outgoing Shipments in 3 STEPS Using Odoo 17Incoming and Outgoing Shipments in 3 STEPS Using Odoo 17
Incoming and Outgoing Shipments in 3 STEPS Using Odoo 17
 
Visit to a blind student's school🧑‍🦯🧑‍🦯(community medicine)
Visit to a blind student's school🧑‍🦯🧑‍🦯(community medicine)Visit to a blind student's school🧑‍🦯🧑‍🦯(community medicine)
Visit to a blind student's school🧑‍🦯🧑‍🦯(community medicine)
 
How to Add Barcode on PDF Report in Odoo 17
How to Add Barcode on PDF Report in Odoo 17How to Add Barcode on PDF Report in Odoo 17
How to Add Barcode on PDF Report in Odoo 17
 
AUDIENCE THEORY -CULTIVATION THEORY - GERBNER.pptx
AUDIENCE THEORY -CULTIVATION THEORY -  GERBNER.pptxAUDIENCE THEORY -CULTIVATION THEORY -  GERBNER.pptx
AUDIENCE THEORY -CULTIVATION THEORY - GERBNER.pptx
 
Karra SKD Conference Presentation Revised.pptx
Karra SKD Conference Presentation Revised.pptxKarra SKD Conference Presentation Revised.pptx
Karra SKD Conference Presentation Revised.pptx
 
Concurrency Control in Database Management system
Concurrency Control in Database Management systemConcurrency Control in Database Management system
Concurrency Control in Database Management system
 
ROLES IN A STAGE PRODUCTION in arts.pptx
ROLES IN A STAGE PRODUCTION in arts.pptxROLES IN A STAGE PRODUCTION in arts.pptx
ROLES IN A STAGE PRODUCTION in arts.pptx
 
ANG SEKTOR NG agrikultura.pptx QUARTER 4
ANG SEKTOR NG agrikultura.pptx QUARTER 4ANG SEKTOR NG agrikultura.pptx QUARTER 4
ANG SEKTOR NG agrikultura.pptx QUARTER 4
 

perceptual mapping A technique used in marketing to depict how b.docx

  • 1. perceptual mapping A technique used in marketing to depict how brands are perceived relative to one another, when mapped in two or more dimensions. Also called ‘position mapping’. A list of brands is specified, e.g. say, ten brands of curry paste. Respondents are asked to say how similar they think these brands are to one another (A is similar to C, D is similar to E, etc.). It is respondents' perceptions of similarity that are captured — these might not accurately mirror objective similarities, e.g. people may think A is similar to C when, in fact, the two brands of curry paste have quite different ingredients. A statistical procedure is employed to obtain spatial positions of the brands in multidimensional space to reflect these perceptions. A common procedure is multidimensional scaling, for which there is off-the-shelf software, e.g. PREFMAP, INDSCAL. Output is depicted as a map. This conveys the relative position of the brands, but does not relate to any absolute measure of distance. The number of dimensions (two, three, etc.) depends on how many are needed to plot the data without incurring an intolerable level of stress. The dimensions themselves are derived without labels, and great care must be taken in labelling them. A formal way to label dimensions involves the use of attribute ratings. At the same time as similarity data are collected, the researcher asks respondents to rate (on a ratings scale) each brand for a number of attributes (taste, quality ingredients, price and so forth). Each attribute is assessed for how closely it corresponds with the dimensions (low-high price may be closest to dimension 1; thus, dimension 1 is labelled the price axis). Although formal, the selection of attributes is subjective. In marketing, a popular alternative to the use of similarity data is the use of preference data, i.e. data where an evaluation of one item dominates another. Data may be in the form of paired comparisons (is A preferred over C?) or rankings (A is most
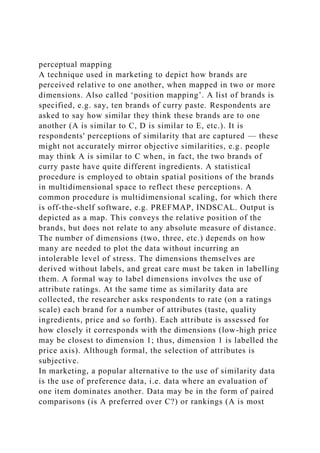
  • 2. preferred, followed by C, etc.). Similar procedures apply, but with preference data it is possible to investigate ‘ideal points’, e.g. by including a hypothetical brand X into the preference comparisons or ranking. The word ‘ideal’ here is misleading because X may be far from ideal. It is also possible to locate ideal combinations of attributes on the map — either for individual consumers or segments — and see which brands (if any) are close to the ideal. Various marketing implications might follow, including the possibility of designing a new product for an unmet market (seen as an empty quadrant on the perceptual map) or repositioning an existing product to be closer to the ideal point of a segment than competitors. This form of analysis is very beguiling but it can be very misleading, e.g. an empty quadrant may represent an unmet need or a phantom market, and a new brand may get closer to the ideal point of a segment but, in so doing, change the whole configuration of the map (including a relative shift in the ideal point). One of the most popular business games, MARKSTRAT, uses these facets of perceptual mapping to simulate the dynamic interplay of competing firms in established and new markets. The technique is applied in product and brand positioning studies. new product development; positioning; segment-target- position strategy. Informally, the ideas behind perceptual mapping are reflected in the thinking of many marketing managers, even though they may never make use of the formal techniques. Exhibit 4–14 “Product Space” Representing Consumers’ Perceptions for Different Brands of Bar Soap Each segment may have its own
  • 3. preferences The circles in Exhibit 4-14 show different sets (submarkets) of consumers clustered near their ideal soap preferences. Groups of respondents with a similar ideal product are circled to show apparent customer concentrations. In this graph, the size of the circles suggests the size of the segments for the different ideals. Ideal clusters 1 and 2 are the largest and are close to two popular brands—Dial and Lever 2000. It appears that customers in cluster 2 want more moisturizing than they see in Dial. However, exactly what this brand should do about this isn’t clear. Perhaps Dial should leave its physical product alone—but emphasize moisturizing more in its promotion to make a stronger appeal to those who want moisturizers. A marketing manager talking about this approach might simply refer to it as “positioning the brand as a good moisturizer.” Of course, whether the effort is successful depends on whether the whole marketing mix delivers on the promise of the positioning communication. Note that ideal cluster 7 is not near any of the present brands. This may suggest an opportunity for introducing a new product—a strong moisturizer with some deodorizers. A firm that chooses to follow this approach would be making a segmenting effort. Combining versus segmenting Positioning analysis may lead a firm to combining—rather than segmenting—if managers think they can make several general appeals to different parts of a “combined” market. For example, by varying its promotion, Coast might try to
  • 4. appeal to segments 8, 1, and 2 with one product. These segments are all quite similar (close together) in what they want in an ideal brand. On the other hand, there may be clearly defined submarkets—and some parts of the market may be “owned” by one product or brand. In this case, segmenting efforts may be practical—moving the firm’s own product into another segment of the general market area where competition is weaker. A positioning analysis helps managers understand how customers see their market. It is a visual aid to understanding a product-market. The first time such an analysis is done, managers may be shocked to see how much customers’ perceptions of a market differ from their own. For this reason alone, positioning analysis may be crucial. But a positioning analysis usually focuses on specific product features and brands that are closecompetitors in the product-market. Thus, it is a product-oriented approach. Important customer -related dimensions—including needs and attitudes— may be overlooked. Premature emphasis on product features is dangerous in other ways as well. As our bar soap example shows, starting with a product-oriented definition of a market and how bar soaps compete against other bar soaps can make a firm miss more basic shifts in markets. For example, bars have lost popularity to liquid soaps. Other products, like bath oils or body washes for use in the shower, are now part of the relevant competition also. Managers wouldn’t see these shifts if they looked only at alternative bar soap brands—the focus is just too narrow.
  • 5. It’s also important to realize that the way consumers look at a product isn’t just a matter of chance. Let’s return to our bar soap example. While many consumers do think about soap in terms of moisturizing and deodorizing, other needs shouldn’t be overlooked. For example, some consumers are especially concerned about wiping out germs. Marketers for Dial soap recognized this need and developed ads that positioned Dial as “the choice” for these target customers. This helped Dial win new customers, including those who switched from Lifebuoy—which was otherwise similar to Dial (see Exhibit 4-14). In fact, what happened to Lifebuoy highlights what happens if managers don’t update their marketing strategy as customer needs and competition change. Lifebuoy was the first deodorant soap on the market; it was a leading brand for over 100 years. But it gradually lost sales to competitors with stronger marketing mixes (clearer differentiation, better positioning, and superior customer value) until sales declined and Lever stopped selling it. Sometimes marketing managers use a positioning statement to provide focus for a marketing mix. A pos i tioning statement concisely identifies the firm’s desired target market, product type, primary benefit or point of differentiation, and the main reasons a buyer should believe the firm’s claims. The one or two benefits highlighted in the statement should be those most important to the target market—and unique to the brand. It’s important that everyone involved in planning the marketing
  • 6. strategy agree with the positioning statement because it helps narrow options and guide the selection of a marketing mix. Some firms use a template like the following to aid in preparation of a positioning stat e ment: For ( our target market ), ( our brand ) of all ( product type ) delivers ( key benefit or point of differenti a tion ) because ( our brand ) is ( reasons to believe ). A few years ago, marketing managers for Mountain Dew used this template to develop the following pos i tioning statement: For 16 to 24-year-old males, who embrace excitement, adventure, and fun, Mountain Dew of all ca r bonated soft drinks, delivers great taste that exhilarates like no other because Mountain Dew is energizing, thirst-quenching, and has a one-of-a-kind ci t rus flavor. The positioning statement provided Mountain Dew’s advertising agency with a dire c tion to follow that lead to a series of television commercials that reinforced this pos itioning. The statement guided decisions about packaging, point-of- purchase prom o tion, sponsorships, the look and feel of a website, and new flavors. The marketing strategy based on this positioning helped Mountain Dew gain market share with this target market. 17 As we emphasize throughout the text, you must understand potential needs and attitudes when planning marketing strategies. If customers treat different products as substitutes, then a firm has to position itself against those products too. Customers won’t always
  • 7. be conscious of all of the detailed ways that a firm’s marketing mix might be different, but careful positioning can help highlight a unifying theme or benefits that relate to the determining dimensions of the target market. Thus, it’s useful to think of positioning as part of the broader strategy planning process—because the purpose is to ensure that the whole marketing mix is positioned for competitive advantage. Positioning statement provides direction for marketing strategy perceptual mapping A technique used in marketing to depict how brands are perceived relative to one another, when mapped in two or more dimensions. Also called ‘position mapping’. A list of brands is specified, e.g. say, ten brands of curry paste. Respondents are asked to sa y how similar they think these brands are to one another (A is similar to C, D is similar to E, etc.). It is respondents' perceptions of similarity that are captured — these might not accurately mirror objective similarities, e.g. people may think A is sim ilar to C when, in fact, the two brands of curry paste have quite different ingredients. A statistical procedure is employed to obtain spatial positions of the brands in multidimensional space to reflect these perceptions. A common procedure is multidimens ional scaling, for which there is off -
  • 8. the - shelf software, e.g. PREFMAP, INDSCAL. Output is depicted as a map. This conveys the relative position of the brands, but does not relate to any absolute measure of distance. The number of dimensions (two, three, e tc.) depends on how many are needed to plot the data without incurring an intolerable level of stress. The dimensions themselves are derived without labels, and great care must be taken in labelling them. A formal way to label dimensions involves the use o f attribute ratings. At the same time as similarity data are collected, the researcher asks respondents to rate (on a ratings scale ) each brand for a number of attributes (taste, quality ingredients, price and so forth). Each attribute is assessed for how closely it corresponds with the dimensions (low - high price may be closest to dimension 1; thus, dimension 1 is labelled the price a xis). Although formal, the selection of attributes is subjective. In marketing, a popular alternative to the use of similarity data is the use of preference data, i.e. data where an evaluation of one item dominates another. Data may be in the form of paire d comparisons (is A preferred over C?) or rankings (A is most preferred, followed by C, etc.). Similar procedures apply, but with preference data it is possible to investigate ‘ideal points’, e.g. by including a hypothetical brand X into
  • 9. the preference com parisons or ranking. The word ‘ideal’ here is misleading because X may be far from ideal. It is also possible to locate ideal combinations of attributes on the map — either for individual consumers or segments — and see which brands (if any) are close to t he ideal. Various marketing implications might follow, including the possibility of designing a new product for an unmet market (seen as an empty quadrant on the perceptual map) or repositioning an existing product to be closer to the ideal point of a segm ent than competitors. This form of analysis is very beguiling but it can be very misleading, e.g. an empty quadrant may represent an unmet need or a phantom market, and a new brand may get closer to the ideal point of a segment but, in so doing, change the whole configuration of the map (including a relative shift in the ideal point). One of the most popular business games, MARKSTRAT, uses these facets of perceptual mapping to simulate the dynamic interplay of competing firms in established and new markets. The technique is applied in product and brand positioning studies. new product development ;
  • 10. positioning ; segment - target - position strategy . Informally, the ideas behind perceptual mapping are reflected in the thinking of many marketing managers, even though they may never make use of the formal techniques. perceptual mapping A technique used in marketing to depict how brands are perceived relative to one another, when mapped in two or more dimensions. Also called ‘position mapping’. A list of brands is specified, e.g. say, ten brands of curry paste. Respondents are asked to say how similar they think these brands are to one another (A is similar to C, D is similar to E, etc.). It is respondents' perceptions of similarity that are captured — these might not accurately mirror objective similarities, e.g. people may think A is similar to C when, in fact, the two brands of curry paste have quite different ingredients. A statistical procedure is employed to obtain spatial positions of the brands in multidimensional space to reflect these perceptions. A common procedure is multidimensional scaling, for which there is off-the-shelf software, e.g. PREFMAP, INDSCAL. Output is depicted as a map. This conveys the relative position of the brands, but does not relate to any absolute measure of distance. The number of dimensions (two, three, etc.) depends on how many are needed to plot the data without
  • 11. incurring an intolerable level of stress. The dimensions themselves are derived without labels, and great care must be taken in labelling them. A formal way to label dimensions involves the use of attribute ratings. At the same time as similarity data are collected, the researcher asks respondents to rate (on a ratings scale) each brand for a number of attributes (taste, quality ingredients, price and so forth). Each attribute is assessed for how closely it corresponds with the dimensions (low-high price may be closest to dimension 1; thus, dimension 1 is labelled the price axis). Although formal, the selection of attributes is subjective. In marketing, a popular alternative to the use of similarity data is the use of preference data, i.e. data where an evaluation of one item dominates another. Data may be in the form of paired comparisons (is A preferred over C?) or rankings (A is most preferred, followed by C, etc.). Similar procedures apply, but with preference data it is possible to investigate ‘ideal points’, e.g. by including a hypothetical brand X into the preference comparisons or ranking. The word ‘ideal’ here is misleading because X may be far from ideal. It is also possible to locate ideal combinations of attributes on the map — either for individual consumers or segments — and see which brands (if any) are close to the ideal. Various marketing implications might follow, including the possibility of designing a new product for an unmet market (seen as an empty quadrant on the perceptual map) or repositioning an existing product to be closer to the ideal point of a segment than competitors. This form of analysis is very beguiling but it can be very misleading, e.g. an empty quadrant may represent an unmet need or a phantom market, and a new brand may get closer to the ideal point of a segment but, in so doing, change
  • 12. the whole configuration of the map (including a relative shift in the ideal point). One of the most popular business games, MARKSTRAT, uses these facets of perceptual mapping to simulate the dynamic interplay of competing firms in established and new markets. The technique is applied in product and brand positioning studies. new product development; positioning; segment-target-position strategy. Informally, the ideas behind perceptual mapping are reflected in the thinking of many marketing managers, even though they may never make use of the formal techniques.