SlideShare a Scribd company logo
1 of 13
Download to read offline
Special Report TD Economics
www.td.com/economics
October 20, 2010
CANADIAN HOUSEHOLD DEBT
A CAUSE FOR CONCERN
HIGHLIGHTS
•	 Canadian personal indebtedness
has become excessive. Low in-
come families seem particularily
vulnerable
•	 Economic and financial funda-
mentals suggest that the personal
debt-to-income ratio should be in
the 138% to 140% range over the
coming  five years. The current
ratio is at 146%.
•	 A U.S.-style crisis is not in the
making, but Canadian personal
debt growth must slow relative to
its past rapid pace of increase.
•	 Various factors point to a modera-
tion of household borrowing, but
a sustained low rate environment
with short-term rates only return-
ing to 3.50% by 2013 may still
support personal liability growth
of 5% annually. With personal
income growth likely to advance
at  4% per annum, personal debt-
to-income could rise to 151% by
2013.
•	 This suggests that further pruden-
tial actions might be warranted,
but should not occur until the
current housing cooling has run
its course and the economy is on
a firmer footing.
The relentless rise in household debt in Canada, both in absolute terms and
relative to personal disposable income (PDI), is a growing cause for concern.
Since the mid-1980s, total household debt as a share of PDI in Canada has almost
tripled – from 50% to 146% – and a visible acceleration in the long-term trend of
debt accumulation has taken root since 2007. With debt-loads mounting in Canada
and U.S. personal debt in decline (reflecting deleveraging and home foreclosures)
over the past couple of years, there has been a rapid convergence in the Canadian
household debt-to-income ratio vis-à-vis that of the United States.
In this report, we provide answers to some of the most pressing questions
on the topic of Cana-
dian household debt.
In particular, is Canada
headed for a U.S.-style
household debt crisis?
And, is there an optimal
or sustainable level of
household debt? The
answer to the first ques-
tion is ‘no’. The Cana-
dian debt imbalance is
currently not as great
as that experienced in
the U.S. and does not
require a major dele-
veraging. However, the
answer to the second
question is that Canadian personal indebtedness has become excessive relative to
what economic models would predict as appropriate. In other words, growth in
personal debt must slow relative to income growth over the coming years or else
the risks of a future deleveraging will increase.
What demand factors account for the upward trend in household
indebtedness?
The long-term upward trend in personal debt cannot be pinned on just one or
two factors, although a significant portion can be tied to structural shifts in the
macroeconomic environment – particularly during the 1990s. The introduction
of inflation targeting by the Bank of Canada in the early 1990s set the stage for a
secular decline in interest rates that improved debt affordability. At the same time,
these macroeconomic trends created a heightened sense of financial security among
households. Low and stable inflation reduced the likelihood of future interest-rate
volatility, while relatively stable growth in the economy and job market lowered
the probability of layoffs and an interruption in household income – all of which
made households more comfortable carrying greater debt loads.
HOUSEHOLD INDEBTEDNESS - CANADA AND U.S.
CONVERGE
60
80
100
120
140
160
180
1990 1995 2000 2005 2010
Canada
U.S.
debt as a % of pdi
Source: Statistics Canada, Federal Reserve Board, Haver Analytics *Note: Both measures
are caculated in a way that makes them comparable. The Canadian measure totals 146%
when you include accounts payable.
Craig Alexander, SVP and Chief 	
Economist
416-982-8064
mailto:craig.alexander@td.com
Derek Burleton, Vice President & 	
Deputy Chief Economist (Canada)
416-982-2514
mailto:derek.burleton@td.com
Diana Petramala,
Economist (Canada)
416-982-6420
mailto:diana.petramala@td.com
Special Report
October 20, 2010
TD Economics
www.td.com/economics
2
Nowhere was the impact of lower borrowing costs and
greater household confidence more clearly observed than
in the housing market, where ownership rates increased
steadily over the past two decades. A self-perpetuating
cycle occurred. Strong increases in demand bid up hous-
ing prices, which together with equity market gains prior
to the 2008/2009 recession, raised net wealth. This positive
wealth effect encouraged households to increase their rate of
investment and consumption, further driving up borrowing
and debt levels.
Demographics also helped drive demand for credit.
Baby boomers (individuals born between 1946 and 1964)
shaped debt trends just as they shaped product markets.
They bought homes and then moved up the property ladder
over time, using real estate as a source of wealth creation.
Another key macroeconomic trend that boosted demand
for credit was increased labour market participation by
women. Experience shows that households with two income
earners tend to carry more debt per person relative to their
income. Having two incomes creates a sense of income
security, as the probability of losing both income streams is
much reduced. This can be a false sense of security if both
incomes are needed to service debt.
During the 2000s, the “echo” generation has been provid-
ing a boost to home purchases, helped by favourable housing
affordability created by low interest rates that allowed these
young workers to borrow sizeable amounts.
Demand for credit has received a significant boost from
a cultural shift from thrift towards consumerism. This has
been an international trend, in which consumers have a
greater desire to consume larger quantities of goods and
services than they have in the past – particularly discre-
tionary items. Households have also become impatient,
meaning that when they want something, they have become
more inclined to finance purchases through credit to enjoy
consumption sooner rather than later. This has altered the
lifepath of spending. The traditional lifepath model is that
individuals wish to smooth consumption over their lifetime.
They borrow when young, pay down debt and save for re-
tirement when more mature, and then run down savings and
assets when older. However, individuals are now taking on
debt earlier, and maintaining debt longer. For example, an
increasing number of retirees are carrying debt after leaving
the labour market.
As one might expect, carrying a higher debt burden
means that more Canadians are at risk of running into dif-
ficulty meeting their financial obligations in the event of
an unforeseen economic or financial shock. This would
normally act as a check on growth in demand for credit.
However, the social stigma associated with declaring
personal insolvency has declined. Indeed, whereas in the
1950s or 1960s individuals would find it difficult to admit
bankruptcy, today such an occurrence is generally met with
understanding and support – a desirable and positive devel-
opment but one that is still supportive to increased leverage
of personal balance sheets. Moreover, individuals who
go into bankruptcy are no longer credit market outcasts.
Seven years after declaring insolvency, individuals become
eligible for credit once again from most institutions, and in
the interim most are able to get access to credit, albeit at
likely punitive interest rates.
How important have supply side factors been in
driving credit?
As demand for credit rose in recent decades, a number
-15
-10
-5
0
5
10
15
20
25
1980 1989 1998 2007
Real household credit
(y/y%)
3-month t-bill yield (%)
Source: Statistics Canada, Bank of Canada, Haver Analytics
HOUSEHOLD	CREDIT	SHOWS	DELAYED	RESPONSE	TO	INFLATION	
TARGETING
Inflation target
introduced
%
CANADIAN	HOMEOWNERSHIP	RATES
56
58
60
62
64
66
68
70
1971 1976 1981 1986 1991 1996 2001 2006
% of occupied private dwellings owned
Source: Statistics Canada
Special Report
October 20, 2010
TD Economics
www.td.com/economics
3
of supply-side developments helped raise credit availabil-
ity to households. These supply-side developments have
included increased competition within the financial indus-
try, the growing use of securitization, product innovation,
deregulation in the banking sector and the relaxing of some
credit constraints, which particularly benefited first-time
home buyers.
A number of reforms to the Bank Act occurred in the
1980s and early 1990s that increased competition in the
Canadian financial sector. Domestic competition was
heightened, and while foreign banks have been operating
in Canada since the early 1980s, changes to the BankAct in
the late 1990s removed some restrictions on foreign banks.
Non-bank lenders also became more active in credit markets.
The impact on pricing was more limited than the impact on
the supply of credit as institutions fought over market share.
Furthermore, financial innovations like the automation of
credit approval, and widespread use of standardized credit
scoring helped to make the loan application process move
more quickly and efficiently. But even more importantly,
increased competition helped to spur significant financial
innovation that made credit more attractive. Credit cards
that provided benefits to card-holders for travel and the like
was one innovation of note in the 1980s that encouraged
individuals to carry larger monthly balances. The introduc-
tion of home equity lines of credit (HELOCs) was the most
significant innovation of the 1990s and 2000s. Prior to
HELOCs, the ability of households to borrow was largely
constrained by their current and future income. HELOCs
have allowed households to borrow more against the value
of their homes or extract equity from their home for con-
sumption or investment purposes, while simultaneously of-
fering more flexible repayment terms than with a traditional
mortgage. The result has been greater access to credit and
lower monthly payments in a low interest rate environment.
As shown in the accompanying chart, the popularity of
HELOCs has risen over the past 10 years.
Innovations in the ways financial institutions fund mort-
gages and other loans have also played a supportive role.
Securitization of mortgages and other loans lowered funding
costs for financial institutions, which in turn increased the
supply of credit.
Another contributor to rising household indebtedness
over the last 20 years has been adjustments to mortgage
insurance rules. Three major changes to mortgage insur-
ance rules helped to make mortgage credit more available
and attractive.
First, the required down payment was reduced. In the
early 1990s, a homebuyer required a 10% down payment to
qualify for mortgage insurance. Through a series of regula-
tion changes over the 1990s and early 2000s, the minimum
down payment was reduced to 5%. The down payment
was temporarily lowered to zero by the end of 2006, but
was then taken back up to the current requirement of 5%
in October 2008.
Second, the qualification requirement for mortgage in-
surance was eased inApril 2007. Ahomebuyer is currently
only required to purchase mortgage insurance if the down
payment is less than 20%; previously that threshold was 25%
Third, the maximum amortization was increased in steps
from 25 years at the start of 2006 to 40 years by the fall of
that year. As we discuss later, this has since been reduced
to 35 years in October 2008. The extension to 40 years
amortization provided a sizeable boost to affordability. For
CANADIAN HOUSEHOLD CREDIT
0
200
400
600
800
1,000
1,200
1,400
1,600
1971 1976 1981 1986 1991 1996 2001 2006
Economy-wide
Chartered Banks
Bil. C$
Source: Statistics Canada/Haver Analytics
Impact of securitization, non-bank
lenders and foreign lenders
CANADIAN	HOUSEHOLD	CREDIT	BY	TYPE	OF
CREDIT
0
200
400
600
800
1,000
1,200
1,400
1,600
2006 2007 2008 2009 2010
Other Credit HELOCs
Source: Bank of Canada, Equifax
Bil. C$
Special Report
October 20, 2010
TD Economics
www.td.com/economics
4
example, an individual with an income equal to the national
average in 2007 that purchased a home equal to the national
average at that time and opted to finance at the 5-year posted
rate could carry a mortgage $40,000 larger with a 40-year
amortization period rather than a 25-year one with the same
monthly payments.
The bottom line is that all of these changes boosted hous-
ing affordability and encouraged more rapid growth in real
estate associated debt.
Up to this point, we have itemized the various demand
and supply factors, but one should also acknowledge that
there is a significant interplay between the two. Typically,
this dynamic is pro-cyclical. During periods of robust
economic and housing activity, demand for credit rises and
financial institutions accommodate the growth by increasing
credit availability and innovating in order to boost supply
of credit. However, the last couple of years have been
atypical. Household debt accelerated relative to income
during the most recent recession, bucking the experience of
the past two recessions in the 1980s and 1990s when rising
unemployment led to slower personal debt accumulation.
In both of the last two economic recessions in Canada, a
tightening in monetary policy was a leading contributor to
the downturn. Leading up to this past downturn, interest
rates were not as high as they were heading into the 1980s
and 1990s recession, and as a result, monetary policy has
been far more accomodative this time around. As we will
argue later, this countercyclical behaviour may have helped
get the Canadian economy out of recession, but it has also
meant that the economic downturn failed to unwind the
period of excessive debt growth relative to income that took
place in the 2000s.
Is Canada alone in experiencing an upward trend in
the debt-to-income ratio?
With similar supply and demand dynamics evident
across the advanced economies, the upward trend in
household indebtedness over time has been an international
phenomenon. In countries that tend to be more conserva-
tive towards household borrowing and have lower home
ownership rates – like Germany, Italy, and France – the
rise in indebtedness has been more shallow and gradual.
Nonetheless, inflation targeting by the European Central
Bank and credit innovations that improved debt affordability
still boosted credit growth. In the historically Anglo-Saxon
countries of the U.S., U.K., Canada and Australia – which
tend to have a culture more tied to consumption and home
ownership – household debt growth has been the strongest.
The rise in indebtedness in the U.S. and U.K. was remark-
able and clearly excessive. These countries experienced a
large housing bubble that was subsequently followed by a
real estate bust in 2007 and 2008, which resulted in a sharp
decline in household debt-to-income ratios. Australia’s
economic performance over the last two years has been the
most like the Canadian experience, but nothing like that in
the U.S. and U.K.. The comparability of the Canadian and
Australian experience is not surprising, as both are small
open commodity-driven economies where domestic demand
remained strong and the housing market and labour market
recovered quickly after a short-lived contraction during
the 2009 recession. Nevertheless, monetary policy has not
been as accomodative ‘down under’, nor was there the same
degree of relaxation in mortgage rules inAustralia. Accord-
ingly, the rise in household indebtedness in Australia over
the last three years has been more subdued than in Canada.
INTERNATIONAL	PERSPECTIVE	ON	HOUSEHOLD	
INDEBTEDNESS
0
20
40
60
80
100
120
140
160
180
1993 1995 1997 1999 2001 2003 2005 2007 2009
Australia France
Germany Sweden
U.K.
debt as a % of pdi
Sources: ABS, BBK, ONS, INSEE. *Note: Methodology differences make
these meaures not comparable to Canada, but are still indicative of trend
EXISTING	HOME	AFFORDABILITY
20
25
30
35
40
45
90 92 94 96 98 00 02 04 06 08 10
40-year amortization
25 year amortization
Mortgage payments* as percentage of income
* For the average price home using a 75% LTV ratio, 5-year fixed rate.
Source: CREA, Statistics Canada, Bank of Canada
Special Report
October 20, 2010
TD Economics
www.td.com/economics
5
Is there a limit to how high the debt-to-income ratio
can rise?
There is no ‘constant’or ‘optimal’debt-to-income ratio.
As mentioned earlier, the demand for debt is influenced
by trends in personal finance and personal preference. For
example, if debt is being accumulated to purchase assets,
and asset prices are likely to rise at a considerable rate,
then borrowing to accumulate wealth makes perfect sense
and can lead to a higher debt-to-income ratio. Moreover,
financial innovation can lead to a structural rise in debt
relative to income. Imagine a situation where mortgages
could be amortized over 100 years. The resulting decline in
debt service costs would mean that households could carry
much higher debt relative to income. What truly matters is
whether the prevailing debt-to-income ratio makes sense
based on the current structure of financial services and the
prospects for personal finances.
The recent U.S. and U.K. experience shows what can
happen when the ratio does become excessive relative to
economic and financial fundamentals. Coincidently, debt-
to-PDI ratios in both countries peaked at close to 160% of
PDI – some 14 percentage points above Canada’s current
level.
Can a 160% threshold be used as an appropriate guide-
line for determining when a particular risky level has been
reached? The challenge with merely applying the 160%
threshold to Canada is that it fails to account for the fact that
debt ratios in the U.S. and U.K. likely overshot their sustain-
able levels. The issue is by how much, and that is difficult
to tell. Furthermore, the appropriate level of debt relative
to income is likely higher given the different debt structure
in these countries. For instance, in the U.S., households
can deduct mortgage interest payments from their income
taxes payable. This would have the effect of allowing U.S.
households to carry more debt relative to income than Ca-
nadian households.
Moreover, the debt-to-income ratio has its own inherent
limitations. Since households often use debt to accumulate
assets, which in turn can be drawn on in case of financial
stress, or used to smooth out their consumption and/or to
provide income during retirement, it becomes critical to
look at a broader array of household ratios to assess the
vulnerability of households to economic shocks. These in-
clude the debt-to-net worth ratio, the asset-to-liability ratio
and the share of homeowner’s equity within total assets.
Most importantly, the total debt-to-income ratio falls short
in providing a clear gauge on the ability of households to
meet their debt obligations. This is because the income
used is annual income, and Canadian households don’t pay
off all their debt in one year. So, affordability of debt as
measured by an estimated debt service ratio needs to be a
key part of the analysis.
What are these other indebtedness metrics saying?
Consistent with the debt-to-income ratio, all of the Ca-
nadian debt metrics seem to line up on the side of growing
vulnerability, but not a looming crisis.
First, one needs to consider the evolution of household
balance sheets. Over the 1980s and 1990s, the rise in the
household debt-to-income ratio was accompanied by sta-
bility in the debt-to-assets ratio and the debt-to-net worth
ratio. In the 2000s, however, there was a break in the trend
where accumulation of household debt was encouraged by
capital gains. Put another way, households saved less and
HOUSEHOLD	INDEBTEDNESS	GROWS	OVER	
TIME
60
70
80
90
100
110
120
130
140
150
160
1990 1995 2000 2005 2010
debt as a % of pdi
Source: Statistics Canada, Haver Analytics
HOUSEHOLD INDEBTEDNESS AND ASSET
ACCUMULATION
0
100
200
300
400
500
600
700
800
900
1990 1994 1998 2002 2006 2010
0
20
40
60
80
100
120
140
160
assets
indebtedness
debt as a % of pdiassets (book value) as a % of pdi
Source: Statistics Canada, Haver Analytics
Special Report
October 20, 2010
TD Economics
www.td.com/economics
6
relied too heavily on asset price gains to do the saving for
them, while at the same time they were comfortable adding
to their debt obligations. The trouble is that at least some of
the asset price gains are likely unsustainable, as equities are
struggling to regain the ground they lost during the recent
financial turmoil. Moreover, TD Economics believes that
national average home prices have risen roughly 10-15%
above the levels supported by economic fundamentals.
Since 2006, the rise in the debt-to-income ratio has been
associated with a large increase in the ratio of debt-to-assets
and debt-to-net worth for the first time on record. Over 2009,
the rise in these measures largely reflected a sharp decline in
asset values related to the short-lived correction in housing
and equity markets. However, even as asset values have
returned to pre-recession levels, these measures remain at
historically high levels. This is particularily concerning
given that we believe that the rebound in asset values may
be a bit overdone.
Estimates of the aggregate household debt service ratio
have also been flashing some warning lights. What is typi-
cally used to assess debt affordability is the ratio of interest
payments on debt as a share of PDI. This measure, which
does not include principal payments, is popular in large
part because it is computed and made readily available by
Statistics Canada. Interest costs also pose the biggest risk
to household finances, whereas principal payments are
generally stable.
Although interest costs absorb a relatively small share
of PDI, the fact that they are not at record lows given the
near record low level of interest rates is striking. In fact,
the last time the debt-service ratio was at its current value
of 7.2%, the overnight rate was at 4.25% rather than its
current level of 1.00%.
This perspective is somewhat backward looking, how-
ever, since interest rates will not remain at these emergency
levels over the medium-to-longer term. An important
exercise is to calculate what this ratio would rise to if the
overnight rate were at a more normal level, say 3.5%, given
a debt-to-income ratio of 146% and a moderate pace of PDI
growth of 3.0-4.0%. Under this scenario, the debt-interest
cost ratio would climb to 8.5% – a level not experienced
since mid 1990s when interest rates were at double digits.
But, once again, this does not provide the full story, since
households must shell out to meet both principal and interest
payments. In Canada, data on principal repayments is dif-
ficult to come by. The Bank of Canada uses data available
from the Ipsos Reid Canadian Financial Monitor (CFM),
which provides detailed financial data on households across
the country1
.
Similar to the interest-only debt service ratio, these
figures reveal that the affordability of debt remains within
a comfortable range but only because interest rates remain
extremely low. However, if short-term rates were to rise
towards 3.5% and 5-year rates were to rise towards 5%, the
combined principal and interest payments would reach 23%
of PDI – the highest level since 1999, which is the start of
the series. Under the more likely scenario in which the debt-
to-income ratio continues to grow – albeit at a much more
muted pace than experienced since 2007 – debt servicing
costs will reach 24% of PDI as interest rates return to more
normal levels. Put another way, if interest rates rise 3 per-
centage points, the debt-to-income ratio would have to fall
back to levels seen in 2006 (125%-130%) to have the same
debt service costs as today.
INTEREST	DEBT	SERVICE	RATIO	
-5.0
-1.0
3.0
7.0
11.0
15.0
1990 1993 1996 1999 2002 2005 2008 2011 2014
5.0
6.0
7.0
8.0
9.0
10.0
11.0
3-month t-bill
Interest debt service ratio
3-month tbill (%) DSR (%)
Souce: Statistics Canada, Haver Analytics, Forecast by TD Economics as of
October 2010
Forecast
CANADIAN HOUSEHOLD METRICS OF
INDEBTEDNESS
10
12
14
16
18
20
22
24
26
Q1-1990 Q1-1993 Q1-1996 Q1-1999 Q1-2002 Q1-2005 Q1-2008
Debt-to-assets
Debt-to-net worth
Ratio, %
Source: Statistics Canada/Haver Analytics
Special Report
October 20, 2010
TD Economics
www.td.com/economics
7
What share of the Canadian population is particularly
vulnerable?
Average statistics can conceal the real story. In this case,
the moderate increase in the aggregate debt affordability
numbers hides the true extent of Canadians that are in a
position of financial stress.
Researchers at the Bank of Canada (BoC) use the Ipsos
Reid data to estimate the number of households that would
become financially vulnerable given the current level of
indebtedness, and under various interest rate outcomes. The
standard the BoC applies to determine financial vulnerability
(or stress) is households whose debt-service ratio exceeds
40%. The BoC uses a 40% threshold to determine vulner-
ability, because households with debt service ratio above this
mark have a greater probability of defaulting on their loans.
The analysis was last published in early 2010, using
2009 data. The BoC found that just over 6% of households
were in a position of financial stress at that time. Under a
scenario where the overnight rate rises to 3.5%, debt contin-
ues to grow at its current rapid pace, and PDI growth runs
at a healthy 5% annualized growth, approximately 7.5% of
households would become financially vulnerable.
Since the BoC conducted its analysis, more up-to-date
figures from Ipsos Reid have been released for the first
half of 2010. We have used similar methodology to the
BoC’s to rerun the analysis. Based on the new figures, a
slightly higher 6.5% of households are currently financially
vulnerable (or have a debt-service ratio of 40% or above).
More striking, the share of those on the verge of becoming
vulnerable (those with a debt-service ratio of 30-40%) had
risen from 7.2% in 2009 to 9.3% - up almost two percent-
age points. Given the change in the distribution of debt,
we have estimated that as much as 10-11% of households
may become financially vulnerable if the overnight rate
rose to 3.5% under similar assumptions used by the Bank
of Canada2
. The ratios do not suggest that a major personal
financial crisis is brewing. For example, the vulnerability
ratio reached 15% before U.S. households became signifi-
cantly distressed. Furthermore, financial stress in the U.S.
was compounded by a massive spike in the unemployment
rate. But, the analysis does highlight that more Canadians
are vulnerable to higher interest rates that must ultimately
come when the economy is stronger.
What segment of the population is particularly at
risk?
Digging even deeper into the Ipsos Reid database, it be-
comes apparent that the concentration of those households
in financial stress are at the low end of the income spectrum.
While about three quarters of overall debt is still held by
middle-to-high income families, low-income families have
the highest debt-to-income ratio (180%), and the highest
debt-service ratio (25%). Households in the lowest income
bracket are also more vulnerable to rising interest rates and
would face debt service costs exceeding 30%, on average, if
interest rates were to normalize, thus pushing them close to
the financial stress threshold. These statistics are important
because low-income families are more susceptible to adverse
economic shocks (more likely to lose their jobs), and they
do not have a strong asset base that they can liquidate in
times of financial stress.
The Ipsos Reid data also shows that the older popula-
tion (65+ years) is holding more debt than they have in the
past, and those that should be preparing for retirement (ages
HOUSEHOLDS ARE HOLDING MORE DEBT
0
5
10
15
20
25
30
35
40
0-10% 10-20% 20-30% 30-40% greater than
40%
2005 2009 2010Q1
Debt Service Ratio (%)
% of debt-holding households with given debt-service ratio
Source: Ipsos Reid
TOTAL	HOUSEHOLD	DEBT-SERVICE	RATIO	
(for debt-holding households)
0
5
10
15
20
25
30
1999 2002 2005 2008 t=1
Source: Ipsos Reid, Forecast by TD Economics as of October 2010
Debt service costs as a % of PDI
Impact as interest rates normalize,
and debt-to-income remains constant
Special Report
October 20, 2010
TD Economics
www.td.com/economics
8
55-64 years) are carrying heavier debt burdens than in the
past. The data indicate that more Canadians are choosing to
stay in the labour force longer – perhaps due to higher debt
loads or lower financial security. However, interpreting the
data is difficult. An alternative perspective could be that
the higher debt load is the result of households choosing to
work longer simply because they want to, or are physically
able to. The causation is unclear, but the higher indebted-
ness of older Canadians is concerning.
Are we headed for a U.S.-style deleveraging?
In spite of growing vulnerability of a significant minor-
ity share of households, the level of risk associated with
household indebtedness appears significantly lower than
that in the United States. As we have already noted, the
U.S. debt ratio at its peak in 2007 was significantly higher
than in Canada today. In the U.S., bankruptcies and loan
delinquencies were also a larger concern than they are in
Canada. For instance, the share of mortgage in arrears in
the lead-up to the recession (i.e., those related to the level
of debt rather than unemployment) jumped to 1.5% in the
U.S. – a level three times higher than that currently recorded
in Canada.
The key explanation behind the differing household
credit conditions are well known by now. In the U.S., fi-
nancial institutions undertook much riskier lending practices
during the sub-prime boom. As a result, a much higher share
of U.S. households became over-extended. In 2007, 15%
of U.S. indebted households had a debt service ratio above
40% – twice the level of that in Canada. Even under the
scenario where household debt continued to grow signifi-
cantly faster than income over the next couple of years, the
share of Canadian households that would become financially
vulnerable would not reach the levels experienced south
of the border in 2007. As mentioned above, the ability of
households to deduct mortgage interest costs from taxes pay-
able would have the effect of allowing U.S. households to
carry more debt relative to their income than their Canadian
counterparts. However, that being said, research still shows
that households with a debt-service ratio of 40% and above
are more likely to become delinquent on loan payments.
Another differentiating factor is the stronger balance
sheets enjoyed by Canadians, on average. In the United
States, there was a more pronounced deterioration in other
measures of indebtedness – such as the debt-to-assets and
debt-to-net worth ratios – leading up to the crisis compared
to the recent experience in Canada. The average Canadian
has a significantly higher amount of equity built up in their
homes, relative to their U.S. counterparts, where many had
negative equity positions. In the U.S. (and U.K.) a large
MORTGAGE IN ARREARS
0
1
2
3
4
5
6
1990 1995 2000 2005 2010
Canada
U.S.
% of outstanding mortgages
Souce: CBA, Moody's
U.S.	HOUSEHOLDS	MORE	VULNERABLE	THAN	
CANADIAN HOUSEHOLDS
0
5
10
15
20
25
30
35
0-10% 10-20% 20-30% 30-40% greater than
40%
U.S. (2007)
Canada (2010 Q1)
Debt Service Ratio (%)
% of debt holders within given range of debt-service-ratio
Source: Ipsos Reid, Federal Reserve Board
DEBT	SERVICE	RATIO	BY	INCOME	GROUP
Excluding	credit	cards
0
5
10
15
20
25
30
35
<$50k $50k to <$80k $80k to
<$120k
>=$120k
Current (Q1 2010)
DSR with rates at 3.0%
DSR with rates back to 4.0%
debt payments as a share of income
Income level
Source: Ipsos Reid, Forecast by TD Economics as of October 2010
Special Report
October 20, 2010
TD Economics
www.td.com/economics
9
Implications for Personal Insolvencies
The growing financial stress among low income
Canadians and the likelihood of a relatively high un-
employment rate projected (7.5-8%) over the medium
term suggests that the rate of credit delinquencies and
bankruptcies will remain elevated at close to their cur-
rent level over the next few years. At the same time,
however, the share of debt held by households who
declare insolvency (or that write-off debt) is likely to
remain low at 0.6%. Ditto for mortgages in arrears,
at 0.5%.
There are risks to this outlook. Historically, the
number of bankruptcies have been tightly tied to la-
bour market conditions, but as of late they have been
much higher than would be suggested by the rise in the
unemployment rate. The number of bankruptcies per
capita during this recession was 50% higher than the
1990s recession – despite the stronger performance
of the domestic economy and labour markets this time
around. And, despite a stunning recovery in Canadian
employment, the level of bankruptcies and insolvencies
have remained elevated – likely a consequence of the
level of debt. The implication is that one needs to be
more cautious when looking at the unemployment rate
as the traditional driver of delinquencies, as greater
emphasis is likely required on the level of indebtedness.
share of households had taken advantage of a quicker ap-
preciation in home prices relative to that in Canada in order
to increase their borrowing further. At one point, 75% of
mortgage renewals in the U.S. were taking on larger out-
standing balances, as Americans were rapidly extracting
equity from their homes for consumption purposes. While
Canadians have also been extracting equity from their homes
for consumption, the trend has been far less pronounced and
the bulk of the debt accumulation has been largely associ-
ated with the purchase of a home – and in particular – first
time homebuyers jumping into the market.
What is the appropriate level of the Canadian
personal debt-income ratio?
Although estimating the appropriate level of the debt-
to-income ratio is not an exact science, we have developed
a model that appears to provide good predictive power.
Variables in the model include: assets as a per cent of PDI,
the unemployment rate, core inflation, housing affordability
(which would include changes in rules that increase amor-
tization), the 5-year government bond yield (a proxy for
the 5-year mortgage rate) and home prices. According to
this model, household indebtedness can sustainably grow
in direct relation with a rising asset base, improving afford-
ability and a lower jobless rate. The model suggests that
after running more or less in line with its equilibrium level
until 2007, the debt ratio has since exceeded it. Applying
the TD Economics base case economic forecasts for these
inputs over the next few years, a sustainable level of debt-
to-PDI is estimated in the 138-140% range over the next 5
years – some 6-8 percentage points below its current level.
APPROPRIATE	PATH	OF	CANADIAN	HOUSEHOLD
INDEBTEDNESS
0
20
40
60
80
100
120
140
160
1980 1984 1988 1992 1996 2000 2004 2008 2012
debt as a % of pdi
Actual	+	TD	
Economics
September	forecast	
Model	estimation	
of	optimal	debt-to-
income	ratio	
Source: Statistics Canada/Haver Analytics, est. and forecast by TD
Economics as of October 2010
FCST
What does this sustainable range imply about the
future path of borrowing?
Taken at face value, the current excess of household debt
relative to income implies that a considerable and protracted
adjustment is required in order to bring the ratio back to a
HOMEOWNER'S	EQUITY
35
45
55
65
75
1990 1992 1994 1996 1998 2000 2002 2004 2006 2008 2010
U.S.
Canada
%
Source: Statistics Canada, Federal Reserve Board, Haver Analytics
Start of U.S.
recession
Special Report
October 20, 2010
TD Economics
www.td.com/economics
10
an appropriate level. Consider that average annual growth
in household debt has run at 8% per year over the past de-
cade. In a world of moderate 4% annual average growth in
PDI, average growth in household credit would need to be
constrained to about 2% per year in order to return the debt
ratio back to 140% within three years. Average annual debt
growth of 3% would get you there in five years. These slight
rates of debt growth would be unprecedented in Canada in
a non-recessionary period, and they are unlikely to occur in
an abnormally low interest rate environment. However, we
do believe that debt growth might slow from the 8% aver-
age annual gain in the last decade to 5% per annum over
the coming five years.
While not an exhaustive list, there are a number of in-
fluences that will provide a natural brake to credit growth
over the next few years:
•	 Housing activity is likely to remain relatively subdued –
in recent years, first-time home buyers have accounted
for as much as half of purchases, up from their long-
term average of about one-third. With many rushing
to get ahead of higher rates, and the pool of first time
buyers largely exhausted in our view, housing activity
is unlikely to return back to its recent peak over the
next several years. The slowing in the housing market
will feed through to other types of big-ticket consumer
purchases and overall demand for credit.
•	 Capacity to borrow is likely to be more constrained –
the consequence of being above a sustainable level of
indebtedness is that the capacity to take on more debt
is constrained. First, with increased usage during the
recession, the available credit on home-equity lines
has fallen relative to pre-recession levels. Second, as
we have discussed, as interest rates head up gradually,
households will have to devote a greater share of their
income to paying their monthly debt obligations.
Higher interest rates will also diminish the numbers
of individuals qualifying for credit.
•	 Appreciation of asset values will be more moderate
– going forward, we expect that households will not
be able to leverage rapidly growing asset values to
the same extent as over the past decade. In view
of the widespread belief that economic growth will
be only gradual, the pace of corporate profit growth
in the coming years is likely only to support equity
returns of 6-8% over the long haul, almost half the rate
experienced over the last decade. Meanwhile, home
prices are expected to grow at their long-run average
of about 4% in the coming decade, which is also close
to half of its trend rate before the recession.
•	 Structural supply influences likely to provide less of a
boost . Some of the changes to the mortgage insurance
rules were reversed. The maximum amortization period
went from 40 years to 35 years, and the required down
payment went from 0% to 5% in October 2008. The
In early 2010, the Federal Government also hardened
mortgage insurance qualification rules. Banks are now
required to income test borrowers against the 5-year
posted mortgage rate for all mortgage vehicles of less
than 5-year term and the 5-year contracted rated on all
5-year mortgages, whereas banks had been using the
3-year posted mortgage rate in the past. These changes
have eroded a quarter of the improvement in housing
affordability that occurred in 2007 with the loosening
of the mortgage insurance rules. The minimum down
payment on non-owner occupied properties was also
increased to 20%. Finally, some of the kick to credit
growth provided by the decade-long shift to flexible
lines of credit may have run its course.
•	 Demographics might also temper credit growth, as
more baby boomers enter retirement. This would
be the typical conclusion from lifecycle modeling.
However, a case could be made that the effect might
be constrained by financial innovation. Given the
higher debt loads among individuals nearing, or in,
retirement – coupled with less retirement income and
a low personal savings rate – there might be greater
demand for financial vehicles that allow retirees to
withdraw equity from their homes. For instance,
HOUSEHOLD	ASSET	GROWTH
-6
-4
-2
0
2
4
6
8
10
12
14
2000 2002 2004 2006 2008 2010 2012
Forecast
year-over-year % change
Source: Statistics Canada, Haver Analytics, Forecast by TD Economics
as of October 2010
2000-2008 annual average
Special Report
October 20, 2010
TD Economics
www.td.com/economics
11
reverse mortgages may become more popular in the
future. Financial institutions are likely to create new
lending products to accommodate this demand, which
would act as a new source of credit. Clearly, if such a
trend took place, policy makers would need to consider
prudent regulatory guidelines. However, this innovation
is not likely in the next couple of years, but is plausible
over a longer time horizon.
If debt growth does slow to the 5% annual pace that TD
Economics anticipates over the next five years, not only
would it not fail to unwind the excess in personal indebted-
ness present at the moment, but would aggravate it. The base
case forecast is for real economic growth of roughly 2% per
year, supporting personal disposable income growth of 4%
annually. This mix of debt and income growth would see
the personal debt-to-income ratio climb to 151% by 2013
– roughly 11 to 13 percentage points above our estimation
of the sustainable level.
In our forecast, the moderate economic growth and sus-
tained low inflation environment means that interest rates
rise slowly, with the overnight rate only returning to 3.50%
in 2013 and holding at that level for some time. So even
though Canadians facing debt service charges in excess of
30% will face a challenging period ahead and debt will be
increasingly excessive relative to income, debt will remain
manageable for the majority of Canadian households.
Incidentally, in the late 1970s and early 1980s, the
household debt-to-income ratio remained above its sustain-
able level for about five years. This period of unsustainable
borrowing was followed by a drop in the debt-to-income
ratio, which remained below its long-run trend value for
a subsequent three years. The catalyst for the adjustment
was a deep recession and a large spike in the unemploy-
ment rate. The challenge this time around is that, short of
a double-dip recession that we don’t expect, the trigger to
scale back household borrowing by more than in the TD
Economics base case forecast must be higher interest rates
than currently projected or prudential actions.
What are the key risks that might lead to a harder
landing?
Due to our expectation of continued low interest rates,
our base case outlook pushes the adjustment period out to
the second half of the decade.
In the near term, we are concerned about two negative
risks in particular: (i) a negative shock to income growth or
(ii) a renewed wave of borrowing that could lead to a more
painful consumer finances adjustment down the road. The
odds of either event happening is material, but not high
enough to be the most likely scenario. We would put the
odds of either outcome at perhaps 1-in-3.
In terms of the first risk, a major disruption to household
income resulting from a double-dip U.S. recession or an un-
anticipated financial shock that would impact the Canadian
economy and impact household finances. In contrast to the
2008-09 global recession, the ability of Canadian consumers
and governments to spend their way through the downturn
would be much more constrained, leading to a material
recession and a sharp increase in the unemployment rate
to above 10%. Since many households do not have much
financial wiggle room, any significant disruption in income
could cascade into larger delinquencies and a deleveraging
by households. Under this scenario, we project that the
appropriate debt-to-income ratio would fall to 127-128%
by 2013 (see chart) and would require a greater degree of
HOUSEHOLD	DEBT	SERVICE	RATIO	UNDER	
VARIOUS	ECONOMIC	SCENARIOS
0
5
10
15
20
25
30
1999 2001 2003 2005 2007 2009 2011 2013
Base case
Double-dip recession
Indebtedness continues current trend
debt payments as a % of income
Source: Ipsos Reid, Forecast by TD Economics as of October 2010
fcst
0
20
40
60
80
100
120
140
160
180
200
1980 1985 1990 1995 2000 2005 2010
TD Economics September 2010 Forecast
Double-dip Scenario Sustainable Level
Base Case Sustainable Level
Current Trend Continues
Source: Statistics Canada/Haver Analytics, est. and forecast by TD
Economics as of October 2010
FCST
debt as a % of pdi
APPROPRIATE	LEVEL	OF	HOUSEHOLD	INDEBTEDNESS
UNDER	VARIOUS	ECONOMIC	SCENARIOS
Special Report
October 20, 2010
TD Economics
www.td.com/economics
12
adjustment in consumer finances down the road.
Alternatively, there is an upside risk to debt growth in
the near term. With interest rates at abnormally low lev-
els, households could resume their borrowing binge in the
coming quarters following a short breather. In particular,
medium- and long-term bond yields have fallen to histori-
cal lows over the first six months of this year, which could
encourage an acceleration in the housing market. If this
outcome were to play out, households would wind up in a
more dire debt position. Under this case, the debt ratio could
rise to 160% by 2012, which would send a strong warning
signal that a material future household deleveraging might
be required.
One final alternative to our base case forecast is the most
desirable outcome, where the Canadian economy performs
much better than anticipated, income growth surprises on the
upside and this allows the debt-to-income ratio to moderate.
This would be ideal, but can’t be counted on.
Bottom line
To sum up, at 146% of average after-tax personal income,
Canadian household debt has become excessive. Looking
ahead, there are a number of influences that are likely to
restrain growth in credit to well below its recent rate – a
simmering down in the still-overheated housing market
chief among them. But in a sustained low interest rate en-
vironment, there are limits to how much borrowing is likely
to slow. Under our base case forecast, the overall debt-to-
income ratio is likely to rise even higher over the next five
years – to 151% – even with the anticipated moderation in
credit growth. In contrast, TD Economics estimates that
the appropriate level of personal debt-to-income ratio is in
the order of 138-140%.
At some point, monetary policy will have to be rebal-
anced and interest rates will have to move back up to more
neutral levels. TD Economics expects the overnight rate to
rise to 3.50% in 2013. This will create financial stress on
some Canadian households, but not the majority. A U.S.-
style household debt crisis is not in the making.
Nevertheless, policy makers and lenders should be aware
that personal indebtedness is becoming a more pressing
problem, and low-income Canadians are particularly vul-
nerable to future interest rate increases. This suggests that
prudential actions might be warranted to temper the rate
of debt growth in the future. Having said that, the govern-
ment needs to proceed with caution on the regulatory front.
Implementing tough new measures at a time when the
economy is fragile could generate a hard landing in real
estate and prove counterproductive. It would be better to
develop a strong understanding of what has been driving
the rise in personal indebtedness and the distribution of
that debt while weighing the available policy options, but
wait until the extent of the housing cycle is known and the
economy is on firmer ground before instituting any tighter
regulations. This approach would be prudent. It takes time
for policies to be developed and implemented. So, having
a understanding of how to respond in the future to rising
indebtedness would be sensible, just in case Canadian
households fail to cool their rate of borrowing in order to
take advantage of historically attractive interest rates. To
be clear, the Canadian economy is best served by monetary
policy that targets overall inflation and that might call for
low interest rates for an extended period of time. Monetary
policy is not capable of targeting personal credit growth in
isolation, but regulatory changes can do so.
Special Report
October 20, 2010
TD Economics
www.td.com/economics
13
This report is provided by TD Economics for customers of TD Bank Financial Group. It is for information purposes only and may not be
appropriate for other purposes. The report does not provide material information about the business and affairs of TD Bank Financial
Group and the members of TD Economics are not spokespersons for TD Bank Financial Group with respect to its business and affairs.
The information contained in this report has been drawn from sources believed to be reliable, but is not guaranteed to be accurate or
complete. The report contains economic analysis and views, including about future economic and financial markets performance. These
are based on certain assumptions and other factors, and are subject to inherent risks and uncertainties. The actual outcome may be
materially different. The Toronto-Dominion Bank and its affiliates and related entities that comprise TD Bank Financial Group are not liable
for any errors or omissions in the information, analysis or views contained in this report, or for any loss or damage suffered.
Endnotes and References
1. The Ipsos Reid data are not widely available, and thus, are not frequently cited. Note, we use the Ipsos Reid data to look at
households who currently hold debt. The results from the CFM are not comparable to the Statistics Canada interest only debt-
service ratio, because that estimate looks at all households – those who hold and do not hold debt. According to the CFM, 30% of
Canadian households are debt-free. Despite the methodological difference, the Ipsos Reid data tell the same story.
2. Using Ipsos Reid’s CFM data at less than at an annual frequency may lead to biases in the results due to small sample issues,
as the sample size in a quarter is roughly a quarter the size of the annual sample. However, quarterly data provides a good leading
indicator of the direction of the data.
3. Faruqui, Umar, “Indebtedness and the Household Financial Health: An Examination of the Canadian Debt Service Ratio
Distribution”, Bank of Canada working paper, December 2008. http://www.bankofcanada.ca/en/res/wp/2008/wp08-46.html
4. Djoudad, “The Bank of Canada’s Analytic Framework for Assessing the Vulnerability of the Household Sector”, Bank of Canada
Financial System Review, June 2010 http://www.bankofcanada.ca/en/fsr/2010/index_0610.html
5. Bank of Canada Financial System Review, Jun 2010, http://www.bankofcanada.ca/en/fsr/index.html

More Related Content

What's hot

01.13.10, FP, Dave RileyDP_Layout 1
01.13.10, FP, Dave RileyDP_Layout 101.13.10, FP, Dave RileyDP_Layout 1
01.13.10, FP, Dave RileyDP_Layout 1Brittanny Havard
 
The brookings institution webinar covid 19 and the economy
The brookings institution webinar covid 19 and the economyThe brookings institution webinar covid 19 and the economy
The brookings institution webinar covid 19 and the economyTatianaApostolovich
 
Serena Williams ( PDF)
Serena Williams ( PDF) Serena Williams ( PDF)
Serena Williams ( PDF) Fatfat Shiying
 
Consumerology 24: Economic Update 2015
Consumerology 24: Economic Update 2015Consumerology 24: Economic Update 2015
Consumerology 24: Economic Update 2015The Gandalf Group
 
American crises in 2007 hard copy
American crises in 2007 hard copyAmerican crises in 2007 hard copy
American crises in 2007 hard copyDharmik
 
This Month in Real Estate June 2009 Canada Market Powerpoint
This Month in Real Estate June 2009 Canada Market PowerpointThis Month in Real Estate June 2009 Canada Market Powerpoint
This Month in Real Estate June 2009 Canada Market PowerpointKeller Williams Careers
 
10a Hurlston Credit And Debt
10a  Hurlston  Credit And  Debt10a  Hurlston  Credit And  Debt
10a Hurlston Credit And DebtGordon Renouf
 
Financial crisis of 2008
Financial crisis of 2008Financial crisis of 2008
Financial crisis of 2008Ulfan Aliyev
 
Ep. #19: October 2019 - Da Real Estate Braddahs LIVE​
Ep. #19: October 2019 - Da Real Estate Braddahs LIVE​Ep. #19: October 2019 - Da Real Estate Braddahs LIVE​
Ep. #19: October 2019 - Da Real Estate Braddahs LIVE​Lane Kawaoka, PE
 
HPS The Path Forward - Current Economic Challenges
HPS The Path Forward - Current Economic ChallengesHPS The Path Forward - Current Economic Challenges
HPS The Path Forward - Current Economic ChallengesHPSInsight
 
The Shocking Truth About Canadian Debt
The Shocking Truth About Canadian DebtThe Shocking Truth About Canadian Debt
The Shocking Truth About Canadian DebtiMark International
 
STATEN DIE ECONOMIE ZOUDEN LATEN VALLEN, ASSOCIEERT MICRON GEOPENBAARDE
STATEN DIE ECONOMIE ZOUDEN LATEN VALLEN, ASSOCIEERT MICRON GEOPENBAARDESTATEN DIE ECONOMIE ZOUDEN LATEN VALLEN, ASSOCIEERT MICRON GEOPENBAARDE
STATEN DIE ECONOMIE ZOUDEN LATEN VALLEN, ASSOCIEERT MICRON GEOPENBAARDEwelford uniacke
 
Why A State Bank?
Why A State Bank?Why A State Bank?
Why A State Bank?Tom Tresser
 

What's hot (18)

01.13.10, FP, Dave RileyDP_Layout 1
01.13.10, FP, Dave RileyDP_Layout 101.13.10, FP, Dave RileyDP_Layout 1
01.13.10, FP, Dave RileyDP_Layout 1
 
The Big Short Part 2
The Big Short Part 2The Big Short Part 2
The Big Short Part 2
 
The brookings institution webinar covid 19 and the economy
The brookings institution webinar covid 19 and the economyThe brookings institution webinar covid 19 and the economy
The brookings institution webinar covid 19 and the economy
 
Global Debt Crisis Imminent?
Global Debt Crisis Imminent? Global Debt Crisis Imminent?
Global Debt Crisis Imminent?
 
Time & Money
Time & MoneyTime & Money
Time & Money
 
Serena Williams ( PDF)
Serena Williams ( PDF) Serena Williams ( PDF)
Serena Williams ( PDF)
 
Consumerology 24: Economic Update 2015
Consumerology 24: Economic Update 2015Consumerology 24: Economic Update 2015
Consumerology 24: Economic Update 2015
 
American crises in 2007 hard copy
American crises in 2007 hard copyAmerican crises in 2007 hard copy
American crises in 2007 hard copy
 
This Month in Real Estate June 2009 Canada Market Powerpoint
This Month in Real Estate June 2009 Canada Market PowerpointThis Month in Real Estate June 2009 Canada Market Powerpoint
This Month in Real Estate June 2009 Canada Market Powerpoint
 
The house of cards
The house of cardsThe house of cards
The house of cards
 
10a Hurlston Credit And Debt
10a  Hurlston  Credit And  Debt10a  Hurlston  Credit And  Debt
10a Hurlston Credit And Debt
 
Financial crisis of 2008
Financial crisis of 2008Financial crisis of 2008
Financial crisis of 2008
 
Ep. #19: October 2019 - Da Real Estate Braddahs LIVE​
Ep. #19: October 2019 - Da Real Estate Braddahs LIVE​Ep. #19: October 2019 - Da Real Estate Braddahs LIVE​
Ep. #19: October 2019 - Da Real Estate Braddahs LIVE​
 
HPS The Path Forward - Current Economic Challenges
HPS The Path Forward - Current Economic ChallengesHPS The Path Forward - Current Economic Challenges
HPS The Path Forward - Current Economic Challenges
 
The Shocking Truth About Canadian Debt
The Shocking Truth About Canadian DebtThe Shocking Truth About Canadian Debt
The Shocking Truth About Canadian Debt
 
STATEN DIE ECONOMIE ZOUDEN LATEN VALLEN, ASSOCIEERT MICRON GEOPENBAARDE
STATEN DIE ECONOMIE ZOUDEN LATEN VALLEN, ASSOCIEERT MICRON GEOPENBAARDESTATEN DIE ECONOMIE ZOUDEN LATEN VALLEN, ASSOCIEERT MICRON GEOPENBAARDE
STATEN DIE ECONOMIE ZOUDEN LATEN VALLEN, ASSOCIEERT MICRON GEOPENBAARDE
 
Press Review Us Economic Crisis July 3rd 2008
Press Review Us Economic Crisis July 3rd 2008Press Review Us Economic Crisis July 3rd 2008
Press Review Us Economic Crisis July 3rd 2008
 
Why A State Bank?
Why A State Bank?Why A State Bank?
Why A State Bank?
 

Viewers also liked

Anti Aging Presentation
Anti Aging PresentationAnti Aging Presentation
Anti Aging PresentationYoussef Douna
 
Canadian Financial Future1
Canadian Financial Future1Canadian Financial Future1
Canadian Financial Future1hbains758hhc
 
Katalog Udvalgte TuristProdukter Feb2010
Katalog Udvalgte TuristProdukter Feb2010Katalog Udvalgte TuristProdukter Feb2010
Katalog Udvalgte TuristProdukter Feb2010guestbb057c6
 
Enhencement Of Students Learning With Podcasts
Enhencement Of Students Learning With PodcastsEnhencement Of Students Learning With Podcasts
Enhencement Of Students Learning With PodcastsLoonmeili
 
Happy Valentines Day
Happy Valentines DayHappy Valentines Day
Happy Valentines Daychannah85
 
Biomedical PowerPoint Toolkits for Presentations
Biomedical PowerPoint Toolkits for PresentationsBiomedical PowerPoint Toolkits for Presentations
Biomedical PowerPoint Toolkits for Presentationsguest0e509a7
 

Viewers also liked (10)

30 Years
30 Years30 Years
30 Years
 
Motivation
MotivationMotivation
Motivation
 
Anti Aging Presentation
Anti Aging PresentationAnti Aging Presentation
Anti Aging Presentation
 
Canadian Financial Future1
Canadian Financial Future1Canadian Financial Future1
Canadian Financial Future1
 
Katalog Udvalgte TuristProdukter Feb2010
Katalog Udvalgte TuristProdukter Feb2010Katalog Udvalgte TuristProdukter Feb2010
Katalog Udvalgte TuristProdukter Feb2010
 
Enhencement Of Students Learning With Podcasts
Enhencement Of Students Learning With PodcastsEnhencement Of Students Learning With Podcasts
Enhencement Of Students Learning With Podcasts
 
Happy Valentines Day
Happy Valentines DayHappy Valentines Day
Happy Valentines Day
 
Boyd0306 2
Boyd0306 2Boyd0306 2
Boyd0306 2
 
Biomedical PowerPoint Toolkits for Presentations
Biomedical PowerPoint Toolkits for PresentationsBiomedical PowerPoint Toolkits for Presentations
Biomedical PowerPoint Toolkits for Presentations
 
415 417%20(woltz)
415 417%20(woltz)415 417%20(woltz)
415 417%20(woltz)
 

Similar to Td Household Debt Report

FlexWage White Paper_Barth and Helm_November_28_2016
FlexWage White Paper_Barth and Helm_November_28_2016FlexWage White Paper_Barth and Helm_November_28_2016
FlexWage White Paper_Barth and Helm_November_28_2016Lauren Rich Granger
 
An Empirical Study to Investigate the Reasons for the Increase in the Househo...
An Empirical Study to Investigate the Reasons for the Increase in the Househo...An Empirical Study to Investigate the Reasons for the Increase in the Househo...
An Empirical Study to Investigate the Reasons for the Increase in the Househo...Ehsan Dehghanizadeh
 
Debt issues for Canada and the World - risk and market analysis
Debt issues for Canada and the World - risk and market analysisDebt issues for Canada and the World - risk and market analysis
Debt issues for Canada and the World - risk and market analysispaul young cpa, cga
 
The Next World War
The Next World WarThe Next World War
The Next World Warhumaapkeliye
 
16 Budget Myths for the 2016 Campaign
16 Budget Myths for the 2016 Campaign16 Budget Myths for the 2016 Campaign
16 Budget Myths for the 2016 CampaignFix the Debt Campaign
 
Q&A: Everything You Need to know About the National Debt
Q&A: Everything You Need to know About the National DebtQ&A: Everything You Need to know About the National Debt
Q&A: Everything You Need to know About the National DebtFix the Debt Campaign
 
National Debt and How to Deal With It
National Debt and How to Deal With ItNational Debt and How to Deal With It
National Debt and How to Deal With ItLuke Rzepiennik
 
Q&A: Everything You Need to know About the National Debt
Q&A: Everything You Need to know About the National DebtQ&A: Everything You Need to know About the National Debt
Q&A: Everything You Need to know About the National DebtFix the Debt Campaign
 
US &amp; Canada Financial Crisis
US &amp; Canada Financial CrisisUS &amp; Canada Financial Crisis
US &amp; Canada Financial Crisisdennisjpitocco
 
The Development of the Reverse Mortgage Market
The Development of the Reverse Mortgage MarketThe Development of the Reverse Mortgage Market
The Development of the Reverse Mortgage MarketTom Roughan
 
STATEN DIE ECONOMIE ZOUDEN LATEN VALLEN, ASSOCIEERT MICRON GEOPENBAARDE
STATEN DIE ECONOMIE ZOUDEN LATEN VALLEN, ASSOCIEERT MICRON GEOPENBAARDESTATEN DIE ECONOMIE ZOUDEN LATEN VALLEN, ASSOCIEERT MICRON GEOPENBAARDE
STATEN DIE ECONOMIE ZOUDEN LATEN VALLEN, ASSOCIEERT MICRON GEOPENBAARDEkevinmounts
 
Debt Threat: The National Debt and You
Debt Threat: The National Debt and You Debt Threat: The National Debt and You
Debt Threat: The National Debt and You Fix the Debt Campaign
 
PPT on 2008. US SUB PRIME CRISIS-2.pptx
PPT on 2008.  US SUB PRIME CRISIS-2.pptxPPT on 2008.  US SUB PRIME CRISIS-2.pptx
PPT on 2008. US SUB PRIME CRISIS-2.pptxkthegreatks
 

Similar to Td Household Debt Report (20)

Debt issues: Crisis or Not?
Debt issues:   Crisis or Not? Debt issues:   Crisis or Not?
Debt issues: Crisis or Not?
 
FlexWage White Paper_Barth and Helm_November_28_2016
FlexWage White Paper_Barth and Helm_November_28_2016FlexWage White Paper_Barth and Helm_November_28_2016
FlexWage White Paper_Barth and Helm_November_28_2016
 
An Empirical Study to Investigate the Reasons for the Increase in the Househo...
An Empirical Study to Investigate the Reasons for the Increase in the Househo...An Empirical Study to Investigate the Reasons for the Increase in the Househo...
An Empirical Study to Investigate the Reasons for the Increase in the Househo...
 
Debt issues for Canada and the World - risk and market analysis
Debt issues for Canada and the World - risk and market analysisDebt issues for Canada and the World - risk and market analysis
Debt issues for Canada and the World - risk and market analysis
 
The Next World War
The Next World WarThe Next World War
The Next World War
 
Fiscal FactChecker: 16 Budget Myths to Watch Out for in the 2016 Campaign
Fiscal FactChecker: 16 Budget Myths to Watch Out for in the 2016 CampaignFiscal FactChecker: 16 Budget Myths to Watch Out for in the 2016 Campaign
Fiscal FactChecker: 16 Budget Myths to Watch Out for in the 2016 Campaign
 
16 Budget Myths for the 2016 Campaign
16 Budget Myths for the 2016 Campaign16 Budget Myths for the 2016 Campaign
16 Budget Myths for the 2016 Campaign
 
Qa what is debt final
Qa what is debt finalQa what is debt final
Qa what is debt final
 
Q&A: Everything You Need to know About the National Debt
Q&A: Everything You Need to know About the National DebtQ&A: Everything You Need to know About the National Debt
Q&A: Everything You Need to know About the National Debt
 
National Debt and How to Deal With It
National Debt and How to Deal With ItNational Debt and How to Deal With It
National Debt and How to Deal With It
 
Q&A: Everything You Need to know About the National Debt
Q&A: Everything You Need to know About the National DebtQ&A: Everything You Need to know About the National Debt
Q&A: Everything You Need to know About the National Debt
 
US &amp; Canada Financial Crisis
US &amp; Canada Financial CrisisUS &amp; Canada Financial Crisis
US &amp; Canada Financial Crisis
 
PACE - BBVA
PACE - BBVAPACE - BBVA
PACE - BBVA
 
20221210_RBC and Recession.pdf
20221210_RBC and Recession.pdf20221210_RBC and Recession.pdf
20221210_RBC and Recession.pdf
 
2008 Market Outlook
2008 Market Outlook2008 Market Outlook
2008 Market Outlook
 
The Development of the Reverse Mortgage Market
The Development of the Reverse Mortgage MarketThe Development of the Reverse Mortgage Market
The Development of the Reverse Mortgage Market
 
STATEN DIE ECONOMIE ZOUDEN LATEN VALLEN, ASSOCIEERT MICRON GEOPENBAARDE
STATEN DIE ECONOMIE ZOUDEN LATEN VALLEN, ASSOCIEERT MICRON GEOPENBAARDESTATEN DIE ECONOMIE ZOUDEN LATEN VALLEN, ASSOCIEERT MICRON GEOPENBAARDE
STATEN DIE ECONOMIE ZOUDEN LATEN VALLEN, ASSOCIEERT MICRON GEOPENBAARDE
 
Return On Investment - Winter 2017
Return On Investment - Winter 2017Return On Investment - Winter 2017
Return On Investment - Winter 2017
 
Debt Threat: The National Debt and You
Debt Threat: The National Debt and You Debt Threat: The National Debt and You
Debt Threat: The National Debt and You
 
PPT on 2008. US SUB PRIME CRISIS-2.pptx
PPT on 2008.  US SUB PRIME CRISIS-2.pptxPPT on 2008.  US SUB PRIME CRISIS-2.pptx
PPT on 2008. US SUB PRIME CRISIS-2.pptx
 

Td Household Debt Report

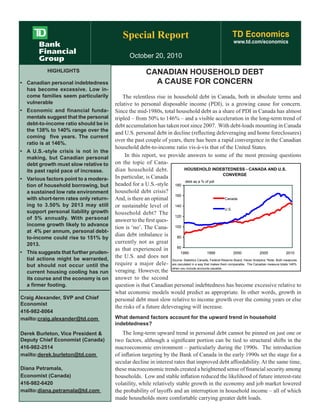
  • 1. Special Report TD Economics www.td.com/economics October 20, 2010 CANADIAN HOUSEHOLD DEBT A CAUSE FOR CONCERN HIGHLIGHTS • Canadian personal indebtedness has become excessive. Low in- come families seem particularily vulnerable • Economic and financial funda- mentals suggest that the personal debt-to-income ratio should be in the 138% to 140% range over the coming five years. The current ratio is at 146%. • A U.S.-style crisis is not in the making, but Canadian personal debt growth must slow relative to its past rapid pace of increase. • Various factors point to a modera- tion of household borrowing, but a sustained low rate environment with short-term rates only return- ing to 3.50% by 2013 may still support personal liability growth of 5% annually. With personal income growth likely to advance at 4% per annum, personal debt- to-income could rise to 151% by 2013. • This suggests that further pruden- tial actions might be warranted, but should not occur until the current housing cooling has run its course and the economy is on a firmer footing. The relentless rise in household debt in Canada, both in absolute terms and relative to personal disposable income (PDI), is a growing cause for concern. Since the mid-1980s, total household debt as a share of PDI in Canada has almost tripled – from 50% to 146% – and a visible acceleration in the long-term trend of debt accumulation has taken root since 2007. With debt-loads mounting in Canada and U.S. personal debt in decline (reflecting deleveraging and home foreclosures) over the past couple of years, there has been a rapid convergence in the Canadian household debt-to-income ratio vis-à-vis that of the United States. In this report, we provide answers to some of the most pressing questions on the topic of Cana- dian household debt. In particular, is Canada headed for a U.S.-style household debt crisis? And, is there an optimal or sustainable level of household debt? The answer to the first ques- tion is ‘no’. The Cana- dian debt imbalance is currently not as great as that experienced in the U.S. and does not require a major dele- veraging. However, the answer to the second question is that Canadian personal indebtedness has become excessive relative to what economic models would predict as appropriate. In other words, growth in personal debt must slow relative to income growth over the coming years or else the risks of a future deleveraging will increase. What demand factors account for the upward trend in household indebtedness? The long-term upward trend in personal debt cannot be pinned on just one or two factors, although a significant portion can be tied to structural shifts in the macroeconomic environment – particularly during the 1990s. The introduction of inflation targeting by the Bank of Canada in the early 1990s set the stage for a secular decline in interest rates that improved debt affordability. At the same time, these macroeconomic trends created a heightened sense of financial security among households. Low and stable inflation reduced the likelihood of future interest-rate volatility, while relatively stable growth in the economy and job market lowered the probability of layoffs and an interruption in household income – all of which made households more comfortable carrying greater debt loads. HOUSEHOLD INDEBTEDNESS - CANADA AND U.S. CONVERGE 60 80 100 120 140 160 180 1990 1995 2000 2005 2010 Canada U.S. debt as a % of pdi Source: Statistics Canada, Federal Reserve Board, Haver Analytics *Note: Both measures are caculated in a way that makes them comparable. The Canadian measure totals 146% when you include accounts payable. Craig Alexander, SVP and Chief Economist 416-982-8064 mailto:craig.alexander@td.com Derek Burleton, Vice President & Deputy Chief Economist (Canada) 416-982-2514 mailto:derek.burleton@td.com Diana Petramala, Economist (Canada) 416-982-6420 mailto:diana.petramala@td.com
  • 2. Special Report October 20, 2010 TD Economics www.td.com/economics 2 Nowhere was the impact of lower borrowing costs and greater household confidence more clearly observed than in the housing market, where ownership rates increased steadily over the past two decades. A self-perpetuating cycle occurred. Strong increases in demand bid up hous- ing prices, which together with equity market gains prior to the 2008/2009 recession, raised net wealth. This positive wealth effect encouraged households to increase their rate of investment and consumption, further driving up borrowing and debt levels. Demographics also helped drive demand for credit. Baby boomers (individuals born between 1946 and 1964) shaped debt trends just as they shaped product markets. They bought homes and then moved up the property ladder over time, using real estate as a source of wealth creation. Another key macroeconomic trend that boosted demand for credit was increased labour market participation by women. Experience shows that households with two income earners tend to carry more debt per person relative to their income. Having two incomes creates a sense of income security, as the probability of losing both income streams is much reduced. This can be a false sense of security if both incomes are needed to service debt. During the 2000s, the “echo” generation has been provid- ing a boost to home purchases, helped by favourable housing affordability created by low interest rates that allowed these young workers to borrow sizeable amounts. Demand for credit has received a significant boost from a cultural shift from thrift towards consumerism. This has been an international trend, in which consumers have a greater desire to consume larger quantities of goods and services than they have in the past – particularly discre- tionary items. Households have also become impatient, meaning that when they want something, they have become more inclined to finance purchases through credit to enjoy consumption sooner rather than later. This has altered the lifepath of spending. The traditional lifepath model is that individuals wish to smooth consumption over their lifetime. They borrow when young, pay down debt and save for re- tirement when more mature, and then run down savings and assets when older. However, individuals are now taking on debt earlier, and maintaining debt longer. For example, an increasing number of retirees are carrying debt after leaving the labour market. As one might expect, carrying a higher debt burden means that more Canadians are at risk of running into dif- ficulty meeting their financial obligations in the event of an unforeseen economic or financial shock. This would normally act as a check on growth in demand for credit. However, the social stigma associated with declaring personal insolvency has declined. Indeed, whereas in the 1950s or 1960s individuals would find it difficult to admit bankruptcy, today such an occurrence is generally met with understanding and support – a desirable and positive devel- opment but one that is still supportive to increased leverage of personal balance sheets. Moreover, individuals who go into bankruptcy are no longer credit market outcasts. Seven years after declaring insolvency, individuals become eligible for credit once again from most institutions, and in the interim most are able to get access to credit, albeit at likely punitive interest rates. How important have supply side factors been in driving credit? As demand for credit rose in recent decades, a number -15 -10 -5 0 5 10 15 20 25 1980 1989 1998 2007 Real household credit (y/y%) 3-month t-bill yield (%) Source: Statistics Canada, Bank of Canada, Haver Analytics HOUSEHOLD CREDIT SHOWS DELAYED RESPONSE TO INFLATION TARGETING Inflation target introduced % CANADIAN HOMEOWNERSHIP RATES 56 58 60 62 64 66 68 70 1971 1976 1981 1986 1991 1996 2001 2006 % of occupied private dwellings owned Source: Statistics Canada
  • 3. Special Report October 20, 2010 TD Economics www.td.com/economics 3 of supply-side developments helped raise credit availabil- ity to households. These supply-side developments have included increased competition within the financial indus- try, the growing use of securitization, product innovation, deregulation in the banking sector and the relaxing of some credit constraints, which particularly benefited first-time home buyers. A number of reforms to the Bank Act occurred in the 1980s and early 1990s that increased competition in the Canadian financial sector. Domestic competition was heightened, and while foreign banks have been operating in Canada since the early 1980s, changes to the BankAct in the late 1990s removed some restrictions on foreign banks. Non-bank lenders also became more active in credit markets. The impact on pricing was more limited than the impact on the supply of credit as institutions fought over market share. Furthermore, financial innovations like the automation of credit approval, and widespread use of standardized credit scoring helped to make the loan application process move more quickly and efficiently. But even more importantly, increased competition helped to spur significant financial innovation that made credit more attractive. Credit cards that provided benefits to card-holders for travel and the like was one innovation of note in the 1980s that encouraged individuals to carry larger monthly balances. The introduc- tion of home equity lines of credit (HELOCs) was the most significant innovation of the 1990s and 2000s. Prior to HELOCs, the ability of households to borrow was largely constrained by their current and future income. HELOCs have allowed households to borrow more against the value of their homes or extract equity from their home for con- sumption or investment purposes, while simultaneously of- fering more flexible repayment terms than with a traditional mortgage. The result has been greater access to credit and lower monthly payments in a low interest rate environment. As shown in the accompanying chart, the popularity of HELOCs has risen over the past 10 years. Innovations in the ways financial institutions fund mort- gages and other loans have also played a supportive role. Securitization of mortgages and other loans lowered funding costs for financial institutions, which in turn increased the supply of credit. Another contributor to rising household indebtedness over the last 20 years has been adjustments to mortgage insurance rules. Three major changes to mortgage insur- ance rules helped to make mortgage credit more available and attractive. First, the required down payment was reduced. In the early 1990s, a homebuyer required a 10% down payment to qualify for mortgage insurance. Through a series of regula- tion changes over the 1990s and early 2000s, the minimum down payment was reduced to 5%. The down payment was temporarily lowered to zero by the end of 2006, but was then taken back up to the current requirement of 5% in October 2008. Second, the qualification requirement for mortgage in- surance was eased inApril 2007. Ahomebuyer is currently only required to purchase mortgage insurance if the down payment is less than 20%; previously that threshold was 25% Third, the maximum amortization was increased in steps from 25 years at the start of 2006 to 40 years by the fall of that year. As we discuss later, this has since been reduced to 35 years in October 2008. The extension to 40 years amortization provided a sizeable boost to affordability. For CANADIAN HOUSEHOLD CREDIT 0 200 400 600 800 1,000 1,200 1,400 1,600 1971 1976 1981 1986 1991 1996 2001 2006 Economy-wide Chartered Banks Bil. C$ Source: Statistics Canada/Haver Analytics Impact of securitization, non-bank lenders and foreign lenders CANADIAN HOUSEHOLD CREDIT BY TYPE OF CREDIT 0 200 400 600 800 1,000 1,200 1,400 1,600 2006 2007 2008 2009 2010 Other Credit HELOCs Source: Bank of Canada, Equifax Bil. C$
  • 4. Special Report October 20, 2010 TD Economics www.td.com/economics 4 example, an individual with an income equal to the national average in 2007 that purchased a home equal to the national average at that time and opted to finance at the 5-year posted rate could carry a mortgage $40,000 larger with a 40-year amortization period rather than a 25-year one with the same monthly payments. The bottom line is that all of these changes boosted hous- ing affordability and encouraged more rapid growth in real estate associated debt. Up to this point, we have itemized the various demand and supply factors, but one should also acknowledge that there is a significant interplay between the two. Typically, this dynamic is pro-cyclical. During periods of robust economic and housing activity, demand for credit rises and financial institutions accommodate the growth by increasing credit availability and innovating in order to boost supply of credit. However, the last couple of years have been atypical. Household debt accelerated relative to income during the most recent recession, bucking the experience of the past two recessions in the 1980s and 1990s when rising unemployment led to slower personal debt accumulation. In both of the last two economic recessions in Canada, a tightening in monetary policy was a leading contributor to the downturn. Leading up to this past downturn, interest rates were not as high as they were heading into the 1980s and 1990s recession, and as a result, monetary policy has been far more accomodative this time around. As we will argue later, this countercyclical behaviour may have helped get the Canadian economy out of recession, but it has also meant that the economic downturn failed to unwind the period of excessive debt growth relative to income that took place in the 2000s. Is Canada alone in experiencing an upward trend in the debt-to-income ratio? With similar supply and demand dynamics evident across the advanced economies, the upward trend in household indebtedness over time has been an international phenomenon. In countries that tend to be more conserva- tive towards household borrowing and have lower home ownership rates – like Germany, Italy, and France – the rise in indebtedness has been more shallow and gradual. Nonetheless, inflation targeting by the European Central Bank and credit innovations that improved debt affordability still boosted credit growth. In the historically Anglo-Saxon countries of the U.S., U.K., Canada and Australia – which tend to have a culture more tied to consumption and home ownership – household debt growth has been the strongest. The rise in indebtedness in the U.S. and U.K. was remark- able and clearly excessive. These countries experienced a large housing bubble that was subsequently followed by a real estate bust in 2007 and 2008, which resulted in a sharp decline in household debt-to-income ratios. Australia’s economic performance over the last two years has been the most like the Canadian experience, but nothing like that in the U.S. and U.K.. The comparability of the Canadian and Australian experience is not surprising, as both are small open commodity-driven economies where domestic demand remained strong and the housing market and labour market recovered quickly after a short-lived contraction during the 2009 recession. Nevertheless, monetary policy has not been as accomodative ‘down under’, nor was there the same degree of relaxation in mortgage rules inAustralia. Accord- ingly, the rise in household indebtedness in Australia over the last three years has been more subdued than in Canada. INTERNATIONAL PERSPECTIVE ON HOUSEHOLD INDEBTEDNESS 0 20 40 60 80 100 120 140 160 180 1993 1995 1997 1999 2001 2003 2005 2007 2009 Australia France Germany Sweden U.K. debt as a % of pdi Sources: ABS, BBK, ONS, INSEE. *Note: Methodology differences make these meaures not comparable to Canada, but are still indicative of trend EXISTING HOME AFFORDABILITY 20 25 30 35 40 45 90 92 94 96 98 00 02 04 06 08 10 40-year amortization 25 year amortization Mortgage payments* as percentage of income * For the average price home using a 75% LTV ratio, 5-year fixed rate. Source: CREA, Statistics Canada, Bank of Canada
  • 5. Special Report October 20, 2010 TD Economics www.td.com/economics 5 Is there a limit to how high the debt-to-income ratio can rise? There is no ‘constant’or ‘optimal’debt-to-income ratio. As mentioned earlier, the demand for debt is influenced by trends in personal finance and personal preference. For example, if debt is being accumulated to purchase assets, and asset prices are likely to rise at a considerable rate, then borrowing to accumulate wealth makes perfect sense and can lead to a higher debt-to-income ratio. Moreover, financial innovation can lead to a structural rise in debt relative to income. Imagine a situation where mortgages could be amortized over 100 years. The resulting decline in debt service costs would mean that households could carry much higher debt relative to income. What truly matters is whether the prevailing debt-to-income ratio makes sense based on the current structure of financial services and the prospects for personal finances. The recent U.S. and U.K. experience shows what can happen when the ratio does become excessive relative to economic and financial fundamentals. Coincidently, debt- to-PDI ratios in both countries peaked at close to 160% of PDI – some 14 percentage points above Canada’s current level. Can a 160% threshold be used as an appropriate guide- line for determining when a particular risky level has been reached? The challenge with merely applying the 160% threshold to Canada is that it fails to account for the fact that debt ratios in the U.S. and U.K. likely overshot their sustain- able levels. The issue is by how much, and that is difficult to tell. Furthermore, the appropriate level of debt relative to income is likely higher given the different debt structure in these countries. For instance, in the U.S., households can deduct mortgage interest payments from their income taxes payable. This would have the effect of allowing U.S. households to carry more debt relative to income than Ca- nadian households. Moreover, the debt-to-income ratio has its own inherent limitations. Since households often use debt to accumulate assets, which in turn can be drawn on in case of financial stress, or used to smooth out their consumption and/or to provide income during retirement, it becomes critical to look at a broader array of household ratios to assess the vulnerability of households to economic shocks. These in- clude the debt-to-net worth ratio, the asset-to-liability ratio and the share of homeowner’s equity within total assets. Most importantly, the total debt-to-income ratio falls short in providing a clear gauge on the ability of households to meet their debt obligations. This is because the income used is annual income, and Canadian households don’t pay off all their debt in one year. So, affordability of debt as measured by an estimated debt service ratio needs to be a key part of the analysis. What are these other indebtedness metrics saying? Consistent with the debt-to-income ratio, all of the Ca- nadian debt metrics seem to line up on the side of growing vulnerability, but not a looming crisis. First, one needs to consider the evolution of household balance sheets. Over the 1980s and 1990s, the rise in the household debt-to-income ratio was accompanied by sta- bility in the debt-to-assets ratio and the debt-to-net worth ratio. In the 2000s, however, there was a break in the trend where accumulation of household debt was encouraged by capital gains. Put another way, households saved less and HOUSEHOLD INDEBTEDNESS GROWS OVER TIME 60 70 80 90 100 110 120 130 140 150 160 1990 1995 2000 2005 2010 debt as a % of pdi Source: Statistics Canada, Haver Analytics HOUSEHOLD INDEBTEDNESS AND ASSET ACCUMULATION 0 100 200 300 400 500 600 700 800 900 1990 1994 1998 2002 2006 2010 0 20 40 60 80 100 120 140 160 assets indebtedness debt as a % of pdiassets (book value) as a % of pdi Source: Statistics Canada, Haver Analytics
  • 6. Special Report October 20, 2010 TD Economics www.td.com/economics 6 relied too heavily on asset price gains to do the saving for them, while at the same time they were comfortable adding to their debt obligations. The trouble is that at least some of the asset price gains are likely unsustainable, as equities are struggling to regain the ground they lost during the recent financial turmoil. Moreover, TD Economics believes that national average home prices have risen roughly 10-15% above the levels supported by economic fundamentals. Since 2006, the rise in the debt-to-income ratio has been associated with a large increase in the ratio of debt-to-assets and debt-to-net worth for the first time on record. Over 2009, the rise in these measures largely reflected a sharp decline in asset values related to the short-lived correction in housing and equity markets. However, even as asset values have returned to pre-recession levels, these measures remain at historically high levels. This is particularily concerning given that we believe that the rebound in asset values may be a bit overdone. Estimates of the aggregate household debt service ratio have also been flashing some warning lights. What is typi- cally used to assess debt affordability is the ratio of interest payments on debt as a share of PDI. This measure, which does not include principal payments, is popular in large part because it is computed and made readily available by Statistics Canada. Interest costs also pose the biggest risk to household finances, whereas principal payments are generally stable. Although interest costs absorb a relatively small share of PDI, the fact that they are not at record lows given the near record low level of interest rates is striking. In fact, the last time the debt-service ratio was at its current value of 7.2%, the overnight rate was at 4.25% rather than its current level of 1.00%. This perspective is somewhat backward looking, how- ever, since interest rates will not remain at these emergency levels over the medium-to-longer term. An important exercise is to calculate what this ratio would rise to if the overnight rate were at a more normal level, say 3.5%, given a debt-to-income ratio of 146% and a moderate pace of PDI growth of 3.0-4.0%. Under this scenario, the debt-interest cost ratio would climb to 8.5% – a level not experienced since mid 1990s when interest rates were at double digits. But, once again, this does not provide the full story, since households must shell out to meet both principal and interest payments. In Canada, data on principal repayments is dif- ficult to come by. The Bank of Canada uses data available from the Ipsos Reid Canadian Financial Monitor (CFM), which provides detailed financial data on households across the country1 . Similar to the interest-only debt service ratio, these figures reveal that the affordability of debt remains within a comfortable range but only because interest rates remain extremely low. However, if short-term rates were to rise towards 3.5% and 5-year rates were to rise towards 5%, the combined principal and interest payments would reach 23% of PDI – the highest level since 1999, which is the start of the series. Under the more likely scenario in which the debt- to-income ratio continues to grow – albeit at a much more muted pace than experienced since 2007 – debt servicing costs will reach 24% of PDI as interest rates return to more normal levels. Put another way, if interest rates rise 3 per- centage points, the debt-to-income ratio would have to fall back to levels seen in 2006 (125%-130%) to have the same debt service costs as today. INTEREST DEBT SERVICE RATIO -5.0 -1.0 3.0 7.0 11.0 15.0 1990 1993 1996 1999 2002 2005 2008 2011 2014 5.0 6.0 7.0 8.0 9.0 10.0 11.0 3-month t-bill Interest debt service ratio 3-month tbill (%) DSR (%) Souce: Statistics Canada, Haver Analytics, Forecast by TD Economics as of October 2010 Forecast CANADIAN HOUSEHOLD METRICS OF INDEBTEDNESS 10 12 14 16 18 20 22 24 26 Q1-1990 Q1-1993 Q1-1996 Q1-1999 Q1-2002 Q1-2005 Q1-2008 Debt-to-assets Debt-to-net worth Ratio, % Source: Statistics Canada/Haver Analytics
  • 7. Special Report October 20, 2010 TD Economics www.td.com/economics 7 What share of the Canadian population is particularly vulnerable? Average statistics can conceal the real story. In this case, the moderate increase in the aggregate debt affordability numbers hides the true extent of Canadians that are in a position of financial stress. Researchers at the Bank of Canada (BoC) use the Ipsos Reid data to estimate the number of households that would become financially vulnerable given the current level of indebtedness, and under various interest rate outcomes. The standard the BoC applies to determine financial vulnerability (or stress) is households whose debt-service ratio exceeds 40%. The BoC uses a 40% threshold to determine vulner- ability, because households with debt service ratio above this mark have a greater probability of defaulting on their loans. The analysis was last published in early 2010, using 2009 data. The BoC found that just over 6% of households were in a position of financial stress at that time. Under a scenario where the overnight rate rises to 3.5%, debt contin- ues to grow at its current rapid pace, and PDI growth runs at a healthy 5% annualized growth, approximately 7.5% of households would become financially vulnerable. Since the BoC conducted its analysis, more up-to-date figures from Ipsos Reid have been released for the first half of 2010. We have used similar methodology to the BoC’s to rerun the analysis. Based on the new figures, a slightly higher 6.5% of households are currently financially vulnerable (or have a debt-service ratio of 40% or above). More striking, the share of those on the verge of becoming vulnerable (those with a debt-service ratio of 30-40%) had risen from 7.2% in 2009 to 9.3% - up almost two percent- age points. Given the change in the distribution of debt, we have estimated that as much as 10-11% of households may become financially vulnerable if the overnight rate rose to 3.5% under similar assumptions used by the Bank of Canada2 . The ratios do not suggest that a major personal financial crisis is brewing. For example, the vulnerability ratio reached 15% before U.S. households became signifi- cantly distressed. Furthermore, financial stress in the U.S. was compounded by a massive spike in the unemployment rate. But, the analysis does highlight that more Canadians are vulnerable to higher interest rates that must ultimately come when the economy is stronger. What segment of the population is particularly at risk? Digging even deeper into the Ipsos Reid database, it be- comes apparent that the concentration of those households in financial stress are at the low end of the income spectrum. While about three quarters of overall debt is still held by middle-to-high income families, low-income families have the highest debt-to-income ratio (180%), and the highest debt-service ratio (25%). Households in the lowest income bracket are also more vulnerable to rising interest rates and would face debt service costs exceeding 30%, on average, if interest rates were to normalize, thus pushing them close to the financial stress threshold. These statistics are important because low-income families are more susceptible to adverse economic shocks (more likely to lose their jobs), and they do not have a strong asset base that they can liquidate in times of financial stress. The Ipsos Reid data also shows that the older popula- tion (65+ years) is holding more debt than they have in the past, and those that should be preparing for retirement (ages HOUSEHOLDS ARE HOLDING MORE DEBT 0 5 10 15 20 25 30 35 40 0-10% 10-20% 20-30% 30-40% greater than 40% 2005 2009 2010Q1 Debt Service Ratio (%) % of debt-holding households with given debt-service ratio Source: Ipsos Reid TOTAL HOUSEHOLD DEBT-SERVICE RATIO (for debt-holding households) 0 5 10 15 20 25 30 1999 2002 2005 2008 t=1 Source: Ipsos Reid, Forecast by TD Economics as of October 2010 Debt service costs as a % of PDI Impact as interest rates normalize, and debt-to-income remains constant
  • 8. Special Report October 20, 2010 TD Economics www.td.com/economics 8 55-64 years) are carrying heavier debt burdens than in the past. The data indicate that more Canadians are choosing to stay in the labour force longer – perhaps due to higher debt loads or lower financial security. However, interpreting the data is difficult. An alternative perspective could be that the higher debt load is the result of households choosing to work longer simply because they want to, or are physically able to. The causation is unclear, but the higher indebted- ness of older Canadians is concerning. Are we headed for a U.S.-style deleveraging? In spite of growing vulnerability of a significant minor- ity share of households, the level of risk associated with household indebtedness appears significantly lower than that in the United States. As we have already noted, the U.S. debt ratio at its peak in 2007 was significantly higher than in Canada today. In the U.S., bankruptcies and loan delinquencies were also a larger concern than they are in Canada. For instance, the share of mortgage in arrears in the lead-up to the recession (i.e., those related to the level of debt rather than unemployment) jumped to 1.5% in the U.S. – a level three times higher than that currently recorded in Canada. The key explanation behind the differing household credit conditions are well known by now. In the U.S., fi- nancial institutions undertook much riskier lending practices during the sub-prime boom. As a result, a much higher share of U.S. households became over-extended. In 2007, 15% of U.S. indebted households had a debt service ratio above 40% – twice the level of that in Canada. Even under the scenario where household debt continued to grow signifi- cantly faster than income over the next couple of years, the share of Canadian households that would become financially vulnerable would not reach the levels experienced south of the border in 2007. As mentioned above, the ability of households to deduct mortgage interest costs from taxes pay- able would have the effect of allowing U.S. households to carry more debt relative to their income than their Canadian counterparts. However, that being said, research still shows that households with a debt-service ratio of 40% and above are more likely to become delinquent on loan payments. Another differentiating factor is the stronger balance sheets enjoyed by Canadians, on average. In the United States, there was a more pronounced deterioration in other measures of indebtedness – such as the debt-to-assets and debt-to-net worth ratios – leading up to the crisis compared to the recent experience in Canada. The average Canadian has a significantly higher amount of equity built up in their homes, relative to their U.S. counterparts, where many had negative equity positions. In the U.S. (and U.K.) a large MORTGAGE IN ARREARS 0 1 2 3 4 5 6 1990 1995 2000 2005 2010 Canada U.S. % of outstanding mortgages Souce: CBA, Moody's U.S. HOUSEHOLDS MORE VULNERABLE THAN CANADIAN HOUSEHOLDS 0 5 10 15 20 25 30 35 0-10% 10-20% 20-30% 30-40% greater than 40% U.S. (2007) Canada (2010 Q1) Debt Service Ratio (%) % of debt holders within given range of debt-service-ratio Source: Ipsos Reid, Federal Reserve Board DEBT SERVICE RATIO BY INCOME GROUP Excluding credit cards 0 5 10 15 20 25 30 35 <$50k $50k to <$80k $80k to <$120k >=$120k Current (Q1 2010) DSR with rates at 3.0% DSR with rates back to 4.0% debt payments as a share of income Income level Source: Ipsos Reid, Forecast by TD Economics as of October 2010
  • 9. Special Report October 20, 2010 TD Economics www.td.com/economics 9 Implications for Personal Insolvencies The growing financial stress among low income Canadians and the likelihood of a relatively high un- employment rate projected (7.5-8%) over the medium term suggests that the rate of credit delinquencies and bankruptcies will remain elevated at close to their cur- rent level over the next few years. At the same time, however, the share of debt held by households who declare insolvency (or that write-off debt) is likely to remain low at 0.6%. Ditto for mortgages in arrears, at 0.5%. There are risks to this outlook. Historically, the number of bankruptcies have been tightly tied to la- bour market conditions, but as of late they have been much higher than would be suggested by the rise in the unemployment rate. The number of bankruptcies per capita during this recession was 50% higher than the 1990s recession – despite the stronger performance of the domestic economy and labour markets this time around. And, despite a stunning recovery in Canadian employment, the level of bankruptcies and insolvencies have remained elevated – likely a consequence of the level of debt. The implication is that one needs to be more cautious when looking at the unemployment rate as the traditional driver of delinquencies, as greater emphasis is likely required on the level of indebtedness. share of households had taken advantage of a quicker ap- preciation in home prices relative to that in Canada in order to increase their borrowing further. At one point, 75% of mortgage renewals in the U.S. were taking on larger out- standing balances, as Americans were rapidly extracting equity from their homes for consumption purposes. While Canadians have also been extracting equity from their homes for consumption, the trend has been far less pronounced and the bulk of the debt accumulation has been largely associ- ated with the purchase of a home – and in particular – first time homebuyers jumping into the market. What is the appropriate level of the Canadian personal debt-income ratio? Although estimating the appropriate level of the debt- to-income ratio is not an exact science, we have developed a model that appears to provide good predictive power. Variables in the model include: assets as a per cent of PDI, the unemployment rate, core inflation, housing affordability (which would include changes in rules that increase amor- tization), the 5-year government bond yield (a proxy for the 5-year mortgage rate) and home prices. According to this model, household indebtedness can sustainably grow in direct relation with a rising asset base, improving afford- ability and a lower jobless rate. The model suggests that after running more or less in line with its equilibrium level until 2007, the debt ratio has since exceeded it. Applying the TD Economics base case economic forecasts for these inputs over the next few years, a sustainable level of debt- to-PDI is estimated in the 138-140% range over the next 5 years – some 6-8 percentage points below its current level. APPROPRIATE PATH OF CANADIAN HOUSEHOLD INDEBTEDNESS 0 20 40 60 80 100 120 140 160 1980 1984 1988 1992 1996 2000 2004 2008 2012 debt as a % of pdi Actual + TD Economics September forecast Model estimation of optimal debt-to- income ratio Source: Statistics Canada/Haver Analytics, est. and forecast by TD Economics as of October 2010 FCST What does this sustainable range imply about the future path of borrowing? Taken at face value, the current excess of household debt relative to income implies that a considerable and protracted adjustment is required in order to bring the ratio back to a HOMEOWNER'S EQUITY 35 45 55 65 75 1990 1992 1994 1996 1998 2000 2002 2004 2006 2008 2010 U.S. Canada % Source: Statistics Canada, Federal Reserve Board, Haver Analytics Start of U.S. recession
  • 10. Special Report October 20, 2010 TD Economics www.td.com/economics 10 an appropriate level. Consider that average annual growth in household debt has run at 8% per year over the past de- cade. In a world of moderate 4% annual average growth in PDI, average growth in household credit would need to be constrained to about 2% per year in order to return the debt ratio back to 140% within three years. Average annual debt growth of 3% would get you there in five years. These slight rates of debt growth would be unprecedented in Canada in a non-recessionary period, and they are unlikely to occur in an abnormally low interest rate environment. However, we do believe that debt growth might slow from the 8% aver- age annual gain in the last decade to 5% per annum over the coming five years. While not an exhaustive list, there are a number of in- fluences that will provide a natural brake to credit growth over the next few years: • Housing activity is likely to remain relatively subdued – in recent years, first-time home buyers have accounted for as much as half of purchases, up from their long- term average of about one-third. With many rushing to get ahead of higher rates, and the pool of first time buyers largely exhausted in our view, housing activity is unlikely to return back to its recent peak over the next several years. The slowing in the housing market will feed through to other types of big-ticket consumer purchases and overall demand for credit. • Capacity to borrow is likely to be more constrained – the consequence of being above a sustainable level of indebtedness is that the capacity to take on more debt is constrained. First, with increased usage during the recession, the available credit on home-equity lines has fallen relative to pre-recession levels. Second, as we have discussed, as interest rates head up gradually, households will have to devote a greater share of their income to paying their monthly debt obligations. Higher interest rates will also diminish the numbers of individuals qualifying for credit. • Appreciation of asset values will be more moderate – going forward, we expect that households will not be able to leverage rapidly growing asset values to the same extent as over the past decade. In view of the widespread belief that economic growth will be only gradual, the pace of corporate profit growth in the coming years is likely only to support equity returns of 6-8% over the long haul, almost half the rate experienced over the last decade. Meanwhile, home prices are expected to grow at their long-run average of about 4% in the coming decade, which is also close to half of its trend rate before the recession. • Structural supply influences likely to provide less of a boost . Some of the changes to the mortgage insurance rules were reversed. The maximum amortization period went from 40 years to 35 years, and the required down payment went from 0% to 5% in October 2008. The In early 2010, the Federal Government also hardened mortgage insurance qualification rules. Banks are now required to income test borrowers against the 5-year posted mortgage rate for all mortgage vehicles of less than 5-year term and the 5-year contracted rated on all 5-year mortgages, whereas banks had been using the 3-year posted mortgage rate in the past. These changes have eroded a quarter of the improvement in housing affordability that occurred in 2007 with the loosening of the mortgage insurance rules. The minimum down payment on non-owner occupied properties was also increased to 20%. Finally, some of the kick to credit growth provided by the decade-long shift to flexible lines of credit may have run its course. • Demographics might also temper credit growth, as more baby boomers enter retirement. This would be the typical conclusion from lifecycle modeling. However, a case could be made that the effect might be constrained by financial innovation. Given the higher debt loads among individuals nearing, or in, retirement – coupled with less retirement income and a low personal savings rate – there might be greater demand for financial vehicles that allow retirees to withdraw equity from their homes. For instance, HOUSEHOLD ASSET GROWTH -6 -4 -2 0 2 4 6 8 10 12 14 2000 2002 2004 2006 2008 2010 2012 Forecast year-over-year % change Source: Statistics Canada, Haver Analytics, Forecast by TD Economics as of October 2010 2000-2008 annual average
  • 11. Special Report October 20, 2010 TD Economics www.td.com/economics 11 reverse mortgages may become more popular in the future. Financial institutions are likely to create new lending products to accommodate this demand, which would act as a new source of credit. Clearly, if such a trend took place, policy makers would need to consider prudent regulatory guidelines. However, this innovation is not likely in the next couple of years, but is plausible over a longer time horizon. If debt growth does slow to the 5% annual pace that TD Economics anticipates over the next five years, not only would it not fail to unwind the excess in personal indebted- ness present at the moment, but would aggravate it. The base case forecast is for real economic growth of roughly 2% per year, supporting personal disposable income growth of 4% annually. This mix of debt and income growth would see the personal debt-to-income ratio climb to 151% by 2013 – roughly 11 to 13 percentage points above our estimation of the sustainable level. In our forecast, the moderate economic growth and sus- tained low inflation environment means that interest rates rise slowly, with the overnight rate only returning to 3.50% in 2013 and holding at that level for some time. So even though Canadians facing debt service charges in excess of 30% will face a challenging period ahead and debt will be increasingly excessive relative to income, debt will remain manageable for the majority of Canadian households. Incidentally, in the late 1970s and early 1980s, the household debt-to-income ratio remained above its sustain- able level for about five years. This period of unsustainable borrowing was followed by a drop in the debt-to-income ratio, which remained below its long-run trend value for a subsequent three years. The catalyst for the adjustment was a deep recession and a large spike in the unemploy- ment rate. The challenge this time around is that, short of a double-dip recession that we don’t expect, the trigger to scale back household borrowing by more than in the TD Economics base case forecast must be higher interest rates than currently projected or prudential actions. What are the key risks that might lead to a harder landing? Due to our expectation of continued low interest rates, our base case outlook pushes the adjustment period out to the second half of the decade. In the near term, we are concerned about two negative risks in particular: (i) a negative shock to income growth or (ii) a renewed wave of borrowing that could lead to a more painful consumer finances adjustment down the road. The odds of either event happening is material, but not high enough to be the most likely scenario. We would put the odds of either outcome at perhaps 1-in-3. In terms of the first risk, a major disruption to household income resulting from a double-dip U.S. recession or an un- anticipated financial shock that would impact the Canadian economy and impact household finances. In contrast to the 2008-09 global recession, the ability of Canadian consumers and governments to spend their way through the downturn would be much more constrained, leading to a material recession and a sharp increase in the unemployment rate to above 10%. Since many households do not have much financial wiggle room, any significant disruption in income could cascade into larger delinquencies and a deleveraging by households. Under this scenario, we project that the appropriate debt-to-income ratio would fall to 127-128% by 2013 (see chart) and would require a greater degree of HOUSEHOLD DEBT SERVICE RATIO UNDER VARIOUS ECONOMIC SCENARIOS 0 5 10 15 20 25 30 1999 2001 2003 2005 2007 2009 2011 2013 Base case Double-dip recession Indebtedness continues current trend debt payments as a % of income Source: Ipsos Reid, Forecast by TD Economics as of October 2010 fcst 0 20 40 60 80 100 120 140 160 180 200 1980 1985 1990 1995 2000 2005 2010 TD Economics September 2010 Forecast Double-dip Scenario Sustainable Level Base Case Sustainable Level Current Trend Continues Source: Statistics Canada/Haver Analytics, est. and forecast by TD Economics as of October 2010 FCST debt as a % of pdi APPROPRIATE LEVEL OF HOUSEHOLD INDEBTEDNESS UNDER VARIOUS ECONOMIC SCENARIOS
  • 12. Special Report October 20, 2010 TD Economics www.td.com/economics 12 adjustment in consumer finances down the road. Alternatively, there is an upside risk to debt growth in the near term. With interest rates at abnormally low lev- els, households could resume their borrowing binge in the coming quarters following a short breather. In particular, medium- and long-term bond yields have fallen to histori- cal lows over the first six months of this year, which could encourage an acceleration in the housing market. If this outcome were to play out, households would wind up in a more dire debt position. Under this case, the debt ratio could rise to 160% by 2012, which would send a strong warning signal that a material future household deleveraging might be required. One final alternative to our base case forecast is the most desirable outcome, where the Canadian economy performs much better than anticipated, income growth surprises on the upside and this allows the debt-to-income ratio to moderate. This would be ideal, but can’t be counted on. Bottom line To sum up, at 146% of average after-tax personal income, Canadian household debt has become excessive. Looking ahead, there are a number of influences that are likely to restrain growth in credit to well below its recent rate – a simmering down in the still-overheated housing market chief among them. But in a sustained low interest rate en- vironment, there are limits to how much borrowing is likely to slow. Under our base case forecast, the overall debt-to- income ratio is likely to rise even higher over the next five years – to 151% – even with the anticipated moderation in credit growth. In contrast, TD Economics estimates that the appropriate level of personal debt-to-income ratio is in the order of 138-140%. At some point, monetary policy will have to be rebal- anced and interest rates will have to move back up to more neutral levels. TD Economics expects the overnight rate to rise to 3.50% in 2013. This will create financial stress on some Canadian households, but not the majority. A U.S.- style household debt crisis is not in the making. Nevertheless, policy makers and lenders should be aware that personal indebtedness is becoming a more pressing problem, and low-income Canadians are particularly vul- nerable to future interest rate increases. This suggests that prudential actions might be warranted to temper the rate of debt growth in the future. Having said that, the govern- ment needs to proceed with caution on the regulatory front. Implementing tough new measures at a time when the economy is fragile could generate a hard landing in real estate and prove counterproductive. It would be better to develop a strong understanding of what has been driving the rise in personal indebtedness and the distribution of that debt while weighing the available policy options, but wait until the extent of the housing cycle is known and the economy is on firmer ground before instituting any tighter regulations. This approach would be prudent. It takes time for policies to be developed and implemented. So, having a understanding of how to respond in the future to rising indebtedness would be sensible, just in case Canadian households fail to cool their rate of borrowing in order to take advantage of historically attractive interest rates. To be clear, the Canadian economy is best served by monetary policy that targets overall inflation and that might call for low interest rates for an extended period of time. Monetary policy is not capable of targeting personal credit growth in isolation, but regulatory changes can do so.
  • 13. Special Report October 20, 2010 TD Economics www.td.com/economics 13 This report is provided by TD Economics for customers of TD Bank Financial Group. It is for information purposes only and may not be appropriate for other purposes. The report does not provide material information about the business and affairs of TD Bank Financial Group and the members of TD Economics are not spokespersons for TD Bank Financial Group with respect to its business and affairs. The information contained in this report has been drawn from sources believed to be reliable, but is not guaranteed to be accurate or complete. The report contains economic analysis and views, including about future economic and financial markets performance. These are based on certain assumptions and other factors, and are subject to inherent risks and uncertainties. The actual outcome may be materially different. The Toronto-Dominion Bank and its affiliates and related entities that comprise TD Bank Financial Group are not liable for any errors or omissions in the information, analysis or views contained in this report, or for any loss or damage suffered. Endnotes and References 1. The Ipsos Reid data are not widely available, and thus, are not frequently cited. Note, we use the Ipsos Reid data to look at households who currently hold debt. The results from the CFM are not comparable to the Statistics Canada interest only debt- service ratio, because that estimate looks at all households – those who hold and do not hold debt. According to the CFM, 30% of Canadian households are debt-free. Despite the methodological difference, the Ipsos Reid data tell the same story. 2. Using Ipsos Reid’s CFM data at less than at an annual frequency may lead to biases in the results due to small sample issues, as the sample size in a quarter is roughly a quarter the size of the annual sample. However, quarterly data provides a good leading indicator of the direction of the data. 3. Faruqui, Umar, “Indebtedness and the Household Financial Health: An Examination of the Canadian Debt Service Ratio Distribution”, Bank of Canada working paper, December 2008. http://www.bankofcanada.ca/en/res/wp/2008/wp08-46.html 4. Djoudad, “The Bank of Canada’s Analytic Framework for Assessing the Vulnerability of the Household Sector”, Bank of Canada Financial System Review, June 2010 http://www.bankofcanada.ca/en/fsr/2010/index_0610.html 5. Bank of Canada Financial System Review, Jun 2010, http://www.bankofcanada.ca/en/fsr/index.html