Slovenia Vs Serbia UEFA Euro 2024 Fixture Guide Every Fixture Detailed.docx
Zee Entertainment Q1
1. ZEE ENTERTAINMENT ENTERPRISES LIMITED
Regd. Office: 135, Continental Building, Dr. A. B. Road, Worli, Mumbai - 400 018
www.zeetelevision.com
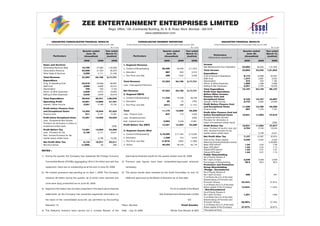
UNAUDITED CONSOLIDATED FINANCIAL RESULTS CONSOLIDATED SEGMENT REPORTING UNAUDITED FINANCIAL RESULTS
Of Zee Entertainment Enterprises Ltd. and its Subsidiaries for the quarter ended June 30, 2009 Of Zee Entertainment Enterprises Ltd. and its Subsidiaries for the quarter ended June 30, 2009 Of Zee Entertainment Enterprises Ltd. for the quarter ended June 30, 2009
Rs. in Lacs Rs. in Lacs Rs. in Lacs
Quarter ended Year ended Quarter ended Year ended Quarter ended Year ended
June 30, March 31, June 30, March 31, June 30, March 31,
Particulars Particulars Particulars
(Unaudited) (Audited) (Unaudited) (Audited) (Unaudited) (Audited)
(Stand-alone operations)
2009 2008 2009 2009 2008 2009 2009 2008 2009
Sales and Services 1. Segment Revenue Income
Advertising Revenue (Net) 19,796 27,982 1,05,926 Net Sales/Income from Operation 23,893 33,332 1,21,024
a. Content & Broadcasting 46,406 52,556 2,11,910
Subscription Revenue 24,098 21,503 90,376 Total Income 23,893 33,332 1,21,024
b. Education 887 620 2,513
Other Sales & Services 3,699 4,711 21,429 Expenditure
c. Film Prod. and Dist. 300 1,020 3,308 Cost of Goods & Operations 8,174 12,698 50,307
Total Revenue 47,593 54,196 2,17,731
Staff Cost 1,373 3,987 9,242
Expenditure Total Revenue 47,593 54,196 2,17,731 Depreciation 274 220 1,192
Prog. & Operating Cost 23,918 23,658 98,097 Admin. & Other Expenses 1,095 1,466 5,958
Less : Inter-segment Revenue - - - Selling & Dist. Expenses 4,251 4,764 19,428
Staff Cost 3,899 6,908 20,312
Depreciation 750 553 3,103 Total Expenditure 15,167 23,135 86,127
Admin. & Other Expenses 3,830 3,372 18,602 Net Revenue 47,593 54,196 2,17,731 Profit from Operations
Selling & Other Expenses 4,245 5,840 25,916 2. Segment EBITA Before Other Income,
Finance Cost and
Total Expenditure 36,642 40,331 1,66,030 a. Content & Broadcasting 11,722 12,448 46,706
Exceptional Items 8,726 10,197 34,897
Operating Profit 10,951 13,865 51,701 b. Education (6) 22 (165) Interest / Other Income 2,772 2,602 10,509
Interest / Other Income 3,251 2,780 15,722 c. Film Prod. and Dist. (541) 499 (1,141) Profit Before Finance Cost
and Exceptional Items 11,498 12,799 45,406
Profit before Finance Cost Finance Cost 667 1,705 7,787
and Exceptional Items 14,202 16,645 67,423 Total 11,175 12,969 45,400
Profit After Finance Cost but
Finance Cost 911 2,141 13,391 Less : Finance Cost 847 713 4,059 before Exceptional Items 10,831 11,094 37,619
Profit before Exceptional Items 13,291 14,504 54,032 Less : Exceptional Item - - (258) Exceptional Items (Excess
Less : Exceptional Item Excess Provision for diminution in
Add : Interest Income 2,963 2,248 12,691
Provision for diminution in Value of Value of Investment written back) - - (258)
Profit Before Tax (PBT) 13,291 14,504 54,290 Profit Before Tax 10,831 11,094 37,877
Investment written back - - (258)
Less : Provision for tax,(incl. prev. yrs) 3,704 3,735 13,244
Profit Before Tax 13,291 14,504 54,290 3. Segment Assets (Net) Add : Excess Provision for tax
Less : Provision for Tax 4,159 4,171 16,331 (earlier years) written back - 5,738 6,341
a. Content & Broadcasting 3,10,285 2,71,449 3,13,295
Add : Excess Provision for Tax
Net Profit After Tax 7,127 13,097 30,974
(earlier years) written back - 5,738 14,252 b. Education 1,328 744 5,978
Paid up Eq. Share Capital 4,340 4,340 4,340
Net Profit After Tax 9,132 16,071 52,211 c. Film Prod. and Dist. (1,873) 4,852 (1,308) Reserves (Excluding Revaluation reserve) - - 2,29,980
Minority Interest (1,058) 60 989 d. Others 35,422 28,476 32,118 Basic EPS before* 1.64 3.02 7.08
Basic EPS after* 1.64 3.02 7.14
NOTES : Diluted EPS before* 1.64 3.01 7.07
Diluted EPS after* 1.64 3.01 7.13
Public Shareholding
1) During the quarter, the Company has redeemed the Foreign Currency stand-alone financial results for the quarter ended June 30, 2009. No.of Equity Shares of
Re.1 each (in lacs) 2,539 2,539 2,539
Convertible Bonds (FCCBs) aggregating US $ 3.79 million and with this 5) Previous year figures have been reclassified/regrouped wherever Percentage of Shareholding 58.5 58.5 58.5
Promotors and Promotors
repayment, there are no outstanding as at the end of June 30, 2009. necessary. Group Shareholding
-Pledge / Encumbured
2) No investor grievance was pending as on April 1, 2009. The Company 6) The above results were reviewed by the Audit Committee on July 16, No.of Equity Shares of
Re.1 each (in lacs) 600 - 501
received 26 letters during the quarter, all of which were resolved and 2009 and approved by the Board of Directors as on that date. % of Share (As a % of the total
Shareholding of Promotor and
Promotor Group) 33.34% - 27.81%
none were lying unresolved as on June 30, 2009.
% of Shares (As a % of the total
Share capital of the Company 13.83% - 11.53%
3) Segment information has not been presented in the stand-alone financial For & on behalf of the Board - Non-Encumbured
No.of Equity Shares of
statements, as the Company has presented segmental information on Zee Entertainment Enterprises Limited Re.1 each (in lacs) 1,201 - 1300
% of Share (As a % of the total
the basis of the consolidated accounts (as permitted by Accounting sd/- Shareholding of Promotor and
Promotor Group) 66.66% - 72.19%
Standard 17) Place : Mumbai Punit Goenka % of Shares (As a % of the total
Share capital of the Company 27.67% - 29.97%
4) The Statutory Auditors have carried out a ‘Limited Review’ of the Date : July 16, 2009 Whole Time Director & CEO (*Exceptional Item)