Landsat 8 OLI (Operational Land Imager)
•Download as PPTX, PDF•
12 likes•4,234 views

This presentation comprises the landsat 8 operational land imager....

Recommended
More Related Content
What's hot
What's hot (20)
Viewers also liked
Viewers also liked (20)
Similar to Landsat 8 OLI (Operational Land Imager)
Similar to Landsat 8 OLI (Operational Land Imager) (20)
Recently uploaded
Recently uploaded (20)
Landsat 8 OLI (Operational Land Imager)
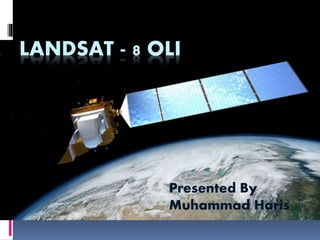
- 1. LANDSAT - 8 OLI Presented By Muhammad Haris
- 2. Overview Background Introduction Sensors: Operational Land Imager (OLI) Thermal Infrared Sensors (TIRS) Resolutions : Spatial Resolution Spectral Resolution Temporal Resolution Radiometric Resolution Comparison Sample Images
- 3. Background First Surveying Satellite (Landsat) The first Landsat satellite was called the Earth ResourcesTechnology Satellite, or ERTS. Since its launch on July 23, 1972, seven Landsats have followed, with the latest, Landsat 8, lifting off on February 11, 2013. Over the years successive Landsats have not only carried better land-viewing sensors, but they have created a valuable archive of images that are being used to see how the land is changing over the years. Landsat 8 carries Operational Land Imager (OPI) andThermal Infrared Sensor (TIRS) , which scans the Earth in Eleven bands of visible and invisible light
- 4. Introduction • Spacecraft: Landsat 8 • Carrier rocket: Atlas -V Rocket • Launch date: 11th February 2013 • Launch site: Vandenberg Air Force Base California • Orbit: Sun-synchronous orbit at an altitude of 705 km (438 mi) • Equatorial crossing time: 10:00 a.m. +/- 15 minutes
- 5. Introduction Continue The Landsat program offers the longest continuous global record of the Earth’s surface Joint operation between NASA and USGS Landsat 8 officially began normal operations on May 30, 2013 Landsat 8 has collected about 400 scenes of the Earth’s surface per day. Global coverage in 8 bands Swath width of Landsat 8 is 185km (115Miles)
- 6. Sensors The Landsat 8 satellite payload consists of two specific sensors; Operational Land Imager (OLI) Thermal Infrared Sensor (TIRS)
- 7. Operational Land Imager (OLI) OLI will collect images using nine spectral bands in different wavelengths of visible, near- infrared, and shortwave light to observe a 185 kilometer (115 mile) wide swath of the Earth in 15-30 meter resolution covering wide areas of the Earth's landscape while providing sufficient resolution to distinguish features like urban centers, farms, forests and other land uses.
- 8. Thermal Infrared Sensor (TIRS) TheThermal Infrared Sensor (TIRS) contains two thermal bands (10 and 11), which measure land surface temperature at 100-meter resolution. (The product provided is resampled and delivered as a 30- meter image). In theTIRS thermal bands, dark pixels represent cool temperatures; light pixels represent hot temperatures. Thermal band data provide important information about water irrigation use in arid land, as well as heat units in urban areas.
- 9. Resolutions Spatial Resolution Spectral Resolution Temporal Resolution Radiometric Resolution
- 10. Spatial Resolution 9 spectral = 30 meters for Bands 1 to 7 and 9. Band 8 (panchromatic) = 15 meters. Thermal bands 10 , 11 = 100 meters New band 1 (ultra-blue) is useful for coastal and aerosol studies. New band 9 is useful for cirrus cloud detection. 10 and 11 are useful in providing more accurate surface temperatures
- 11. Spectral Resolution Band Band Name Spectral range (nm) Use Of Data Resolution 1 New Deep Blue 433-453 Aerosol/ Coastal zone 30m 2 Blue 450-515 Pigments/scatter/Coastal 30m (TM heritage Bands) 3 Green 525-600 Pigments/Coastal 4 Red 630-680 Pigments/Coastal 5 NIR 845-885 Foliage/Coastal 6 SWIR2 1560-1660 Foliage 7 SWIR3 2100-2300 Minerals/Litter/no scatter 8 PAN 500-680 Image sharpening 15 m 9 SWIR 1360-1390 Cirrus Cloud Detection 30 m 10 TIRS1 10060- 11190 SurfaceTemperature 100*(30) 11 TIRS2 11500-12510 100*(30)
- 12. Temporal Resolution The entire Earth will fall within view once every 16 days. I does Mean that Temporal Resolution of Landsat 8 is 16 days. It complete its ! Successive round in 16 days
- 13. Radiometric Resolution Radiometric resolution of Landsat 8 is 16 Bits.
- 14. Landsat 8 Enhancement Landsat 8 images normally looks hazy before processing. Please have a look of Landsat 8 images of Inle Lake before and after processing.
- 15. Comparison with Landsat 7 The spectral bands (1 - 9) of the OLI sensor, while similar to Landsat 7’s ETM+ sensor, provide enhancement from prior Landsat instruments, with the addition of two new spectral bands: a deep blue visible channel (band 1) specifically designed for water resources and coastal zone investigation, and a new infrared channel (band 9) for the detection of cirrus clouds. A new QualityAssurance band is also included with each data product.This provides information on the presence of features such as clouds, water, and snow.
- 16. Comparison Continue Image of Landsat 7 ETM+ Image of Landsat 8 OLI
- 17. Sample Images 1. Natural Hazard Recovery Before After
- 18. 2.With Landsat 8's improved ability to detect variations in colors, the waters of Lake Ontario can show sediment patterns as well as potentially problematic algae, indicated by higher chlorophyll concentrations.
- 19. 3. his Landsat 8 satellite image of some southern Japanese islands includes Tanegashima (far right), from where the Global Precipitation Measurement, or GPM, mission's Core Observatory is scheduled to blast into orbit aboard a Japanese H-IIA rocket. This image was taken on April 13, 2013
- 20. 4. Forest Cover Loss
- 21. 5.Random Regions captured from landsat 8.
- 22. Thank You
- 23. References http://www.nasa.gov/content/goddard/lands at-eyes-japan-gpm-launch- site/#.VHHRCjTF_Xk http://landsat.usgs.gov/about_ldcm.php http://www.satimagingcorp.com/satellite- sensors/other-satellite-sensors/landsat-8/