
Empfohlen
Weitere ähnliche Inhalte
Was ist angesagt?
Was ist angesagt? (19)
Ähnlich wie Project
Ähnlich wie Project (20)
Kürzlich hochgeladen
Kürzlich hochgeladen (20)
Project
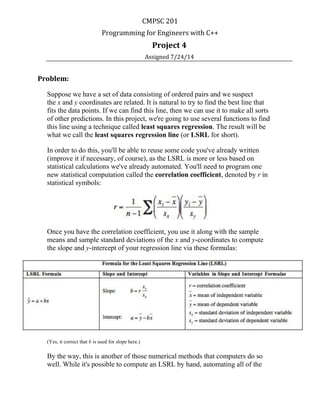
- 1. CMPSC 201 Programming for Engineers with C++ Project 4 Assigned 7/24/14 Problem: Suppose we have a set of data consisting of ordered pairs and we suspect the x and y coordinates are related. It is natural to try to find the best line that fits the data points. If we can find this line, then we can use it to make all sorts of other predictions. In this project, we're going to use several functions to find this line using a technique called least squares regression. The result will be what we call the least squares regression line (or LSRL for short). In order to do this, you'll be able to reuse some code you've already written (improve it if necessary, of course), as the LSRL is more or less based on statistical calculations we've already automated. You'll need to program one new statistical computation called the correlation coefficient, denoted by r in statistical symbols: Once you have the correlation coefficient, you use it along with the sample means and sample standard deviations of the x and y-coordinates to compute the slope and y-intercept of your regression line via these formulas: (Yes, it correct that b is used for slope here.) By the way, this is another of those numerical methods that computers do so well. While it's possible to compute an LSRL by hand, automating all of the
- 2. tedious calculations makes sense, and leaves us to spend our time interpreting our results in a practical context. Specifications: You may work with one other person in class on this project if you wish. If you wish to discuss the project with someone else, work with a partner. Otherwise, work alone. There is to be NO collaboration between individuals/groups who are not working as partners. In this project, you must read the x- and y-coordinate pairs in from a data file of unknown length. Each line in the file must contain both coordinates, separated by whitespace, as shown in the sample data file on Angel. In addition, you must use functions in this project, splitting the work up into smaller components and reinforcing your skills with parameter passing and arrays. You are required to create the following functions, and you must list them in this order above the main program (no prototypes, please!): Number (for Reference) Role Method's Objective Input Parameters Output Parameters Returned Values 1 Input To read the input file, line by line, and store the x- and y- coordinates in parallel arrays none an array of x- coordinates read from the file a parallel array of y- coordinates read from the file logical size of the arrays none 2 Process To compute the sample mean of a data set. (Note that this one was given as an example and you should, by all means, use it.) an array of data logical size of the array none the sample mean of the data in the array 3 Process To compute the sample standard deviation of a data set. (Reuse code! Consult Lab 8 for the formula.) an array of data logical size of the array the sample mean of the data none the sample standard deviation of the data in the array 4 Process To compute the correlation coefficient. an array of x- coordinates none the correlation coefficient of
- 3. read from the file a parallel array of y- coordinates read from the file logical size of the arrays the input arrays 5 Process To compute the least- squares regression line. an array of x- coordinates read from the file a parallel array of y- coordinates read from the file logical size of the arrays the y-intercept of the line the slope of the line none 6 Output To display a the mathematical representation of a line to screen the y-intercept of the line the slope of the line none none Be sure to comment each function well. You should list the preconditions and postconditions for each one (essentially what you assume about your inputs and what your outputs will reflect). You will also need a main program to drive this program. All computation should be done in the six methods; the main program should be extremely short. (I have fewer than a dozen lines of code.) Testing your program: This program will again be lengthy, so you should develop it incrementally, testing each new part as you go. Use cout statements in your debugging when needed to keep track of program flow and/or the value of variables. Sample test data files and corresponding correct output will be released shortly for you to test your program with. Your program should provide the output that looks something like this: Regression line: y = 1166.93 + -0.586788x It will have no user input, so no prompts are needed. Any debug statements should be commented out or removed before final submission. Your code should also contain enough comments to an outside observer to follow its logic. In your final
- 4. submission, your program should open a file named "project_4_data.txt," which can be assumed is in the same directory as the program. Submission: Upload your .cpp file from your project with the following filename (replacing "abc123" and "def456" with your Penn State user Ids): abc123_def456_project_4.cpp Both partners should submit a copy of the program in their Angel account. In a comment block at the top of your cpp file, please be sure to include the following information: Name(s), Project number, Date assigned, Date due, Description of program, Expected inputs, Expected outputs Due date: Submit by 11:55 PM on 8/8/14. After this time, the dropbox will no longer be available. 10 bonus points will be awarded if submitted by 8/5/14.