1. UNIT 4: GEOGRAPHICAL RESEARCH
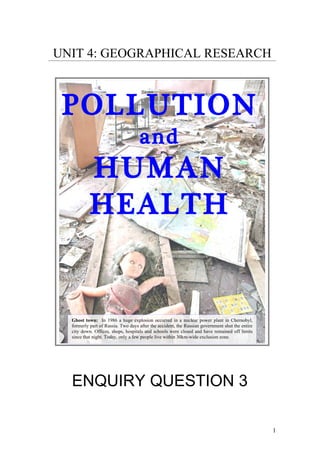
POLLUTION
and
HUMAN
HEALTH
Ghost town: In 1986 a huge explosion occurred in a nuclear power plant in Chernobyl,
formerly part of Russia. Two days after the accident, the Russian government shut the entire
city down. Offices, shops, hospitals and schools were closed and have remained off limits
since that night. Today, only a few people live within 30km-wide exclusion zone.
ENQUIRY QUESTION 3
1
2. THE COMPLEX CAUSES OF HEALTH RISK
The link between different pollution types and the health
of societies – Research the different types and sources of pollution
and the direct threats and effects on health, as well as indirect
effects to any society economically.
The relative health risks associated with incidental and
sustained pollution – Weigh up the difference to any society’s
health between one-off incidents such as Bhopal, Chernobyl and
Harbin; and longer-term sustained pollution such as ozone pollution
and skin cancer, and global warming and malaria spread.
The relationship between pollution, economic
development and changing health risks – Examine how types
and amounts of pollution change with economic development and
how, for example, the Kuznets curve and epidemiological models
can assist in explaining these factors.
The role of pollution fatigue in reducing health risk –
Investigate the link between pollution fatigue and the backlash from
the public to pressurise for effective management.
2
3. ENQUIRY QUESTION 3:
WHAT IS THE LINK BETWEEN HEALTH RISK
AND POLLUTION?
SPECIFICATION
Many environmental commentators in the media described the Sydney dust
storms in September 2009 as an unusual example of “air pollution”.
3
4. A good reading to begin: An article from the BBC looking at pollution hotspots around the
world. Be aware that the article does not include major recent events (eg. Harbin, China) as it
was written back in 2004.
http://news.bbc.co.uk/1/hi/sci/tech/4083331.stm
Define ‘pollution’:
Does the pollutant necessarily have to be directly man-made?
Does your definition therefore encompass the example of the Sydney dust storms?
http://www.youtube.com/watch?v=5l7C_KZ0n4A
4
5. Identify some of the world’s pollution hotspots (also known as pollution clusters) on the map below. Name and shame!
- BBC (2004): http://news.bbc.co.uk/1/hi/sci/tech/4083331.stm
- Time Magazine and the Blacksmith Institute:
http://www.time.com/time/specials/2007/article/0,28804,1661031_1661028,00.html
- The text book’s map is also based on the same information from the Blacksmith Institute (Dunn et al., 2009).
5
7. List some of the industrial threats discussed in the article on the previous page:
• Groundwater contamination
•
•
•
•
•
•
On the following pages, complete the tables by carrying out your own research on the world’s
major pollutants. These tables will enable you to link types of pollution with certain health
risks and supporting case studies. The skill here is in the mote-making. Eacl cell should have
somewhere between one and five bullet-points, each of which should be a concise sentence.
After completing the written work, look to add an image, diagram or graph beneath the table.
The best reading for most of the pollutants is from Wikipedia (www.wikpedia.org). Remember
your referencing!
7
8. NITROUS OXIDES (eg. nitrous oxide)
Source (Where • Point-based or
is it produced?) diffuse?
Health risk •
(How does it
harm humans?)
Examples of • The scale of the impact:
locations/case household, community
studies or global scale?
Graph showing change in changes in
atmospheric nitrous oxide over the last
2,000 years.
http://www.geology.iastate.edu/gccourse/chem/nitro/nitroim
ages/graph.jpg
The biggest source of oxides of
nitrogen is transport. Cars such
as those in Mexico (left)
produce millions of tons of
nitrogen oxides every day.
8
9. Needed in the
upper
atmosphere but
poisonous to
humans.
OZONE
Source (Where • Point-based or
is it produced?) diffuse?
Health risk •
(How does it
harm humans?)
Examples of • The scale of the impact:
locations/case household, community
studies or global scale?
This red alder leaf has been discoloured by ozone.
9
10. CHORO-FLURO-CARBONS (CFCs)
Source (Where • Point-based or
diffuse? All of
is it produced?)
these
Health risk • CFCs pose an indirect threat to human health. tables
(How does it • expand
harm humans?) on
Examples of • The scale of the impact: your
locations/case household, community work
studies or global scale? from
pg.9 in
the
Since the Montreal
Protocol, the use of
CFC-producing aerosols
has been outlawed.
10
11. LEAD (and other HEAVY METALS)
Source (Where • Point-based or
is it produced?) diffuse?
Health risk •
(How does it
harm humans?)
Examples of • The scale of the impact:
locations/case household, community
studies or global scale?
Washington residents had their water contaminated with lead in 2005.
11
12. PERSISTENT ORGANIC POLLUTANTS (eg. DDT)
Source (Where • Point-based or
is it produced?) diffuse?
Health risk •
(How does it
harm humans?)
Examples of • The scale of the impact:
locations/case household, community
studies or global scale?
POPs tend to migrate to areas of
low temperatures. They are
therefore becoming highly
concentrated in the Arctic. The
chemicals build up within the
food chain and can present health
problems for all species.
12
13. WATER POLLUTION (eg. fertilisers, waste)
Source (Where • Point-based or
is it produced?) diffuse?
Health risk •
(How does it
harm humans?)
Examples of • ‘Dead Zone’, Gulf of Mexico. The scale of the impact:
locations/case • The Aral Sea, Kazakhstan and household, community
studies Uzbekistan. or global scale?
•
This was the incredible
sight of the Olympic
sailing harbour in the
lead-up to the 2008
Beijing Olympics
(China). The green
colour in the water is a
bloom of algae,
produced when nutrient
levels in the water
become too high.
13
14. OTHER:
Source (Where • Point-based or
is it produced?) diffuse?
Health risk •
(How does it
harm humans?)
Examples of • The scale of the impact:
locations/case household, community
studies or global scale?
14
15. Classify the above types of pollution into the table below:
Atmospheric Hydrospheric Terrestrial
From what you have learnt in the tables above, how can pollution also impact indirectly on a
society’s economy?
It will also be
worthwhile
coming back to
this question
later on. It takes
a bit of thought.
Should I use my
knowledge of case
studies to support my
answer even though
the question hasn’t
told me to do so?
15
16. SPECIFICATION
Incidental pollution
Use bullet-points to summarise what happened in some major one-off incidents of pollution.
See if you can add a photograph for each.
1. Bhopal, India; 1984
http://news.bbc.co.uk/1/hi/sci/tech/7961062.stm
Place
Where did it happen?
People
Who caused it? Who was affected and how?
Power
What, if any, action has been taken to stop the pollution? Who will decide on the changes that
need to be put in place?
The Bhopal gas leak
caused thousands of
The first people to suffer from
three respiratory conditions
case and eye injuries. In
studies many ways, they were
are the lucky ones.
straight Thousands died
from the instantly and many
spec and more died in the
are also ensuing months.
covered
in the
text from
pg. 366.
16
17. 2. Chernobyl, former Soviet Union; 1986
http://ngm.nationalgeographic.com/2006/04/inside-chernobyl/stone-text
Place
Where did it happen?
People
Who caused it? Who was affected and how?
Power
What, if any, action has been taken to stop the pollution? Who will decide on the changes that
need to be put in place?
17
18. 3. Harbin, China; 2005
http://news.bbc.co.uk/1/hi/world/asia-pacific/4462760.stm
Place
Where did it happen?
People
Who caused it? Who was affected and how?
Power
What, if any, action has been taken to stop the pollution? Who will decide on the changes that
need to be put in place?
People from the major
Chinese city of Harbin
went for days without
clean water supplies when
a petrochemical spill
entered the city’s main
river in 2005.
18
19. 4. Exxon Valdez oil spill, Alaska; 1989
http://news.bbc.co.uk/onthisday/hi/dates/stories/march/24/newsid_4231000/4231971.stm
Place
Where did it happen?
People
Who caused it? Who was affected and how?
Power
What, if any, action has been taken to stop the pollution? Who will decide on the changes that
need to be put in place?
The Exxon Valdez oil spill of 1989 was the biggest of its time. The clean-up took
weeks of work from hundreds of environmental engineers and volunteers.
19
20. 5. Water pollution at Camelford, Cornwall; 1989
http://www.guardian.co.uk/uk/1989/jun/14/2
Place
Where did it happen?
People
Who caused it? Who was affected and how?
Power
What, if any, action has been taken to stop the pollution? Who will decide on the changes that
need to be put in place?
20
21. 6. Toxic waste dumping, Ivory Coast; 2006
http://www.abc.net.au/news/video/2009/09/21/2692446.htm
http://news.bbc.co.uk/1/hi/world/africa/7685561.stm
Place
Where did it happen?
People
Who caused it? Who was affected and how?
Power
What, if any, action has been taken to stop the pollution? Who will decide on the changes that
need to be put in place?
Thousands of locals in the West
African country of Ivory Coast
were severely injured when an
ocean tanker dumped toxic waste
along the country’s coastline in
2006. Emails written by
employees at the company
responsible showed that the
dumping was not accidental and
that it may have been pre-
meditated.
21
22. 7. The Great Smog, London; 1952. http://news.bbc.co.uk/1/hi/england/2545759.stm
Place
Where did it happen?
People
Who caused it? Who was affected and how?
Power
What, if any, action has been taken to stop the pollution? Who will decide on the changes that
need to be put in place?
The Great Smog ofLondon was the
worst case of air pollution ever
seen in Britain. It caused a major
re-think of environmental policy.
22
23. 8. Your own example.
Place
Where did it happen?
People
Who caused it? Who was affected and how?
Power
What, if any, action has been taken to stop the pollution? Who will decide on the changes that
need to be put in place?
23
24. Of the incidental pollution events you have studied on these previous pages, which caused the
biggest impact to health in the surrounding area? Make your judgement based on both health-
related and economic impacts. Also remember to consider both the short-term and long-term.
Requires you to use information to put
forward your opinion.
Get used to it!
Write this answer over two substantial
paragraphs.
24
25. Sustained pollution
1. Consider an example of sustained pollution and its health effects: the link between
greenhouse gas emissions and malaria.
Referring to the diagram, explain the link between increased greenhouse gas emissions and
global warming.
Explain the link between global warming and the spread of malaria.
Malaria mostly occurs in tropical LEDCs. How does malaria also affect MEDCs?
25
26. 2. Consider another example of sustained pollution. Persistent organic pollutants
(POPs) are presenting dangerous risks for the health of Arctic ecosystems.
POP goes the Arctic
The Arctic has a severe problem with persistent organic pollutants (POPs). POPs are chemical
substances which accumulate in the food chain, threatening both human and animal health as
well as the environment.
According to researchers, dangerous levels of POPs have been found in the Arctic's air, snow,
water and wildlife. It is thought that POPs, like the pesticide DDT, are carried on air currents
from the mid-latitudes of North America, Europe and Asia.
Once they reach the Arctic, the harsh climate causes them to freeze into the snow and ice, where
they accumulate and concentrate up the food chain. Although the Arctic might seem like a
pristine and remote environment, its severe cold actually encourages POPs to enter the system.
These pollutants can harm many animals, especially those higher up the food chain. According to
some researchers, they may be weakening the immune function of mammals like polar bears as
well as causing reproductive problems.
From:
http://news.bbc.co.uk/1/hi/sci/tech/4083331.stm
Explain why this is an example of sustained pollution and not incidental pollution:
26
27. 3. Consider another example of sustained pollution and its health effects: the link
between CFCs and skin cancer rates.
Here we are
talking
about ozone
in the upper
atmosphere
rather than
at ground
level.
From: http://www.theozonehole.com/images/atmosphere-couche.jpg
Using the diagram above, explain the link between CFCs and the hole in the ozone layer.
When was the link between the ozone layer and skin cancer first proved?
27
28. Where and by whom is the effect mostly felt? http://www.theozonehole.com/consequences.htm
28
29. 4. A further example of sustained pollution is the ‘Dead Zone’ in the Gulf of Mexico.
The map indicates areas of high and low
oxygen concentration in the water of the
Gulf of Mexico. Red indicates low
concentration, yellow and green indicates
medium concentration and blue is higher
concentration.
From the Discovery Channel: http://dsc.discovery.com/news/2006/10/20/deadzone_pla_zoom0.html?category=animals&guid=20061020143030
What is the Dead Zone?
Describe the overall pattern shown.
What is the source of pollution causing this event?
What is the pathway taken by the pollutants?
Describe the associated health risks for humans.
The Gulf of Mexico is not the only sink for these types of chemicals. Name two other sinks that
are suffering from agricultural run-off and sewage around the world.
1
2
29
30. 5. A final example of sustained pollution: lead pollution into the water system of
Washington DC. The pollution began occurring around 2001 and the levels remained at
an unhealthy level for several years subsequently. This case has already appeared in the
EQ2 booklet.
http://en.wikipedia.org/wiki/Lead_contamination_in_Washington,_D.C._drinking_wate
r
How did Washington residents first find out about the case?
What makes this a case of sustained pollution?
How did the Washington DC Water and Sewage Association (WASA) cause the pollution?
What are the impacts to health of lead poisoning?
30
31. 6. Consider the example of James Hardie and asbestos mining in the Pilbara, Western
Australia. (CWi booklet)
What is asbestos used for?
Point the arrow toward the Pilbara region to show the location of the pollution source.
What are the health effects of asbestos poisoning?
How was the pollution managed?
31
32. Stuck? The best examples are ones from
your previous booklets. For example, water
Your own example of sustained pollution: pollution and cholera in Zimbabwe.
Place
Where is it happening?
People
Who caused it? Who is being affected and how?
Power
What, if any, action has been taken to stop the pollution? Who will decide on the changes that
need to be put in place?
32
33. Sustained pollution tends to be transboundary in nature. Discuss.
The specification asks you to: “Weigh up the difference to a society’s health between one-off incidents and longer-
term sustained pollution”. This table will help you to do so. To complete the table, you should use you research on
the previous pages. You can then use the table to formulate a response beneath the table.
Incidental Pollution Sustained Pollution
Eg: CHERNOBYL Eg: CLIMATE CHANGE
• •
Types of
diseases/condition
s
• •
Estimate of
numbers affected
• •
Approximate
mortality rates
• •
Estimated deaths
33
34. SPECIFICATION
How would you expect pollution levels to change as a country becomes more developed?
On the graph below, add an arrow to show the linear trend that you would expect.
Change in pollution/environmental degradation
with increasing development
DEG
RAD
AT
I
O
N
Click on the arrow
to place it on to
the graph. You
can stretch it and
change its angle.
Income (per capita)
Describe the relationship you predicted above.
34
35. I don’t have an opinion!
Just tell me the answer!
The Environmental Kuznets Curve (1955)
Can you label where
the UK, China and
an LEDC would be
on the curve?
35
36. … And practise yourself (by hand):
Describe and explain the pattern shown by the Environmental Kuznets Curve (EKC).
In fact, this was not Simon Kuznets’ focus in 1955? He first used the curve to show another
relationship (the Kuznets curve). What was the relationship he was initially trying to show?
IMPORTANT POINT: It was Grossman and Krueger (1991)
who used Kuznets’ 1955 curve to demonstrate the relationship between
income and environmental degradation.
36
37. How does the United Kingdom’s greenhouse emissions match what is expected by the EKC?
http://www.guardian.co.uk/environment/2008/jan/31/climatechange.carbonemissions1
Will China’s growth follow the EKC?
http://www.perc.org/pdf/china_enviro_kuznets.pdf (Hayward, 2005)
A big article. You may prefer to skim read parts of it. The reading will benefit you because it is written
by academics and refers extensively to previous literature. It is one of the few scholarly articles that have
been set for reading in the research booklets, and in this sense, you should make an effort to do it
properly. Note also the references to the Songhua (the river that runs through Harbin) throughout the
article and to Chernobyl at the end of the article.
Changing pollution levels in the
emerging superpower of China is
a favourite example of pollution
scientists. Beijing (left) had a
major problem with air pollution
in the lead-up to the 2008
Olympics.
37
38. How does Omran’s epidemiological transition model (1971) correlate with the same curve
above? Describe the level of pollution one would expect in each of the four stages of the model.
1 The Age of Pestilence and Famine
2 The Age of Receding Pandemics (early phase)
3 The Age of Receding Pandemics (late phase)
4 The Age of Man-made and Degenerative Diseases
38
39. The Kuznets curve and Omran’s epidemiological model essentially predict the same trends for
pollution levels.
True/False
Critics argue that the EKC is not statistically robust, that it does not apply to the full
range of environmental impacts, and that it does not account for displacement effects,
i.e., the “race to the bottom” whereby richer nations outsource their environmental
harmful production functions to poorer nations with weaker environmental controls,
resulting in net increases in global pollution.
Defenders of the EKC argue optimistically that the EKC is actually dropping and
shifting to the left, meaning that the environmental turning point will be reached
sooner in the developing world than in today’s wealthy nations. Developing nations, it
is thought, will skip over some of the stages of growth and pollution by adopting
cleaner technologies earlier and developing regulatory institutions to control
pollution.
From Hayward, 2005 (again): http://www.perc.org/pdf/china_enviro_kuznets.pdf
Do most MEDC’s pollution patterns correlate with the EKC? Explain with evidence from
above and from your own reading. You should define and refer to the precautionary principle
in your answer.
Here is a great
question to
practise the
skill of
evaluation
(needed for top
level answers).
In order to do
this you need
to show an
appreciation
for different
values and
perspectives
about the EKC.
39
40. A flow chart describing expected change over time for communities. This flow chart is a combination of
both Omran’s model and the Environmental Kusnets’ Curve (EKC):
EKC Omran’s Model
According to Omran’s model, all
countries start off in an age of
disease and famine. In this stage,
economic and technological
development are low, reinforcing a
low quality of life.
A peak in environmental
degradation is reached. This is
represented as the turning point in
the EKC.
40
41. SPECIFICATION
This concept lacks Internet resources. Look elsewhere!
Pollution fatigue
What do you think ‘pollution fatigue’ means?
According to Dunn et al, 2009, pollution fatigue consists of two main groups of people.
Explain.
1.
2.
There’s that
idea of spatial
Where and when do you think pollution fatigue most affects people? and temporal
variation again.
List some populations suffering from pollution fatigue in your research so far. Summarise each
instance in a sentence.
1.
2.
3.
4.
5.
6.
7.
8.
9.
10.
41
42. Which stakeholders would take an interest in a debate over the management of pollution
fatigue? Make a list. For each one, say briefly why they would have an interest.
How does cyber-activism help to address pollution fatigue? Check out the website of the
Blacksmith Institute, a body that consults and lobbies on behalf of ‘fatigued’ communities.
www.blacksmithinstitute.org
Residents form Harbin (China) were
forced to stock up on water and fluids
when the government announced that
water supplies would be cut for days
following the toxic spill into the
Songhua River.
42
43. Key terms
Atmospheric (pollution):
Feel free
Cluster: to add
your
Cyber-activism: own!
Dead Zone:
Diffuse:
Environmental Kuznets Curve (EKC):
Hydrospheric:
Incidental (pollution):
Pathway:
Point-based:
Pollutant:
Pollution fatigue:
Pollution hotspot:
Persistent organic pollutants (POPs):
Precautionary principle:
Quality of Life Years (QALY):
Sink:
Source:
Sustained (pollution):
Terrestrial (pollution):
Transboundary:
43