
Empfohlen
Weitere ähnliche Inhalte
Was ist angesagt?
Was ist angesagt? (20)
Ähnlich wie Grade 9, U3-L3 Food Chains and Food Webs
Ähnlich wie Grade 9, U3-L3 Food Chains and Food Webs (20)
Mehr von gruszecki1
Mehr von gruszecki1 (20)
Kürzlich hochgeladen
Kürzlich hochgeladen (20)
Grade 9, U3-L3 Food Chains and Food Webs
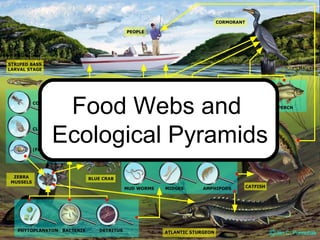
- 1. Food Webs and Ecological Pyramids
- 2. Every species interacts with other species and with its environment in a unique way.
- 3. These interactions define the ecological niche of a species - the role of a species within an ecosystem.
- 4. Ecological NicheEcological Niche For example, the ecological niche of a black bear is as follows: – black bears feed on nuts and berries as well as insects and other small animals – bears carry seeds over long distances in their digestive systems before they are expelled and germinate
- 5. Ecological NicheEcological Niche For example, the ecological niche of a black bear is as follows: – bears hibernate during the winter – they have few predators, but are fed on by blood-sucking insects and other parasites
- 6. A key feature of any ecosystem is the feeding roles of each species. We have already distinguished between producers and consumers, however consumers can be further subdivided depending on what types of organisms they eat. Ecological NicheEcological Niche
- 7. Feeding Role Definition herbivore animal that eats plants or other producers carnivore animal that eats other animals omnivore animal that eats both plants and animals scavenger animal that feeds on the remains of another organism Ecological NicheEcological Niche
- 8. The most common interactions between species are through feeding relationships.
- 9. The easiest way to display these relationships is with food chains. Food chains illustrate who eats whom in an ecosystem. Food ChainsFood Chains
- 10. Food chains show how energy passes through an ecosystem. Energy is continually lost from all levels of the food chain. Food ChainsFood Chains
- 11. Ecologists refer to the trophic level, or feeding level, to describe the position of an organism along a food chain. Trophic LevelsTrophic Levels Tertiary consumers (carnivores) Secondary consumers (carnivores or omnivores) Primary consumers (herbivores) Primary producers 1st Trophic Level 2nd Trophic Level 3rd Trophic Level 4th Trophic Level
- 12. Producers occupy the lowest, or first, trophic level. Herbivores occupy the second trophic level, and carnivores occupy the third and fourth trophic levels. Trophic LevelsTrophic Levels Tertiary consumers (carnivores) Secondary consumers (carnivores or omnivores) Primary consumers (herbivores) Primary producers 1st Trophic Level 2nd Trophic Level 3rd Trophic Level 4th Trophic Level
- 13. Food chains do not exist in nature. They are only used to show simple feeding relationships. Food chains are part of more complex sets of relationships that exist among species. Food WebsFood Webs
- 14. A more accurate, but still incomplete, way to illustrate interactions is with a food web. A food web shows a series of interconnecting food chains. Food WebsFood Webs
- 15. Food webs are highly complex, with consumers feeding on many different species. The large number of interactions tends to reduce the vulnerability of any one species to the loss or decline of another species. Food WebsFood Webs
- 16. Food webs are useful tools to figure out what may happen when a species is removed from or added to an ecosystem. Food WebsFood Webs
- 17. For example, if a species is removed from a food web, the species it feeds on may increase dramatically in numbers.
- 18. Conversely, the population of a newly introduced species may disrupt the entire food chain. Food WebsFood Webs For this reason, complex food webs are thought to be more stable than simple food webs.
- 19. Before
- 20. After
- 21. Another way ecologists illustrate how ecosystems function is through ecological pyramids. Ecological PyramidsEcological Pyramids
- 22. Ecological pyramids display relationships between trophic levels in an ecosystem. Ecological PyramidsEcological Pyramids
- 23. The three types of ecological pyramids are energy, numbers and biomass. Ecological PyramidsEcological Pyramids energy pyramid pyramid of numbers pyramid of biomass
- 24. The size of each layer in the energy pyramid represents the amount of energy available at that trophic level. Energy PyramidsEnergy Pyramids An energy pyramid illustrates energy loss and transfer between trophic levels.
- 25. Only about 10% of the energy taken in by the individuals at one trophic level is passed on to individuals at the next trophic level. Energy PyramidsEnergy Pyramids 1000 kJ 100 kJ 10 kJ
- 26. Species in the highest trophic levels have less energy available to them than species near the bottom. Energy PyramidsEnergy Pyramids This often results in their populations being much smaller than species lower in the food chain (i.e. an ecosystem will have fewer predators than herbivores).
- 27. Biomass is the total mass of all living organisms in a given area. A pyramid of biomass shows the total mass of organisms in each trophic level. Pyramid of BiomassPyramid of Biomass
- 28. A pyramid of numbers shows the number of individuals of all populations in each trophic level. Pyramid of NumbersPyramid of Numbers