Bajaj Allianz Life Insurance Company - Insurer Innovation Award 2024
Habib-IGARSS 2011 FR3-TR10.pptx
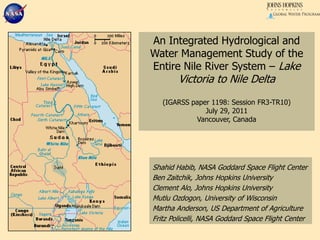
1. An Integrated Hydrological and Water Management Study of the Entire Nile River System – Lake Victoria to Nile Delta(IGARSS paper 1198: Session FR3-TR10)July 29, 2011Vancouver, Canada Shahid Habib, NASA Goddard Space Flight Center Ben Zaitchik, Johns Hopkins University Clement Alo, Johns Hopkins University MutluOzdogon, University of Wisconsin Martha Anderson, US Department of Agriculture Fritz Policelli, NASA Goddard Space Flight Center
2.
3. NASA observations and tools can provide consistent, reliable estimates of hydrological states and fluxes, even in remote areas. This information can be applied to early warning systems and decision support.
4.
5. The Nile Basin 3.35 million km2 6,650 km long Lower Nile Atbara Bahr el-Ghazal Sudd Blue Nile Sobat White Nile The Lakes
6. The Nile Basin 3.35 million km2 6,650 km long Climates range from humid tropical to hyper-arid
7. The Nile Basin 3.35 million km2 6,650 km long Climates range from humid tropical to hyper-arid The vast majority or precipitation falls in the Ethiopian and Lake Victoria headwaters regions
8. The Nile Basin Annual flow at Aswan: 84 BCM 86% Ethiopia; 14% Equatorial Lakes Large seasonal variability in the Blue Nile and Atbara Interannual variability can affect both the Blue and the White Nile July 8, 2011 Choke Mountain gorge July 10, 2011 Bottom of Tissisat falls
9. The Nile Basin Lower Nile night view from satellite 190 million people 50% below the poverty line 10 nations 8 are defined as Least Developed Countries 4 are nationally water scarce today 6 are predicted to be water scarce by 2025 7 have experienced war in the past 20 years At present, there is no water sharing agreement or joint management plan
11. NASA’s Project Nile Goal:improved hydrometeorological information for research, planning, and water management Evapotraspiration Land Cover Mapping Components: Customized Land Data Assimilation System Land cover mapping and simulation Satellite-derived evapotranspiration Integration to Decision Support LDAS Decision Support System
12. LDAS Output Land Surface Model A Land Data Assimilation System (LDAS) is a computational system that merges observations with numerical models to produce optimal estimates of land surface states and fluxes. Update Observations Landscape Information Meteorological Data SM ET Runoff
13. LDAS Early Results - 2001-2009 climatology (Using Noah Land Surface Model) Precipitation input: Rain Fall Estimate at 10 km-3 hourly, WMO Stations Evapotranspiration at 5 km resolution Precipitation – Evapotranspiration = Surface and Subsurface runoff -5 km
14. LDAS Early ResultsUsing last 30 years (1980-2010) ENSO data El Nino years 4 months precipitation- Jun, Jul, Aug, & Sep La Nina years 4 months precipitation- Jun, Jul, Aug, & Sep Warmer years produce less precipitation over E. Africa Cooler years produce more precipitation over E. Africa C. Alo, JHU
15. Land Cover Mapping A Nested Approach: Continental scale maps (from MODIS) with general land cover categories (used for deriving the model) Usedfor landscape scale sampling Regional maps (from Landsat - agriculture) with detailed land use categories 1:25,000 scale Detailed description of the land cover Local scale mapping (commercial) For detailed analyses and true area estimation M. Ozdogan, Univ. of Wisconsin
16. MODIS-based regional map(VIS to 2.4 micron – reflected domain)Friedlet.al., 1999 IEEE TGARS Collect one year of 8-day composited MODIS surface reflectance data Identify representative temporal profiles for general land cover classes Apply an automated Decision Tree algorithm (using band comparison) to classify each pixel Use this map as a guide for sampling the landscape for detailed analyses Root Data Internal nodes Decision criteria Final classified label Leaf nodes M. Ozdogan, Univ. of Wisconsin
17. forest shrubland grassland agriculture barren Yearly product based on MODIS 8-day composite at continental scale - 2005 M. Ozdogan, Univ. of Wisconsin
19. Landsat – 30M Scale - 2005 Topographic view Winter - December Choke Mountain Caldera Shrubs Agriculture Clouds MODIS Landsat Forest Northern Ethiopia heterogeneous landscape requires high resolution imagery Commercial with 0.5 m resolution Spring, Summer, Fall and Winter averaged
20. SURFACE TEMPERATURE Tsoil & Tveg transpiration & evaporation Tveg TSoil soil evaporation Given known radiative energy inputs, how much water loss is required to keep the soil and vegetation at the observed temperatures? Satellite-derived Evapotranspiration M. Anderson, USDA
21. ET: The Atmosphere-Land Exchange Inverse (ALEXI) Model (Atmospheric Boundary Layer) Sensible Heat: (from Landsat thermal band 100m) Canopy Heat: Landscape scale TRAD - TM, ASTER, MODIS fc - TM, ASTER, MODIS Regional scale ΔTRAD - Geostationary fc - MODIS (vegetation cover function) Surface temp: Cover fraction:
22. Early Results: clear-sky ET composites (2008) (~ 6 km resolution) June July Wm-2 M. Anderson, USDA
23. 2009 FEBRUARY Note ET from Sudd and Nile Delta in ALEXI, not captured in LDAS. Average ALEXI ET Average LDAS ET (MJ m-2 d-1)
29. Summary Many researchers have studied this region over the last three decades NASA is taking another integrated look at the entire region using satellite observations and multitude of land surface/hydrological models The most significant aspect of this work is to validate using in situ measurements and depends on the regional partners willingness to share in situ data As a starting point, we are working with Ethiopian hydrology and Meteorology offices to get such data for the Blue Nile head waters We also plan to simulate future climate impact on hydrology using IPCC scenarios Our work will be published on a scientific basis Ancient map drawn by Ptolemy
Editor's Notes
Location of Landsat footprint
Landsat data from winter 2005
Note ET from Sudd and Nile Delta in ALEXI, not captured in LDAS.
Note ET from Sudd and Nile Delta in ALEXI, not captured in LDAS.
![Introduction ,[object Object]](data:image/gif;base64,R0lGODlhAQABAIAAAAAAAP///yH5BAEAAAAALAAAAAABAAEAAAIBRAA7)