Durg CALL GIRL ❤ 82729*64427❤ CALL GIRLS IN durg ESCORTS
Credicorp capital . mila chile .company report - habitat - hold - credicorp capital (1)
1. Christopher DiSalvatore
(56 2) 2446 1724 cdisalvatore@credicorpcapital.com
Francisca Manuschevich
(56 2) 2446 1798, fmanuschevich@credicorpcapital.com
Habitat: HOLD
Uncertain regulatory & cost headwinds threaten positive trend
After updating our projections and tweaking our model, we have arrived to a new Y.E. 2013 target price of $ 947 and maintain our
HOLD recommendation for shares. Our T.P. implies an upside including dividends of 6.6%. Our recommendation is founded on the
company’s exposure to stable cash flows positively influenced by the strong macro environment in Chile and Peru (low
unemployment levels & salary growth), accretive operational returns, and a new growth opportunity in Peru. On a relative basis,
Habitat trades at a recurring P/E 14.8x in 2013 e and 13.9x in 2014, which remains in line with global peers (14.8x and 13.2x) despite
running up 38% (LTM) after recent M&A activity within the sector. While we believe Habitat should continue to benefit from the
domestically driven growth within Chile and Peru (+5.2% & +7.8%, respective based on Credicorp Capital estimates), we still see likely
changes in the regulatory environment as a potential risk to current valuation levels, which is not reflected in current valuation levels.
June 10th, 2013
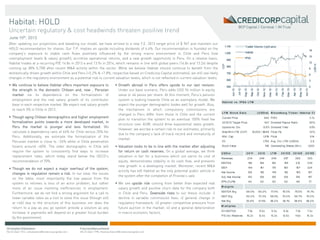
LTM St ock Dat a ( USDm) Bloomberg Ticker: Habit at CI
Current Price 940 P/BV 3.7x
2013YE Target Price 947 Dividend Payout Ratio 90%
Upside Inc. Div. 6.6% Dividend Yield 5.5%
M áx/M in LTM (CLP) $1,000 / $649 Float (%) 32%
M kt. Cap. 1,918 Float 614
EV 1,794 Avg. Vol. LTM (USDm) 2.6
Book Value 516 Outstanding Shares (M n.) 1,000
Habit at vs. IPSA LTM
U SD m 2 0 11 2 0 12 LTM 2 0 13 E 2 0 14 E 2 0 15E
Revenues 234 248 248 257 282 320
EBITDA 159 199 192 195 212 239
EBIT 145 181 170 180 197 224
Net Income 126 152 145 152 165 187
Adj. Net Income 130 126 126 128 139 157
EPS (CLP$) 64 62 62 62 68 77
M argins
EBITDA M g. 68.0% 80.2% 77.4% 76.0% 75.0% 74.7%
EBIT M g. 62.2% 73.3% 68.5% 70.4% 69.7% 70.0%
Net M g. 53.9% 61.5% 58.2% 59.1% 58.6% 58.2%
M ult iples
EV/EBITDA 7.5x 9.0x 9.3x 8.5x 7.5x 7.2x
P/E incl. Reserves 10.2x 12.4x 13.3x 12.6x 11.6x 10.3x
We continue to believe Habitat offers important exposure to
the strength in the domestic Chilean and, now , Peruvian
market via its dependence on the formalization of
employment and the real salary growth of its contributor
base in each respective market. We expect real salary growth
to reach 3% in Chile in 2013.
Though aging Chilean demographics and higher employment
formalization points towards a more developed market, in
Peru the market is younger and less formalized. We
calculate a dependency ratio of 46% for Chile versus 35% for
Peru. Additionally, we estimate the formalization of the
Peruvian market is close to ~24% while in Chile penetration
hovers around ~60%. The older demographic in Chile will
require the system to consistently find ways to increase
replacement rates, which today stand below the OECD’s
recommendation of 70%.
Though we do not expect a major overhaul of the system,
changes in regulation remain a risk. In our view, the issues
on the table, most importantly the low payout from the
system to retirees is less of an actor problem, but rather
more of an issue involving inefficiencies in employment.
Furthermore, we do not find a strong argument for a call to
lower variable rates as a tool to solve this issue (though still
at risk) due to the structure of this business nor does the
return to a pay as you go system provide a solution as any
increase in payments will depend on a greater fiscal burden
by the government.
Growth abroad in Peru offers upside to our last revision.
Under our base scenario, Peru adds USD 94 million in equity
value or 46 pesos per share. At this moment, Peru’s pension
system is looking towards Chile as an exemplary model. We
expect the younger demographic bodes well for growth. Also,
the mechanism in which compulsory commissions are
charged in Peru differ from those in Chile and the current
plan to transition the system to an eventual 100% fixed fee
structure over AUM, should drive exponential sales growth.
However, we ascribe a certain risk to our estimates, primarily
due to the company’s lack of track record and immaturity of
market.
Valuation looks to be in line with the market after adjusting
for return on cash reserves. On a global average, we think
valuation is fair for a business which out earns its cost of
equity, demonstrates stability in its cash flow, and presents
new growth in a developing market. Moreover, recent M&A
activity has left Habitat as the only potential public vehicle in
the system after the completion of Provida’s sale.
We see upside risk coming from better than expected real
salary growth and positive churn data for the company both
in Chile and Peru. Downside risks to our thesis include: i)
decline in variable commission fees; ii) general change in
regulatory framework; iii) greater competitive pressure from
future auction in the market; iv) and a general deterioration
in macro economic factors.
0
3
6
9
12
15
18
500
600
700
800
900
1,000
1,100
Jun-12
Jul-12
Aug-12
Sep-12
Oct-12
Nov-12
Dec-12
Jan-13
Feb-13
Mar-13
Apr-13
May-13
Jun-13
USDm
CLP
Traded Volume (right axis)
Habitat
IPSA
2. Christopher DiSalvatore
(56 2) 2446 1724 cdisalvatore@credicorpcapital.com
Francisca Manuschevich
(56 2) 2446 1798, fmanuschevich@credicorpcapital.com
Income Statement (USDm)
Company Summary
Management
Ownership structure
Chairman : Jose Antonio Guzmán M atta
CEO : Cristián Rodriguez Allendes
CFO : Patricio Bascuñan M ontaner
Invest or Relat ions : Cristian Halabi / M egan Callahan
W EB sit e : www.afphabitat.cl
IPO dat e : 1998
M anagement( USDm) 2 0 11 2 0 12 LTM 2 0 13 E 2 0 14 E 2 0 15E 2 0 16 E
Revenues 2 3 4 2 4 8 2 4 8 2 57 2 8 2 3 2 0 3 3 1
Growth -11.6% 6.0% 0.3% 3.6% 10.1% 13.5% 3.4%
Cost of Sales + SG&A -85 -93 -96 -100 -112 -125 -130
Growth 2.1% 9.8% 3.8% 8.0% 11.7% 11.8% 4.2%
EBIT 14 5 18 1 170 18 0 19 7 2 2 4 2 3 3
Growth -19.9% 24.8% -6.1% -0.5% 9.0% 14.0% 3.7%
Depreciation -4 -4 -4 -5 -5 -6 -6
Growth 12.9% 0.6% 2.1% 25.2% 5.5% 5.6% 5.9%
EBITDA 16 3 172 19 2 19 5 2 12 2 3 9 2 4 8
Growth -13.3% 5.7% 11.8% 1.5% 8.5% 13.1% 3.6%
Non-Operational income 10 13 18 10 10 10 10
Pre-tax income 155 19 5 18 8 19 0 2 0 6 2 3 4 2 4 2
Taxes -29 -42 -44 -38 -41 -47 -49
M inority interest 0 0 0 0 0 0 0
Net income 12 6 152 14 5 152 16 5 18 7 19 3
Growth -19.0% 21.0% -5.0% 4.9% 9.0% 12.8% 3.4%
Adj. Net Income 13 0 12 6 12 6 12 8 13 9 157 16 1
EPS ( CLP) 6 4 6 2 6 2 6 2 6 8 77 79
M argins 2 0 11 2 0 12 LTM 2 0 13 E 2 0 14 E 2 0 15E 2 0 16 E
EBIT 62.2% 73.3% 68.5% 70.4% 69.7% 70.0% 70.2%
EBITDA 69.6% 69.4% 77.4% 76.0% 75.0% 74.7% 74.9%
Effective tax -18.8% -21.8% -23.1% -20.2% -19.9% -20.3% -20.4%
Net income 53.9% 61.5% 58.2% 59.1% 58.6% 58.2% 58.2%
M últ iplos 2 0 11 2 0 12 LTM 2 0 13 E 2 0 14 E 2 0 15E 2 0 16 E
EV/EBITDA 7.5x 9.0x 9.3x 8.5x 7.5x 7.2x 0.0x
P / E 10.2x 12.4x 13.3x 12.6x 11.6x 10.3x 0.0x
P / BV 3.0x 4.0x 4.3x 3.8x 3.4x 3.1x 2.9x
Div. Yield 7.6% 6.3% -5.5% 5.9% 6.0% 6.4% 7.1%
Others 33.4%
I. Union Esp.
3.7%
CChC 67.5%
Source: Company Reports
2
3. Christopher DiSalvatore
(56 2) 2446 1724 cdisalvatore@credicorpcapital.com
Francisca Manuschevich
(56 2) 2446 1798, fmanuschevich@credicorpcapital.com
Company Summary
Obligatory commissionBalance Sheet (USDm)
( USDm) 2 0 11 2 0 12 LTM 2 0 13 E 2 0 14 E 2 0 15E 2 0 16 E
Cash and cash equivalents 97 114 126 120 132 152 156
Current assets 102 120 132 127 139 159 164
Cash reserves 360 404 417 441 482 526 573
Fixed assets 29 29 29 28 27 26 28
Tot al asset s 50 7 56 9 59 3 6 15 6 70 73 8 79 5
Short term debt 0 0 1 1 1 1 1
Accounts payable 33 41 21 43 45 49 51
Total Current Liabilities 45 53 30 55 57 62 64
Long term debt 1 1 1 1 1 1 1
Tot al Liabilit ies 8 0 9 9 78 10 6 113 12 4 13 2
Shareholders' Equit y 4 2 8 4 70 516 511 559 6 16 6 6 5
M inority Interest 0 0 0 0 0 0 0
Equit y + Liabilit ies 50 7 56 9 59 3 6 15 6 70 73 8 79 5
Rat ios 2 0 11 2 0 12 LTM 2 0 13 E 2 0 14 E 2 0 15E 2 0 16 E
Ef f iciency Rat ios
Costs / Revenues -0.36x -0.37x -0.39x -0.39x -0.40x -0.39x -0.39x
Debt Rat ios
Debt / Assets 0.0x 0.0x 0.0x 0.0x 0.0x 0.0x 0.0x
Debt / Equity 0.0x 0.0x 0.0x 0.0x 0.0x 0.0x 0.0x
Net Debt / EBITDA -0.6x -0.7x -0.6x -0.6x -0.6x -0.6x -0.6x
Prof it abilit y Rat ios
ROE 29.4% 32.4% 28.1% 29.7% 29.6% 30.3% 29.0%
Adj. ROE* 30.3% 26.7% 24.5% 25.0% 24.8% 25.6% 24.2%
ROA 22.9% 24.4% 21.4% 23.1% 23.2% 24.0% 23.0%
1.44% 1.48%
1.27%
0.77%
2.36%
1.54%
0.00%
0.50%
1.00%
1.50%
2.00%
2.50%
Capital Cuprum Habitat Modelo Planvital Provida
Dec-11 Dec-12
*excluding returns on cash reserves
Source: SAFP
3
4. Christopher DiSalvatore
(56 2) 2446 1724 cdisalvatore@credicorpcapital.com
Francisca Manuschevich
(56 2) 2446 1798, fmanuschevich@credicorpcapital.com
Update on the competitive environment in Chile
71%
Source: SAFP
Net churn of contributors within system during 2012
Real salary growth versus contributor growth in the Chilean system, 2012
Habitat competes as a leading player in terms of size, profitability, and performance in the local AFP
industry. Unlike Provida, which focuses on a lower income segment, dominating in size but not
profitability, and Cuprum, which focuses on returns and not size (niche player), Habitat targets a middle to
higher-end income segment, which has resulted in an important balance between returns and scale.
Going forward, we would expect that with already important economies of scale and a history of superior
results (fund performance and quality of service – see initiation report Not Yet Time to Retire, 2012),
Habitat remains as the most competitive in a system where demand is relatively inelastic.
In 2012, Habitat achieved the highest growth in its salary base (real +9.0% versus national average of
3.3%), which we attribute to the company’s focus on an above average income segment and younger than
average demographic of the population when compared to the industry. More than 60% of the company’s
contribution base (close to 50% for the industry) are aged between 20 and 40, an age group which has
historically demonstrated an above average income growth pattern. Based on national figures, real salary
growth in Chile has averaged close to 2.0% growth over the past 10 years, while Habitat’s real growth has
trended closer to or above GDP growth in recent years.
Recent Regulatory Changes: After recent regulatory changes, Habitat was the only AFP to take the
initiative to lower its commission fees. Despite a potentially lower top line, it still charges the lowest
obligatory fees when set aside its larger peers. Though it is unclear exactly how this change will roll out
for the company, compounded by historical data which has shown a low price elasticity in the market, we
believe that the company will be able to offset any loss in new affiliates due the exclusivity reserved for low
cost competitor through a higher contribution penetration level. However, the augmentation of this
penetration tends to be marginal, inducing a dependence on wage growth for strong revenue generation..
In 2012, we also observed a positive churn rate of 322 thousand contributors or 6.2% of the total system,
up from an average of 5.5% over the previous 3 years For Habitat, the churn effect was marginal but a
positive 1,255 net adds versus a negative 4,000 additions for the system, primarily reflecting net losses for
Capital and Provida. Positively, this proves thus far that Modelo has not been successful enough to take
contributors from pre-existing players within system; however Habitat continues to show market share
losses in affiliates over a 2 year period (-195 bps versus +800 bps for Modelo and -370 bps for Provida).
Public system is not the answer: As mentioned earlier, we think the natural regulatory changes to occur
going forward will focus on increasing coverage and replacement rates, a challenge which in our view
remains partially outside of the realm of the current pension system’s power and responsibility. As
previously argued, creating a more flexible labor market and reducing the informality in employment can
have the largest impact on the future sustainability and growth of the system. We do not think the answer
to the current brouhaha of low payouts to be the construction and return to a publically managed pension
entity nor a pay as you go system. Both of these systems have been proven by other developed countries
to temporarily increase coverage at the expense of a country’s fiscal capacity. Moreover, the short-term,
political incentives for a public operator greatly differ from a private system, which conversely rely on
improved product offerings in order to maintain profitability and productivity, which in turn is eventually
passed on to contributors in the form of lower priced products.
Public arguments not withstanding, the private system has achieved levels of coverage exceeding those of
the pre-pension reform, which reached 73% in 2009 (including old and new system) versus 65% in 1989.
Put another way, the coverage in the 2008/2009 years represents a 15% increase over 1981 levels.
-30,000 20,000 70,000 120,000 170,000 220,000
Capital
Cuprum
Habitat
Modelo
Planvital
Provida
System
Churn amount (# of people)
Net Churn Negative Churn Positive Churn
System
Capital
Provida
Planvital
Cuprum
Habitat
-1%
0%
1%
2%
3%
4%
5%
6%
7%
8%
9%
6% 7% 8% 9% 10% 11%
Avg.YoYgrowthinContributors(2011-2012)
Avg. YoY Growth in Avg. Gross Income (2011-2012)
Source: Company reports & Credicorp Capital Estimates
Source: SAFP
4
5. Christopher DiSalvatore
(56 2) 2446 1724 cdisalvatore@credicorpcapital.com
Francisca Manuschevich
(56 2) 2446 1798, fmanuschevich@credicorpcapital.com
Chile’s pension fund system demonstrates characteristics of maturity compared to other OECD countries.
In 2012, total pension assets as a percentage of GDP reached 58.5% (USD 145 billion) versus a 72.4%
weighted average for the OECD countries (OECD considers a ratio above 20% as mature). Meanwhile, in
Peru, the importance of pension funds relative to the size of the economy was 18.8% (USD 38 billion, +21%
YoY) in 2012. A major reason for the industry’s success has been its mandatory contribution policy,
instituted in May of 1981. Despite the success of this reform, replacements rates for average earners
remain below the OECD recommendation of 70% while fertility rates have fallen and life expectancy rates
have risen, issues which will remain relevant, going forward.
A natural trend of a maturing demographic is a rising dependency ratio (% of youth and old / total working
population age), which the INE estimates will reach 50% by 2025 or levels close to Japan and the United
States, today. This trend highlights the importance of increasing contribution and replacement rates in
the country so that the system will be able to sustain itself. In our view, one of the principal reasons for a
lower replacement rate is generated by the low density of contribution. For example, some studies have
shown that the replacement rate for men in the system is 63% while only 50% for women, reflecting the
lower participation of women in the workforce, earlier retirement age, and longer average life span. Also,
the density (periodicity of payment & amount) of contribution varies between actors in the system based
on education levels and type of employment in the system.
Another reason for lower contribution has been lack of participation of independents in the system, both
formally and informally. Only until recent regulatory changes defined in 2008 will independents working in
the formalized labor market be required to contribute into the system (fully required by 2015). While
formality it is easier to monitor and control vis a vis tax receipts, the informality of labor is exactly the
opposite, creating a significant challenge for regulators to impel contribution and thus increase
contribution density. This latter should remain among the most salient challenges for system growth in
the short and medium term.
Despite the critics, the local pension system has grown to become a backbone for the Chilean society and
a model to the emerging world. However, all the benefits are still difficult to fully grasp due to the short
period of implementation of new reforms. Looking forward, we believe that 4 major themes should be
focused on by regulators to improve the retirements of contributors:
• A focus on liberalizing or creating a more flexible labor force, removing disincentives to hire, such as a
high requirement of severance pay. Today in Chile, employers are required to pay out one month of full
salary for every year worked, capped at 11 months. Creating less friction in unemployment benefits will
provide incentives to find work quicker, thus potentially having a positive effect on contribution.
• A mandatory increase of contribution per payer, which today stands at 10%. Effectively, an increase in
this rate would capitalize additional savings into a contributor’s account on a monthly basis, at the
expense of AFPs (greater working capital requirement due to increase in cash reserve requirements).
• Increase voluntary saving ratios via employer contribution matching of both younger and older
contributors. Today, total voluntary savings accounts only represent 4.0% of the total population versus
1.2% in 2002, a 13.9% CAGR over 10 years.
• The increase of the national retirement age, which today stands at 65 years for men and 60 years for
women. The OECD average stands at 67 years.
% of Population under the age of 15 and over the age of 60
Evolution of Chile’s natural (net) population growth rate
Chilean demographics
…But the Chilean system is encountering a “greying” population
14.1%
8.8%
6.2%
0%
2%
4%
6%
8%
10%
12%
14%
16%
1975-1980 2005-2010 2020-2025
0.0%
5.0%
10.0%
15.0%
20.0%
25.0%
30.0%
35.0%
1980 1985 1990 1995 2000 2005 2010 2015 2020 2025 2030 2035 2040 2045 2050
< 15 60 or over
-800,000 -600,000 -400,000 -200,000 0 200,000 400,000 600,000 800,000
0- 4
10-14
20-24
30-34
40-44
50-54
60-64
70-74
80+
1960
-800,000 -600,000 -400,000 -200,000 0 200,000 400,000 600,000 800,000
0- 4
10-14
20-24
30-34
40-44
50-54
60-64
70-74
80+
Age(yrs)
2010
MenWomen
All Sources: INE
5
6. Christopher DiSalvatore
(56 2) 2446 1724 cdisalvatore@credicorpcapital.com
Francisca Manuschevich
(56 2) 2446 1798, fmanuschevich@credicorpcapital.com
Source: SAFP & IM Trust
Dupont Analysis (2012)
Employment Productivity
Cost Efficiencies
…elasticity of demand still support high returns
Returns achieved by the system have evolved over time, reaching levels of close to 60% during the
system’s initial phase at the end of the 1980’s and falling to 17% during the mid 1990’s while the system
underwent the competitive stage of its life. Since this period and after the 2008 reforms, 5 AFPs have
operated in the system of which the two largest concentrated 66% of all members, comparing to 21
participants between 1993 and 1994.
In order to evaluate the true competitiveness of the industry, concentration cannot be the only variable
considered. In our view, it is important to understand how easily an industry’s structure can be
challenged. Within the pension system the existence of barriers to entry and the level of price competition
have dictated the high returns. Government mandated auctions for new affiliates entering the system
remain a testament to the low organic churn of the system. Effectively, without a forced auction new
competition would not exist.
However, in 2012 Habitat increased its personal and sales forces inducing a 10.2% increase in operational
expenses as it works to increase its competitiveness within the system. In the short term, we ascribe
certain downside risk to our valuation to cost increases in the short term, though under our base
scenario, we expect cost increases to stabilize after the 2Q 2013 during which time the company has
stated it plans to complete its current commercial strategy, “Habitat me explicó y yo entendi” (Habitat
explained and I understood). We expect the company’s efficiency index (operational expenses / operational
income) to jump 60 bps in 2013, driven by increased expenses generated by Peru, primarily in 2H 2013.
The economies of scale achieved by a single operator (mandatory flow and centralized stock of costs) and
the regulations defining the single corporate purpose support higher barriers to entry. This can be seen
through the existence of Modelo, or the 6th and most recent entrant to the market who had exclusive
control over all new affiliates entering the system during its first two years of operations. Comparatively,
the low price responsiveness of demand or fee structure produced both by the mandatory nature of the
system, long term horizon of investment, and the generally high information costs for contributors all
provide contrary winds to competition intensity.
In 2012, Habitat achieved an operational ROE of 25% (excluding cash reserves), compared to an average
of 22% for the system, excluding Habitat. Though ROE was 16.3 percentage points below Cuprum’s or the
most profitable operator in the system, ROA was only 2.4% percentage points below, illustrating a greater
difference in leverage than in operational efficiency. We estimate that the company is able to earn above
that of the industry due to its cost control efficiency and average focus on a higher income segment.
Though we do not believe lower variable commission fees can solve the replacement rate and coverage
issue, we see downside risk in falling rates as a result of political pressure, new players in market due to
mandated auctions, and the pass through of efficiency generated by private operators. Looking at the
current commission structure, we calculate an average commission burden paid as a percentage of a
working lifetime of accumulated assets of 0.68% for men and 0.95% for women, which does not appear
high in global terms and supports our view that any price war leading to pressure to lower obligatory fees
not be fundamental, but rather political. Under our base case scenario, we maintain obligatory fees at
1.27% in Chile. However, adjusting downwards from 1.27% to 1.19% by 2016 and maintain all else equal,
reduces are target price by CLP 66 or 7% of equity value. Our base estimates generate a 2013e ROE
excluding cash reserves of 27%, reaching 25% by 2016 for Chilean operations.
Capital
Cuprum
Planvital
Provida
Habitat
0.5x
1.0x
1.5x
2.0x
0.0% 5.0% 10.0% 15.0% 20.0% 25.0% 30.0%
Leverage(Assets/Equity)
ROA
Provida
Capital
Planvital
Habitat
Cuprum
25%
35%
45%
55%
65%
75%
0.1% 0.2% 0.3% 0.4% 0.5% 0.6% 0.7%
Costs/OperationalRevenuesw/out
ObligatoryReserves
Costs / AUM
Provida Capital Planvital Habitat Cuprum
26%
47%
37%
42%
25%
30%
35%
40%
45%
50%
55%
-
2
4
6
8
10
Habitat Capital Cuprum Provida
SalesForce/TotalEmployees(%)
SalesForce/10kContributors
Sales Force / 10,000 Contributors Sales Force / Total Employees (%)
All Sources: Company Reports
6
7. Christopher DiSalvatore
(56 2) 2446 1724 cdisalvatore@credicorpcapital.com
Francisca Manuschevich
(56 2) 2446 1798, fmanuschevich@credicorpcapital.com
Source: Superintendcia de Bancos, Seguros, y AFP Peru & IM Trust Estimates
*Habitat estimated for 2013. Other data is as of 2012.
**Weighted based on contributors
Principal Industry Indicators
Looking forward at a new growth opportunity in Peru
In December of 2012, Habitat won the tender in Peru for all new affiliates entering the private pension system by offering the lowest mixed commission fees among 6 other bidders. The
company’s exclusivity will have a duration of two years, during which time Habitat expects to generate a market of 700,000 new affiliates or approximately 12% of the market. The success of
the tender hinged on Habitat’s ability to offer the lowest mixed fee (90% variable & 10% AUM) of 0.55% versus its closest competition, Profuturo who offered 0.77%.
The major regulatory difference between Peru and Chile can be observed in the fee structure. Today in Peru, new affiliates will be required to pay a mixed fee, 90% of which will be charged
on top variable income while 10% will be charged on top of total assets under management. Based on the current legal structure, the system will converge to 100% AUM fees within 10 years.
Considering follow on auctions which should translate into greater competition, we assume a long term fee over AUM of 1.0% (2015) versus its 1.25%, today. However, due to the immaturity
of the Peruvian system and the changes observed in Chile over the past 2 years it is difficult to project a 10 year horizon for the system, and would ascribe some margin of error to our
estimates for Habitat in the country.
Despite the lack of full clarity of what Peru might become, in our view, Peru presents a important growth opportunity for the company, particularly due to the country’s lower formalized
market (~24% versus ~56% in Chile) and real GDP growth expectations (6.3% vs. 4.7% in Chile 2013e). Furthermore, Peru’s pension system is relatively young and immature in terms of
assets (AUM today represents 19% of GDP versus 60% in Chile) and has grown at a rate of 23% over the last 10 years versus 13% in Chile. The lower formalization has also in part driven a
CAGR affiliate growth over the last decade of 6% or 170% above that of Chile. The same goes for contributor growth, which averaged 8.0% in Peru versus 4.6% in Chile over the same period.
Demographically, the country is younger and will provide ample years of high growth for the industry. A lower life expectancy, averaging 72 years versus 78 year in Chile and a fertility rate is
122% higher than Chile has resulted in a dependency ratio closer to 35% versus 46% in Chile, today.
Major Assumptions: In our base case scenario, we assume an initial gain of 700 thousand affiliates with an average contribution ratio of 53% over the first 3 years of operation. We assume an
additional tender at the end of year 2, with which we expect the company to win again with lowest mixed fee offering, thus lowering our AUM fee by 25 bps to 1.0% by 2015. Thereafter, we
maintain AUM fees at 1.0% to reflect uncertainty in potential changes. In terms of salary base, we expect Habitat to focus initially on a lower income segment, which averages ~USD 500
taxable income monthly or USD 6,000 annually. We apply a growth rate of 8% in the short term converging to a nominal salary growth rate of 5% by 2016. On the cost side, we expect costs to
total 25 million for the company’s first 3 years of operations (2013-2016), there forth averaging 53% of sales or the average for the industry over the last 3 year period. Based on our
assumptions, we expect operations to breakeven during year 3 with the capacity of generating USD 16 million in earnings by 2020. We value our base scenario equity at 46 per share, which
implies an exit P/E excluding cash reserves of 10x or a 12% premium to Chile due to higher long term growth potential.
AFP Af f iliat es ( mn.) Cont ribut ing % M kt . Share ( Cont ribut or) AUM ( bn.) M kt Share AUM Commission Fees ( old) M ixed Fee St ruct ure ( t ender 2 0 12 )
Horizante 1.4 42% 25% 8.7 24% 1.89% 1.63%
Integra 1.4 50% 29% 11.0 30% 1.74% 1.52%
Prima 1.3 50% 28% 11.4 31% 1.60% 1.55%
Profuturo 1.2 38% 19% 5.5 15% 2.10% 1.46%
Habitat* n/a n/a 12% n/a n/a n/a 0.55%
Syst em Average 5.2 4 5% 10 0 % 3 6 .6 10 0 % 1.8 1%** 1.3 4 %
7
8. Christopher DiSalvatore
(56 2) 2446 1724 cdisalvatore@credicorpcapital.com
Francisca Manuschevich
(56 2) 2446 1798, fmanuschevich@credicorpcapital.com
Informal employment as a % of total
Contribution rates, Chile vs. Peru ( contributors / affiliates)
Dependency Ratio ( less than 15 yrs & more than 64 yrs / Wking. Population)
Chilean & Peruvian pension system indicators
Average retirement age at labor force exit (OECD)
Gross pension replacement rate: average earners (OECD)
Importance of pension assets to the size of economy (% of GDP)
18.8%
36.6%
59.4%
0.0% 20.0% 40.0% 60.0% 80.0% 100.0% 120.0% 140.0% 160.0%
Greece
France
Korea
Italy
Germany
Portugal
Spain
Mexico
Peru*
Japan
Simple Average
Israel
Chile*
United States
United Kingdom
Australia
Netherlands
0
10
20
30
40
50
60
70
80
Men Women
44.9
58.1
0
20
40
60
80
100
120
0%
20%
40%
60%
80%
100%
2000 2010
0%
10%
20%
30%
40%
50%
60%
70%
80%
90%
1960 1965 1970 1975 1980 1985 1990 1995 2000 2005 2010 2015 2020 2025 2030 2035 2040 2045 2050
Chile USD Japan
0%
10%
20%
30%
40%
50%
60%
2007 2008 2009 2010 2011 2012
Contribution Rate Chile Contribution Rate Peru
Source: SAFP & SBS Peru
Source: INE & World Bank
Source: ILOSource: OECD
Source: OECD
Source: OECD
8
9. Christopher DiSalvatore
(56 2) 2446 1724 cdisalvatore@credicorpcapital.com
Francisca Manuschevich
(56 2) 2446 1798, fmanuschevich@credicorpcapital.com
Valuation
Target price
Discount rate (Chile)
DDM (Chile)
We valued Habitat using a 10 year DDM (2013 – 2022) and assuming a dividend payout ratio of 90%,
excluding returns on cash reserves. We assume a real cost of equity of 7.4% for Chile and 9.5% for
Peru in USD, growing perpetuity at a nominal 0% and 3%, respectively by country. Our perpetuity
growth rates imply a P/E exit multiple excluding returns on cash reserves of 9.0x for Chilean
operations and 10.0x for Peruvian operations.
On a relative basis, Habitat trades at a recurring P/E 2014e of 13.9x and EV /EBITDA of 8.5x, which
stands at a 1.5% premium and 8.6% discount, respectively to global peers. In our view, the fair
valuation on a fwd P/E basis compared to global wealth managers is fair due to lower share
liquidity and despite higher returns and a more stability in cash flow generation. Though growth
into Peru, a strong macro situation in Chile, and recent M&A activity in the market should continue
to justify relative valuation levels above the company’s historical averages, current levels leave little
to no space for execution hiccups, political pressure on regulatory environment, and any important
deterioration in economic expectations.
Moreover, we expect a dividend yield of 5.9% in 2013, which is below the 8% average over the past 3
year period, though still ranks among the highest in the IPSA index for 2013e.
Model Inputs
Total equity value Chile USDm 1,838
Equity value Peru USDm 94
Exchange Rate CLP / USD 490
Tot al equit y value CLPbn 9 4 6 ,50 1
Outstanding shares M illion 1,000
2 0 13 Y E Target Price CLP per share 9 4 7
Current Price CLP per share 940
Upside Pot ent ial 0 .7%
Dividend Yield 2013 5.9%
USDm 2 0 13 E 2 0 14 E 2 0 15E 2 0 16 E 2 0 17E
Total net income (t-1) 152 154 164 181 185
Return on cash reserves (t-1) 27 24 26 29 32
Required cash reserves (t-1) 13 14 14 16 15
Dividend 113 116 124 136 138
DDM 113 10 8 10 7 110 10 4
C hile ( clp real)
Risk premium 6.0%
Levered beta 0.74
Risk free rate 3.0%
Cost of equity (CLP real) 7.4%
2013e inflation 2.7%
Exit M ultiple ex. reserve income 9.0x
( U SD m)
Equity from DDM Chile 995
Equity in perpetuity Chile 843
Tot al Equit y 1,8 3 8
9
10. Christopher DiSalvatore
(56 2) 2446 1724 cdisalvatore@credicorpcapital.com
Francisca Manuschevich
(56 2) 2446 1798, fmanuschevich@credicorpcapital.com
Risk-Reward Analysis
Bull Case: 2013E T.P.$1,050(+17.6%, including dividends)
(a) In Chile, we assume macro fundamentals to support low unemployment levels, thus driving salary
growth above GDP growth in short term for Habitat, converging to 3% over the long term. (b) We expect
commission fees to remain flat and expect contributor growth to derive from new independents (140
thousand) as well as 3% organically, an average rate observed over the previous 5 years. (c) In Peru,
we assume macro fundamentals to support low unemployment levels, thus driving salary growth
above GDP growth in short term, falling to 3% in long term. (d) In Peru, we expect a 2nd tender win in
2015, increasing the company’s affiliate based by an additional 600 thousand thereafter, at a long term
contributor penetration rate of 70%. We expect AUM fees to fall from 1.25% to 1.0% by 2015 tender and
to remain thereafter. (d) Assumption that monthly contribution rate stays at 10%. (e) We consider a
long term P/E exit multiple of 10x.
Base Case: 2013E T.P.$947 (+6.6%, including dividends)
(a) In Chile, we assume macro fundamentals to support low unemployment levels, thus driving salary
growth above GDP growth in short term for Habitat (7.6% in 2013 followed by 6.1% in 2014), converging
to real 3% over the long term. (b) We expect variable commission fees to fall to remain at 1.27% while
we expect a total of 140 thousand new affiliates for the company by 2015 (only independents). (c) In
Peru, we assume macro fundamentals to support low unemployment levels, thus driving salary
growth above GDP growth in short term (8% in 2013 converging to 5% by 2016, nominal). (d) In Peru,
we expect a 2nd tender win in 2015, increasing the company’s affiliate based by an additional 600
thousand thereafter, at a long term contributor penetration rate of 60%. We expect AUM fees to fall
from 1.25% to 1.0% by 2015 tender and to remain thereafter. (d) Assumption that monthly contribution
rate stays at 10%. (e) We consider a long term P/E exit multiple 9.0x.
Bear Case: 2013E T.P.$717 (-17.8%, including dividends)
(a) In Chile, we assume macro fundamentals to support low unemployment levels, thus driving salary
growth above GDP growth in short term for Habitat, converging to 2% over the long term. (b) In Chile,
we expect variable fees to fall to 1.19% in long term and no organic growth from independents. (c) In
Peru, we assume macro fundamentals to support low unemployment levels, thus driving salary
growth above GDP growth in short term, converging to 5% by 2016. (d) In Peru, we do not expect a
tender in 2015. We assume a long term contributor penetration rate of 50%. We expect AUM fees to fall
from 1.25% to 1.0% by 2015. (d) Assumption that monthly contribution rate in Chile increases to 15% by
2014. (e) We consider a long term exit multiple of 9.0x.
Scenarios
Risk / Reward ViewBull, Base, & Bear Analysis
1,050
717
932
947
100
300
500
700
900
1,100
1,300
Jan/00
Jun/09
Jun/10
Jun/11
Jun/12
Jun/13
CLP/share
Historical Price
2013YE Target Price
USDm 2 0 10 2 0 11 2 0 12 2 0 13 2 0 14 2 0 15
Revenues 129,437 114,486 121,301 125,688 138,324 157,015
EBITDA 91,934 77,832 97,270 95,586 103,715 117,318
Net Income 76,151 61,654 74,576 74,344 81,033 91,386
Revenues 129,437 114,486 121,301 129,315 144,673 166,193
EBITDA 91,934 77,832 97,270 97,808 107,683 123,266
Net Income 76,151 61,654 74,576 76,121 84,205 96,085
Revenues 129,437 114,486 121,301 124,071 133,919 140,653
EBITDA 91,934 77,832 97,270 94,490 100,642 106,513
Net Income 76,151 61,654 74,576 73,467 78,577 82,798
Base Case
Bull Case
Bear Case
10
11. Christopher DiSalvatore
(56 2) 2446 1724 cdisalvatore@credicorpcapital.com
Francisca Manuschevich
(56 2) 2446 1798, fmanuschevich@credicorpcapital.com
Comparables
Global comps EV/EBITDA ltm
P/BV ltm
P/E ltm
10.1x
7.5x
5x
6x
7x
8x
9x
10x
11x
Oct-10
Feb-11
Jun-11
Oct-11
Feb-12
Jun-12
Oct-12
Feb-13
Jun-13
Average
Std. Deviation +/-
13.0x
8.7x
4x
5x
6x
7x
8x
9x
10x
11x
12x
13x
14x
Jan-10
May-10
Sep-10
Jan-11
May-11
Sep-11
Jan-12
May-12
Sep-12
Jan-13
May-13
Average
Std. Deviation +/-
4.2x
3.1x
0x
1x
1x
2x
2x
3x
3x
4x
4x
5x
5x
Jan-10
May-10
Sep-10
Jan-11
May-11
Sep-11
Jan-12
May-12
Sep-12
Jan-13
May-13
Average
Std. Deviation +/-
M kt . Cap. EV / EBITDA EV / EBITDA P/ E P/ E P/ BV EBITDA
( USD m) 2 0 13 E 2 0 14 E 2 0 13 E 2 0 14 E UDM M g.
Habit at ( incl. Reserves) 1,854 8 .5x 7.5x 14 .8 x 13 .9 x 4 .1x 6 8 %
Provida 1,965 7.5x 7.1x 8.7x 8.1x 2.7x 63%
Cuprum 1,316 na na na na 6.9x 66%
BlackRock Inc 48,674 12.1x 10.8x 17.3x 15.3x 1.9x 41%
Franklin Res. 32,018 9.3x 8.3x 14.3x 12.9x 3.4x 40%
Blackstone 24,106 18.6x 14.9x 9.4x 7.9x 4.4x 28%
T Rowe Price 19,632 10.5x 9.4x 19.4x 17.3x 4.8x 49%
Invesco 15,323 15.2x 13.3x 15.7x 13.6x 1.9x 28%
Eaton Vance 4,953 10.6x 9.0x 18.9x 16.5x 7.6x 39%
Ashmore Group 4,011 9.4x 8.1x 14.1x 12.4x 4.5x na
Legg M ason 4,268 9.1x 8.8x 15.6x 13.7x 0.9x 15%
Waddell Reed 4,038 9.9x 8.7x 17.3x 15.0x 7.2x 32%
Federated Inv 3,034 11.2x 10.3x 16.9x 15.4x 5.8x 38%
Cohen & Steers 1,630 12.8x 11.4x 20.6x 17.2x 7.8x 36%
Janus Capital 1,664 7.2x 6.7x 13.3x 11.6x 1.1x 33%
Calamos Asset 221 5.5x 5.6x 17.6x 17.4x 1.1x 40%
M etlife 49,385 na na 8.2x 7.9x 0.8x na
Principal Financial 11,341 na na 11.5x 10.3x 1.2x na
Average ex. Insurers 10 .5x 9 .3 x 15.6 x 13 .9 x 4 .1x 4 1.1%
Average 10 .5x 9 .3 x 14 .9 x 13 .3 x 3 .8 x 4 1.1%
Company
11
Source: Bloomberg & Credicorp Capital Estimates
12. Christopher DiSalvatore
(56 2) 2446 1724 cdisalvatore@credicorpcapital.com
Francisca Manuschevich
(56 2) 2446 1798, fmanuschevich@credicorpcapital.com
Heinrich Lessau CHILE COLOMBIA Hernán Arellano Marilyn Macdonald
Head of Research Head of Equities Equity Sales International
hlessau@credicorpcapital.com Francisca Manuschevich Daniel Velandia harellano@credicorpcapital.com mar_macdonald@btconnect.com
# (562) 2446 1704 Head of Equity Research - Chile Head of Research & Chief Economist # (562) 2446 1706 # (4477) 7151 5855
fmanuschevich@credicorpcapital.com dvelandia@credicorpcapital.com
PERÚ # (562) 2446 1798 # (571) 339 4400 Ext 505 Roberto Salas Cristián Castillo
Equity Sales International Sales Trader International
Alejandro Rabanal Christopher DiSalvatore Valeria Marconi rsalas@credicorpcapital.com ccastillo@credicorpcapital.com
Head of Equity Research - Perú Senior Analyst: Retail & Financials Senior Analyst: Oil & Gas # (562) 2446 1732 # (786) 999 1633
arabanal@credicorpcapital.com cdisalvatore@credicorpcapital.com vmarconi@credicorpcapital.com
# (511) 205 9190 Ext 36070 # (562) 2446 1724 # (571) 339 4400 Ext 594 CHILE PERÚ
María Teresa Sarmiento Felipe Etchegaray Jaime Pedroza Rene Ossa Jorge Monsante
Senior Analyst: Infrastructure Senior Analyst: Telecom & Utilities Senior Analyst: Utilities Equity Sales International General Manager Credibolsa
msarmientov@credicorpcapital.com fetchegaray@credicorpcapital.com jpedroza@credicorpcapital.com reneossa@credicorpcapital.com jmonsante@credicorpcapital.com
# (511) 205 9190 Ext 33055 # (562) 2446 1768 # (571) 339 4400 Ext 9139 # (562) 2651 9324 # (511) 313 2918
Fernando Pereda Ignacio Spencer Juan Camilo Domínguez Christian Munchmeyer Gonzalo Morales
Senior Analyst: Cement & Utilities Senior Analyst: Food & Beverages, Others Senior Analyst: Banks Sales & Trading International Head of Sales & Trading
fpereda@credicorpcapital.com ispencer@credicorpcapital.com jcdominguez@credicorpcapital.com cmunchmeyer@credicorpcapital.com gmorales@credicorpcapital.com
# (511) 205 9190 Ext 37856 # (562) 2450 1688 # (571) 339 4400 Ext 572 # (562) 2450 1613 # (511) 313 2918 Ext 32901
Héctor Collantes Javier Günther Juliana Valencia COLOMBIA Úrsula Mitterhofer
Senior Analyst: Mining Analyst: Construction & Health Services Analyst: GEA & BVC Sales & Trading
hcollantes@credicorpcapital.com jgunther@credicorpcapital.com jvalencia@credicorpcapital.com Sergio Ortíz umitterhofer@credicorpcapital.com
# (511) 205 9190 Ext 33052 # (562) 2450 1695 # (571) 339 4400 Ext 365 Head of Equities Sales - Colombia # (511) 313 2918 Ext 32922
sortiz@credicorpcapital.com
Omar Avellaneda José Manuel Edwards # (571) 339 4400 Ext 273
Senior Analyst: Retail & Others Analyst: Natural Resources
oavellaneda@credicorpcapital.com jedwards@credicorpcapital.com Juan Antonio Jiménez
# (511) 205 9190 Ext 36065 # (562) 2446 1761 Head of Equity Sales International
jjimenez@credicorpcapital.com
Andrés Ossa # (571) 339 4400 Ext 466
Analyst: Telecom & Utilities
aossa@credicorpcapital.com Santiago Castro
# (562) 2651 9332 Sales & Trading International
scastro@credicorpcapital.com
Lourdes Alamos # (571) 339 4400 Ext 369
Assistant to Research
lalamos@credicorpcapital.com
# (562) 2450 1609
EQUITY RESEARCH TEAM EQUITY SALES & TRADING
Contact Information
13. Christopher DiSalvatore
(56 2) 2446 1724 cdisalvatore@credicorpcapital.com
Francisca Manuschevich
(56 2) 2446 1798, fmanuschevich@credicorpcapital.com
This report has been prepared by Inversiones IMT S.A. and/or Correval S.A. Sociedad Comisionista de Bolsa and/or BCP Capital S.A.A. and/or their subsidiaries for informative purposes
only. This report is based on publicly available information that it should be considered to come from reliable sources. However we do not guarantee it as accurate or complete and it
should not be relied on as such.
Unless otherwise stated, this report does not include privileged information that could violate either copyrights or market regulations.
This material belongs to Inversiones IMT S.A. and/or Correval S.A. Sociedad Comisionista de Bolsa and/or BCP Capital S.A.A. and/or their subsidiaries and can not be copied, distributed
or redistributed in any form by any means or without the prior written consent of Inversiones IMT S.A. and/or Correval S.A. Sociedad Comisionista de Bolsa and/or BCP Capital S.A.A.
and/or their subsidiaries.
The purpose of this report is not to predict the future, nor guarantee specific financial results. It is also important to consider that the information contained in this research may be
oriented to a specific segment of clients or investors, with a certain risk profile that may not be yours. Unless otherwise stated, the report does not contain investment recommendations
or other suggestions that can be understood to be given under the capital market intermediaries’ special duty to clients classified as investors. When recommendations are made, the
report will specify a risk profile. Inversiones IMT S.A. and/or Correval S.A. Sociedad Comisionista de Bolsa and/or BCP Capital S.A.A. and/or their subsidiaries can seek and/or conduct
business with companies that are mentioned in the report, and they can also execute buying and selling transactions of shares that are mentioned.
It is important to state that fluctuations in Exchange rates can have adverse effects on investment value. Inversiones IMT S.A. and/or Correval S.A. Sociedad Comisionista de Bolsa and/or
BCP Capital S.A.A. and/or their subsidiaries recommend their clients to seek assistance from professionals accredited by the appropriate regulatory agency. It is up to the client to
determine if the information in this report is sufficient to make an investment decision or any other market operation.
Under no circumstances can the information published here be considered as provided legal, accounting or taxation concept. When it is required, Inversiones IMT S.A. and/or
Correval S.A. Sociedad Comisionista de Bolsa and/or BCP Capital S.A.A. and/or their subsidiaries recommend their clients to seek advice from accredited professionals.
Inversiones IMT S.A. and/or Correval S.A. Sociedad Comisionista de Bolsa and/or BCP Capital S.A.A. do not assume any responsibility, obligation nor any loss related to the information
contained in this report, neither do these same firms assume civil responsibility for any legal recourse caused by action or omission derived from this document.
Disclaimer