Recommended

Recommended
More Related Content
Similar to Climate Change Co2 Emissions
Similar to Climate Change Co2 Emissions (15)
Climate Change Co2 Emissions
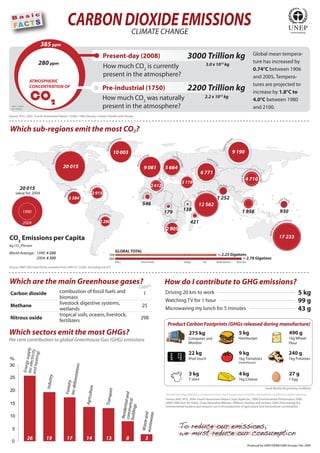
- 1. Bas FA C T S ic CARBON DIOXIDE EMISSIONS CLIMATE CHANGE www.unep.org 385 ppm Present-day (2008) 3000 Trillion kg Global mean tempera- 280 ppm 3.0 x 10¹⁵ kg ture has increased by How much CO2 is currently 0.74°C between 1906 present in the atmosphere? and 2005. Tempera- ATMOSPHERIC tures are projected to CONCENTRATION OF Pre-industrial (1750) 2200 Trillion kg CO2 How much CO2 was naturally 2.2 x 10¹⁵ kg increase by 1.8°C to 4.0°C between 1980 ppm = parts per million present in the atmosphere? and 2100. Source: IPCC, 2007. Fourth Assessment Report; CDIAC, 1990. Glossary: Carbon Dioxide and Climate Which sub-regions emit the most CO2? nland ) o pe ree ur nE (G Easter Arctic ica 10 003 9 190 o pe Eur Centr r me al Centr A al rn North Weste Eur As 20 015 op 9 081 5 664 ia e d Northwe 6 771 an st P East Asia 4 710 aci c No 3 119 rth n 2 612 th Asia ern Afr b ea 20 015 erica S ou Carib Am bian Peninsu ica value for 2004 2 915 tern A Ara la Meso Wes f r ic a 3 384 1 252 as the t A th Pac e rn A S ou sia 546 S ou i c ral A 12 562 E a st fr i c a Cent f ri c a 1990 179 138 n India 1 956 930 merica hA Wester n Oc e a Sout n f ri c a Zealand 2004 2 290 nA 421 nd New Souther 2 905 a lia Austra CO2 Emissions per Capita 17 233 kg CO2/Person World Average: 1990: 4 200 GLOBAL TOTAL 1990 = 2.23 Gigatons 2004: 4 300 2004 = 2.78 Gigatons Africa Asia & Paci c Europe LAC North America West Asia Source: UNEP GEO Data Portal, compiled from UNFCCC, CDIAC. Excluding LULUCF Which are the main Greenhouse gases? How do I contribute to GHG emissions? GWP* Carbon dioxide combustion of fossil fuels and 1 Driving 20 km to work 5 kg biomass livestock digestive systems, Watching TV for 1 hour 99 g Methane 25 wetlands Microwaving my lunch for 5 minutes 43 g tropical soils, oceans, livestock, Nitrous oxide 298 fertilizers Product Carbon Footprints (GHGs released during manufacture) Which sectors emit the most GHGs? 275 kg 5 kg 490 g Per cent contribution to global Greenhouse Gas (GHG) emissions Computer and Hamburger 1kg Wheat Monitor Flour (ex: elecsupply and heatricity 22 kg 9 kg 240 g ting) % iPod touch 1kg Tomatoes 1kg Potatoes Energy (Greenhouse) 30 n) restatio 3 kg 4 kg 27 g 25 Industry T-shirt 1kg Cheese 1 Egg Forestry (ex: defo e Food: Mostly UK growing conditions 20 ur rt Transpo Agricult comme tial and * Global warming potential is a measure of how much a given mass of GHG is estimated to contribute to global warming. Source: (left) IPCC, 2004. Fourth Assessment Report. (top): Apple Inc., 2008. Environmental Performance 2008; buildingrical 15 UNEP, 2008. Kick the Habit; Coop Naturaline Website; Williams, Audsley, and Sandars, 2006. Determining the s environmental burdens and resource use in the production of agricultural and horticultural commodities. Residen wastew d ater 10 n W aste a To reduce our emissions, we must reduce our consumption 5 26 19 17 14 13 8 3 0 Produced by UNEP/DEWA/GRID-Europe, Feb. 2009