Spike removal through multiscale wavelet and entropy analysis of ocular motor noise: A case study in patients with cerebellar disease

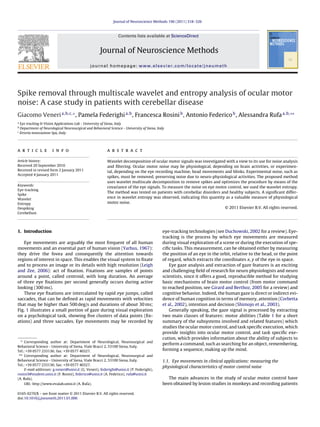
Wavelet decomposition of ocular motor signals was investigated with a view to its use for noise analysis and filtering. Ocular motor noise may be physiological, depending on brain activities, or experimental, depending on the eye recording machine, head movements and blinks. Experimental noise, such as spikes, must be removed, preserving noise due to neuro-physiological activities. The proposed method uses wavelet multiscale decomposition to remove spikes and optimizes the procedure by means of the covariance of the eye signals. To measure the noise on eye motor control, we used the wavelet entropy. The method was tested on patients with cerebellar disorders and healthy subjects. A significant difference in wavelet entropy was observed, indicating this quantity as a valuable measure of physiological motor noise.

Empfohlen
Empfohlen
Weitere ähnliche Inhalte
Was ist angesagt?
Was ist angesagt? (17)
Ähnlich wie Spike removal through multiscale wavelet and entropy analysis of ocular motor noise: A case study in patients with cerebellar disease
Ähnlich wie Spike removal through multiscale wavelet and entropy analysis of ocular motor noise: A case study in patients with cerebellar disease (20)
Kürzlich hochgeladen
Kürzlich hochgeladen (20)
Spike removal through multiscale wavelet and entropy analysis of ocular motor noise: A case study in patients with cerebellar disease
- 1. Journal of Neuroscience Methods 196 (2011) 318–326 Contents lists available at ScienceDirect Journal of Neuroscience Methods journal homepage: www.elsevier.com/locate/jneumeth Spike removal through multiscale wavelet and entropy analysis of ocular motor noise: A case study in patients with cerebellar disease Giacomo Veneria,b,c,∗ , Pamela Federighia,b , Francesca Rosinib , Antonio Federicob , Alessandra Rufaa,b,∗∗ a Eye tracking & Vision Applications Lab - University of Siena, Italy b Department of Neurological Neurosurgical and Behavioral Science - University of Siena, Italy c Etruria innovazione Spa, Italy a r t i c l e i n f o Article history: Received 20 September 2010 Received in revised form 2 January 2011 Accepted 4 January 2011 Keywords: Eye-tracking Spike Wavelet Entropy Despiking Cerebellum a b s t r a c t Wavelet decomposition of ocular motor signals was investigated with a view to its use for noise analysis and filtering. Ocular motor noise may be physiological, depending on brain activities, or experimen- tal, depending on the eye recording machine, head movements and blinks. Experimental noise, such as spikes, must be removed, preserving noise due to neuro-physiological activities. The proposed method uses wavelet multiscale decomposition to remove spikes and optimizes the procedure by means of the covariance of the eye signals. To measure the noise on eye motor control, we used the wavelet entropy. The method was tested on patients with cerebellar disorders and healthy subjects. A significant differ- ence in wavelet entropy was observed, indicating this quantity as a valuable measure of physiological motor noise. © 2011 Elsevier B.V. All rights reserved. 1. Introduction Eye movements are arguably the most frequent of all human movements and an essential part of human vision (Yarbus, 1967): they drive the fovea and consequently the attention towards regions of interest in space. This enables the visual system to fixate and to process an image or its details with high resolution (Leigh and Zee, 2006): act of fixation. Fixations are samples of points around a point, called centroid, with long duration. An average of three eye fixations per second generally occurs during active looking (300 ms). These eye fixations are intercalated by rapid eye jumps, called saccades, that can be defined as rapid movements with velocities that may be higher than 500 deg/s and durations of about 30 ms; Fig. 1 illustrates a small portion of gaze during visual exploration on a psychological task, showing five clusters of data points (fix- ations) and three saccades. Eye movements may be recorded by ∗ Corresponding author at: Department of Neurological, Neurosurgical and Behavioral Science - University of Siena, Viale Bracci 2, 53100 Siena, Italy. Tel.: +39 0577 233136; fax: +39 0577 40327. ∗∗ Corresponding author at: Department of Neurological, Neurosurgical and Behavioral Science - University of Siena, Viale Bracci 2, 53100 Siena, Italy. Tel.: +39 0577 233136; fax: +39 0577 40327. E-mail addresses: g.veneri@unisi.it (G. Veneri), federighi@unisi.it (P. Federighi), rosini3@student.unisi.it (F. Rosini), federico@unisi.it (A. Federico), rufa@unisi.it (A. Rufa). URL: http://www.evalab.unisi.it (A. Rufa). eye-tracking technologies (see Duchowski, 2002 for a review). Eye- tracking is the process by which eye movements are measured during visual exploration of a scene or during the execution of spe- cific tasks. This measurement, can be obtained either by measuring the position of an eye in the orbit, relative to the head, or the point of regard, which extracts the coordinates x, y of the eye in space. Eye gaze analysis and extraction of gaze features is an exciting and challenging field of research for neuro physiologists and neuro scientists, since it offers a good, reproducible method for studying basic mechanisms of brain motor control (from motor command to reached position, see Girard and Berthoz, 2005 for a review) and cognitive behavior. Indeed, the human gaze is direct or indirect evi- dence of human cognition in terms of memory, attention (Corbetta et al., 2002), intention and decision (Shimojo et al., 2003). Generally speaking, the gaze signal is processed by extracting two main classes of features: motor abilities (Table 1 for a short summary of the subsystems involved and related features) which studies the ocular motor control, and task specific execution, which provide insights into ocular motor control, and task specific exe- cution, which provides information about the ability of subjects to perform a command, such as searching for an object, remembering, forming a sequence, making up the mind. 1.1. Eye movements in clinical applications: measuring the physiological characteristics of motor control noise The main advances in the study of ocular motor control have been obtained by lesion studies in monkeys and recording patients 0165-0270/$ – see front matter © 2011 Elsevier B.V. All rights reserved. doi:10.1016/j.jneumeth.2011.01.006
- 2. G. Veneri et al. / Journal of Neuroscience Methods 196 (2011) 318–326 319 Fig. 1. A small portion (1500 ms) of the gaze of a patient with cerebellar disorder on a visual search task: the highlighted fixations are ordered in the time domain, from first to last. The main clinical features of cerebellar disorders include incoordination, imbalance, and troubles with stabilizing eye movements. In the simplified form of the test, subjects are asked to look for a right oriented “E”. The image appeared on the screen for 20000 ms. with selective brain lesions or homogeneous groups of patients with genetic neuro-degenerative diseases. Recently, however, ocu- lar motor control has also attracted attention for studying complex tasks, such as recognition of facial expression (Xu-Wilson et al., 2009) and gaze contingent applications (Veneri et al., 2010a). Some authors found that humans can adapt ocular motor characteris- tics (velocity, latency) according to the behavior in order to reduce energy consumption or improve efficiency; the hypothesis was ver- ified by van Beers (2008), through resolution of an optimal control problem of modulating saccade velocity to minimize variance of gaze during saccades and fixations. The problem can be explained intuitively as the human ability to reduce energy consumption (gaze variability) in order to improve efficiency (precision on the target) (van Beers, 2009). In the clinical context, one of the most interesting analyses of motor control was applied to patients with disorders of the cere- bellum, especially patients with spinocerebellar cerebellar ataxia type 2 (SCA2), a rare disease. SCA2 is one of a group of genetic disorders characterized by slowly progressive impairment of the ability to control eye movements (slow saccades) (Filla et al., 1996; Bürk et al., 1999; Ramat et al., 2007). In this respect, Leigh and Kennard (2004) proposed using saccades as a research tool in the clinical neuro-sciences and the main sequence (a set of relation- Table 1 Common eye movement features studied: saccade velocity is typically analyzed in patients with cerebellar or brainstem lesions. Saccadic trajectories and microsac- cades are studied in attention and voluntary–involuntary tasks. Fixations and ROI are studied in free visual search tasks. Subsystem Computation Gaze shift Saccades Distance of target from fovea der Stigchel et al., 2006 (deg), Velocity Leigh and Zee, 2006 (deg/s), Duration (ms), Latency after target appearance Rayner et al., 1983 (ms) Pursuit Target velocity (deg/s) Vergence Target depth (cm) Gaze holding Fixations Visual scanning region of interest (ROI), Distance to nearest ROI (deg), Time spent in ROI (ms), Tremor (deg2 ), Drifts (deg), Microsaccades Engbert and Kliegl, 2003 Vestibular Rotation, translation of head or body (deg) Optokinetic Speed direction of full-field image motion (deg/s) ships between saccade amplitude and peak velocity; Bollen et al., 1993) as a valid tool to classify the subject. These results indicated the need to investigate a measure of “physiological characteristics of gaze noise” (PN), such as tremor, square jerks (Leigh and Zee, 2006), nystagmus (Abel et al., 2008) and drift. According to van Beers (2007) PN may be additive with or multiplicative of the eye move- ment, and is lost in recording noise (RN) due to blinks or signal loss; generally speaking, we can measure subject noise = PN + RN = SDN (signal) + ADN + RN where SDN is physiological signal dependent noise and ADN physiological additive noise. A natural approach to quantify the degree of order of gaze sig- nals is to consider their spectral features and spectral entropy. Inouye et al. (1993) were the first to apply spectral analysis by a Fourier analysis to the study of brain signals. Recently, some authors (Quiroga et al., 2001; Kamavuako et al., 2009) proposed the application of multiresolution wavelet decomposition (Mallat, 1989) to overcome the limitations of the Fourier transform and to study the ocular motor abilities in infantile syndromes (Abel et al., 2008). The wavelet method arranges successive wavelet transforms in a hierarchical scheme, enabling the decomposition of the signal. In the present study, we describe a method to esti- mate PN by wavelet entropy and to remove RN by multi-scale wavelet transform (MWT). In particular, we propose a method to remove signal artefacts such as spikes. Spikes are unwanted and uninteresting rapid signal artifacts (Juhola et al., 1987) that may deceive pattern recognition algorithms and be confused with sac- cades (Fig. 3; see Fischer and Biscaldi, 1993 for the most common algorithm of saccades), or induce the fixation search algorithm to over-segmentate (Salvucci and Goldberg, 2000; Veneri et al., 2010b). Techniques based on linear or adaptive filters, or spectrum analysis may affect the morphological characteristics of gaze noise. It is therefore necessary to use advanced techniques to recognise spikes and to suppress them (despiking), preserving the natural characteristics of ocular noise. We used MWT and covariance to decompose the signal and remove spikes. Implementation of the algorithm is described in Section 3.2. After despiking, motor control noise was measured by wavelet entropy (WS; Coifman and Wickerhauser, 1992): in the time domain, entropy is a measure of signal uncertainty and in the spec- tral domain it is a measure of signal complexity. High entropy is associated with signals generated by disordered, random pro- cesses, and low entropy with ordered or partially ordered processes (Zunino et al., 2007). If a process is noisy, its signal wavelet decom- position can be expected to contribute significantly to total wavelet energy in all frequency bands. This makes WS a good candidate of for estimating PN. We evaluated the method performance in a computer- generated simulation (Section 5.1), and in a small group of SCA2 patients and a mixed group of patients with genetically undefined cerebellar ataxia (NDC) (Section 5.2). The results provided evidence that the proposed technique can discriminate healthy subjects from patients. 2. Materials and methods Eight SCA2 patients, a mixed group of three patients with unde- fined genetic cerebellar ataxia (NDC) and 25 healthy subjects were enrolled in the study. All were in the age range 25–45 years. Subjects were seated at viewing distance of 78 cm from a 32 in. color monitor (51 cm×31 cm). Eye position was recorded using an ASL 6000 system, which consists of a remote-mounted cam- era sampling pupil location at 240 Hz. A 9-point calibration and 3-point validation procedure was repeated several times to ensure all recordings had a mean spatial error of less than 0.3 deg. Data was controlled by a Pentium4 dual core 3 GHz computer, which
- 3. 320 G. Veneri et al. / Journal of Neuroscience Methods 196 (2011) 318–326 Table 2 Subjects were seated at viewing distance of 78 cm from a 32 in. color monitor (51 cm×31 cm). Subjects Type Problem on motor control Taking medicine GFOD Degenerative cerebellar ataxia Yes and documented Yes MS Degenerative cerebellar ataxia Yes and documented Yes CN Degenerative cerebellar ataxia Yes and documented Yes PP Normal No No GV Normal No No EU Normal No No XM Normal No No SL Normal No No acquired signals through a fast UART serial port. Head movements were restricted using chin rest and bite. The subject was asked to fixate a central red dot; after 500 ms the dot disappeared and the subject could explore the scene, which consisted of simple artificial images (Fig. 1). The fixations were identified by the FDT algorithm developed by Veneri et al. (2010b) and checked manually and updated by an expert. In order to test the despiking algorithm, we selected three patients and five normal subjects (Table 2). 2.1. Computer-generated signal Computer-generated time series were produced by remov- ing high level frequencies by window-average filter (window = 10 samples) from 20 randomly selected signals of healthy sub- jects and adding white noise having a signal-to-noise ratio SNR = 20 log 10(Asignal/Anoise) ∈ (20 dB, 40 dB); we call this signal «. Then, from one to ten spikes were added to the signal « in random positions; we call this signal «s. The spikes had a dura- tion of 80 ms (∼=20 samples) and amplitude A+ spike ∈ (0, 600 px), A− spike ∈ (−600 px,0). Eq. (1) is the formula for spikes: f (t) = A+ spike triang(t, t0, t1) ∀t ∈ (t0, t1) A− spike triang(t, t1, t2) ∀t ∈ (t1, t2) (1) where triang is the triangular function. After despiking («ds) we calculated the ratio of removed spikes to spikes added to the signal by Eq. (2). We evaluated Eq. (2) for all t (˘) and for all t in spikes (˘spike). ˘ = t («s(t)) 2 − «(t) («ds(t) − «(t)) 2 · 100% (2) Eq. (2) is the ratio of “spikes removed” to “spikes added” expressed as a percentage. 2.2. Analyzing differences between groups The ˘ was used to build two small groups of 10 × 2 computer- generated time series with SNRg1 = 1.1 · SNRg2. We applied the parametric Holm–Sidak procedure, and we evaluated the F func- tion (variance between items/variance within items) to compare patients and subjects and to evaluate the application of WS. 3. Theory Fourier analysis is a popular technique for processing signal content. It has the disadvantage of losing time information after transforming a signal into the frequency domain. To obviate this difficulty, the windowed Fourier transform (WFT) can be used: a truncate window, the sine and cosine functions of which fit a win- dow of a given width. However, a unique window is used for all frequencies in the WFT. The resolution of the analysis is the same over the whole domain and is limited by the size of the window. In wavelet analysis, the window size can be varied. 3.1. Wavelet The wavelet transform (WT) is a time–frequency representation of the signal that has two main advantages over conventional meth- ods: it provides an optimal resolution in the time and frequency domains, and it eliminates the requirement of signal stationarity (Mallat and Hwang, 1992). It is defined as the convolution of the signal x(t) and the wavelet functions a,b: x(t) a,b(t) dt (3) where a,b(t) is the scaled and translated mother wavelet given by Eq. (4): a,b(t) = 1 √ a t − b a a, b ∈ (4) where a and b are the scale and translation parameters, respec- tively. The mother wavelet is a function of finite energy and zero energy (Eq. (5)): see Fig. 2 for a short summary of mother wavelet: (t) dt = 0 (5) Therefore, the WT is usually defined at discrete scales a and discrete times b by choosing the set of parameters: a = 2−j ; b = k2−j j, k ∈ ℵ (6) Then, by correlating the original signal with wavelet functions at a discrete size and level a, b we obtain details dj of the signal at several scales. This procedure can be organized in a hierarchical way called multiresolution or multilevel wavelet decomposition 0 0.5 1 1.5 −2 0 2 db1 0 1 2 3 −2 0 2 db2 0 5 10 −2 0 2 coif2 0 1 2 3 −2 0 2 sym2 0 0.5 1 −0.5 0 0.5 1 bior1.1 decomposition 0 0.5 1 −2 −1 0 1 bior1.1 reconstruction Fig. 2. Wavelets of five different wavelet families. Other families: Morlet, Mexican hat and Meyer.
- 4. G. Veneri et al. / Journal of Neuroscience Methods 196 (2011) 318–326 321 (MWT; Mallat, 1989). The multilevel decomposition separates the signal into details at different scales and a coarser representation of the signal named “approximation”. The MWT at level l of decom- position extracts the coefficients {d1, . . ., dl+1}, where dl+1 is the approximated coefficients and represents overall signal trend, and dj is the detailed coefficient and represents the rapid variations in the signal: d1, . . ., dl are the decompositions at various levels of frequency, from low to high, respectively. Due to the hierarchical characteristic of the MWT, the approximated coefficients can be reconstructed by {dj, . . ., dl, dl+1} coefficients. 3.2. Spike removal—despiking Besides applications in these fields, the wavelet transform has been applied to recognition of signal discontinuities. One of the most interesting applications involves its ability to recognise spikes (Nenadic and Burdick, 2005). The basic principle proposed by Donoho and Johnstone (1994) is based on rejecting or accepting (if we need to identify the spike) only those wavelet coefficients that exceed a threshold, followed by the inverse wavelet transform (inverse hard thresholding). ˘dj = dj if |dj| ≤ thj 0 otherwise (7) The threshold is computed by Eq. (8): thj = j 2 loge N (8) where N is the number of samples and j is the standard deviation of noise. The standard deviation j must be estimated from the coef- ficients d1: the basic idea is to consider noise to be Gaussian, which may not hold in general, and the detailed coefficients of the finest scale (such as d1) are assumed to be essentially noise coefficients with standard deviations equal to (Ehrentreich and Sümmchen, 2001; Sharma et al., 2010; Kamavuako et al., 2010). Under these assumptions it can be shown that the median of its absolute devi- ation j = median( | d1 |)/0.6745 effectively estimates the standard deviation. It is easy to prove that for a zero mean Gaussian distribu- tion the median should be ≈ · 0.6745 (Nenadic and Burdick, 2005, Appendix 1). Finally, it is important to choose a mother wavelet that is suit- able for the signal of interest. Quiroga et al. (2004) applied a db1 or coif2 wavelet at four levels. The choice is motivated by the shape of the spike which should be approximated by an db1 or coif2 wavelet at the high level. In the current context, it is impossible to make any assumptions. 3.3. Wavelet entropy Given {c1,t, . . ., cl+1,t} = {d1(t), . . ., dl+1(t)} the mean energy is El,k = k0+ t t=k0 c2 l,t N (9) where k0 = 1, 1 + t, 1 + 2 t, . . . and N is the number of wavelet coefficients in the time window. Ek = l El,k (10) and the probability distribution for each level can be defined as pl,k = El,k Ek (11) from the definition of entropy given by Shannon (1948), the time- varying wavelet entropy (Blanco et al., 1998) WSk = − l pl,k · log2 pl,k (12) and the WS is the mean of Eq. (12). 4. Calculations As shown in Ehrentreich and Sümmchen (2001) and Quiroga et al. (2004), we applied the method of Eq. (7) to gaze signals of patients. When we needed to eliminate spikes with high precision to reconstruct the signal, the despiking worked well, but not as well as we wanted; in particular, the application of Eq. (7) with MWT at a low level of decomposition affected saccades, and at a high level of decomposition the spikes were “spread” over more detailed coefficients dj. The key idea was to set the level of decomposition of MWT to the maximum level lmax 1 admissible by the algorithm and to apply Eq. (7) for j = 1, . . ., loptim and for j = median( | dj |)/0.6745, where loptim < lmax must be estimated. 4.1. Choosing the correct optimum level To find the optimum level, we decomposed the signal at the maximum level in order to separate saccades and spikes as much as possible and to find the loptim that maximized the ratio of “spikes removed” to “signal preserved”. An interesting characteristic of WT is the ability to maintain the relationship between signals: if a relation exists between x and y, the WT(x) has the same relation with WT(y). In eye tracking, we recorded the position of an eye along x and y. van Beers (2007) found an interesting correlation between x and y during saccades, and we confirmed this result: the local covariance between x and y was high during spike and saccade (see Fig. 3). Thanks to the physiological characteristics of ocular motor signals, we used the variance and specifically the covariance between x and y to define loptim. We choose: loptim = ∀j ∈ (1,lmax) argmin(j − 1) : covw(x, y) − covw(dxj, dyj) ≤ 0 ∨ covw(dxj, dyj) − covw(dxj−1, dyj−1) ≤ 0 (13) where ||◦ | | is the median and covw(x, y) = |diag1,2 (cov(x(t0, t1), y(t0, t1))) | t0 = t − w 2 , t1 = t + w 2 (14) and w is larger than spike or saccade duration. Since the mean saccade duration is ≈ 30 ms, w = 40 ms should be a good value. In other words, despiking by Eq. (7) was stopped when the median of covariance of detailed coefficients ˘dx, ˘dy was more than the median covariance of the signal or less than the covariance of ˘dx, ˘dy at j − 1. Algorithm A.1 describes the implemented pro- cedure. Intuitively, the algorithm proceeds to despike from level 1 to the optimum level until the information removed is no longer significant (condition 1) or there is no meaningful information to be removed (condition 2). 1 See function wmaxlev of Mathworks (2007).
- 5. 322 G. Veneri et al. / Journal of Neuroscience Methods 196 (2011) 318–326 Fig. 3. (a) Signal of patient CN (samples 1500–3000). A spike is a rapid change on the signal that can be confused with a saccade, which represents eye movements. (b) Covariance x, y of signal of patient CN. (c) Spikes s1 and s2 on the signal are easy to identify by WT: reconstructing the signal by detail coefficient d1, spikes were more evident than saccades and hard thresholding was applied; unfortunately, to remove spikes as much as possible and to preserve saccades, extension to the other dj s with j > 1 was necessary. (d) Evaluating the ratio between the covariance on detailed coefficients and the covariance of the signal (graph (b)), the procedures identified the level j where to apply hard thresholding. 4.2. Using wavelet entropy for noise analysis A ten order MWT was used to separate the signal by scale, and we removed the main component of spikes from detailed coefficients according to the method of Eq. (7). Then we applied the entropy formula to the detailed coefficients to estimate the motor control noise: WS was applied to each component x and y of the recorded signal using bi-orthogonal splines and a time window t = 400 ms (at least 100 points; Eq. (12)), but we only evaluated the mean of WSk for linf ≤ lmax + 1 scales, where l = lmax = 10 was the level at which the signal was decomposed: WS = linf k=1 WSk linf (15) linf was chosen according to linf = ∀j ∈ (1,lmax) argmax(j) : cov( dxj, dyj) cov(x, y) ≤ 0.05 (16) where cov(x, y) = |diag1,2(cov(x, y))|. From an intuitive point of view, we calculated WS only on coefficients from level 1 to level linf, where linf was the maximum level at which x and y covariance was less than 5% of complete signal covariance. 5. Results and discussion 5.1. Experiment 1: computer-generated case We tested the algorithm on a computer-generated time series built as described in Section 2.1. We used the mother wavelet shown in Fig. 2. Results did not report any correlation between performance (Eq. (2)) and the level of noise or amplitude of spikes (Table 3). This means that the algorithm is sufficiently robust to noise and spike amplitude. Performance varied from 88% (db1) to 92% (coif2). The algorithm preserved the signal and only removed 3–1% of the original signal «. Wevelt entropy, WS, defined in Eq. (15), was tested in a small 20 × 2 sample of two groups of computer-generated time series « made by adding white noise to filtered signals with different SNR derived from subjects ( SNR = 10% · SNRg2). The implemented procedure proved to estimate 94.8% of the white noise entropy for SNR = 20 dB and 91.01% for SNR = 40 dB. The maximum performance (≈111% of the mean) of Eq. (15) was obtained for linf ∈ (2, 5) and lmax = 10. It provided evidence that WS may be a good candidate for estimating motor control noise. Fig. 4 shows the trend of p-values and F over x and y varying SNR and the level of approximated coefficients: we found a significant difference (p < 0.05) between groups when WS was estimated for detailed coefficients from level 5 to 2 (linf ≈ 5). We obtained a highly significant difference (p < 0.001) for high SNR, which can be explained as the native property of WS to mea- sure the microscopic disorder within the system. 5.2. Experiment 2: patients analysis We applied the despiking algorithm, implemented by “db1” ten levels, to the subjects of Table 2. Fig. 5 shows the differences between signal covariance and detailed coefficients of level 1, 2, 3 and Table 4 reports loptim calculated by Eq. (16). The signals of subjects EU and PP did not report any spikes, and the algorithm only applied the hard thresholding to PP, but without any consequence. In the case of EU, the procedure skipped the hard thresholding. The procedure also worked well on normal subjects SL, GV and XM (Fig. 6). In the case of patients GFOD (Fig. 7), MS and CN (Fig. 8), the procedure removed spikes, but on grouped spikes, such as Table 3 Performance of the algorithm with different mother wavelets. The best performance was obtained through coif2 and db1. Mother wavelet ˘spike ˘ Regression over noise amplitude Regression over spike amplitude db1 0.835 0.881 p > 0.05 p > 0.05 db2 0.799 0.801 p > 0.05 p > 0.05 coif2 0.901 0.954 p > 0.05 p > 0.05 sym2 0.795 0.911 p > 0.05 p > 0.05
- 6. G. Veneri et al. / Journal of Neuroscience Methods 196 (2011) 318–326 323 10 −6 10 −4 10 −2 10 0 ← SNR = 20dB p−valuex(logscale) ← SNR = 40dB 10−6 10−4 10−2 100 ← SNR = 20dB p−valuey(logscale) ← SNR = 40dB 12345678910l+1 0 10 20 30 F x (1,38) level 12345678910l+1 0 10 20 30 F y (1,38) level 5% p−mean p−max/min Fig. 4. Ability of wavelet entropy to discriminate two groups of 10 × 2 computer-generated time series having different signal to white noise ratio ( SNR = 10% · SNRg2). We varied signal to noise ratio and the level of detailed coefficients where WS was calculated. The maximum partition was found for linf ∈ (2, 5). 1 2 3 −10 0 10 30 level Δ cov patient MS patient CN patient GFOD normal PP normal GV normal EU normal XM normal SL Fig. 5. Differences of covariance of patients and healthy subjects defined by Eq. (13). the last part of GFOD’s signal, it was unable to reconstruct the signal. When a harder despiking is required, it is possible to apply a simple median filter on spikes identified by the procedure (see Fig. 8). Statistical analysis of patients and subjects (Fig. 9) reported sig- nificant differences on the x and y axes for WS applied to coefficients from 8 to 1 (Fx = 5.29, Fy = 10.07, px = 0.0003, py = 0.02765) and sig- nificant differences in coefficients linf to 1 as expected, where linf = 5 was chosen according to Eq. (16). The best performance was obtained for linf = 4 or linf = 3 (px < 0.01, py < 0.01): Fig. 10c shows the scatter diagram and probability dis- tribution for linf = 4 and is a further evidence that the procedure Table 4 Optimum level of subjects according to Eq. (16). Subjects loptim Spikes MS 2 Small sparse CN 2 Small sparse spikes GFOD 2 Small sparse and grouped spikes PP 1 None GV 1 Sparse spikes EU 0 None XM 2 Small sparse spikes only on Y SL 2 Small sparse and grouped spikes 4 4.1 4.2 4.3 4.4 4.5 4.6 x 10 4 200 400 600 800 normal XM x(px) time (ms) 4 4.1 4.2 4.3 4.4 4.5 4.6 x 10 4 200 400 600 y(px) time (ms) original despiked s1 s2 s4 s5 l1 s3 Fig. 6. Healthy subject XM. Group of spikes s1, s2, s3, a large spikes s4 and s5 are highlighted in the figure; small signal 11 was loss of pupil. There were no spikes on x and the signal remained unchanged. 4 4.2 4.4 4.6 4.8 5 x 10 4 200 400 600 800 1000 patient GFOD x(px) time (ms) 4 4.2 4.4 4.6 4.8 5 x 10 4 200 400 600 y(px) time (ms) original despiked s1 s3 s2 s4 s1 s2 s4 s3 Fig. 7. Patient GFOD. The implemented technique removed sparse spikes s1, s2 and s3 well, but was unable to reconstruct the signal on grouped spikes s4.
- 7. 324 G. Veneri et al. / Journal of Neuroscience Methods 196 (2011) 318–326 1000 2000 3000 4000 5000 6000 7000 8000 0 500 1000 time (ms) position(px) 1000 2000 3000 4000 5000 6000 7000 8000 0 500 1000 despiking by median filtering after the recognition of spikes time (ms) position(px) original despiking by median filtering Fig. 8. (Top) x data of patient CN after application of the method; the magnified boxes show two spikes not completely removed by the procedure. (Bottom) x data of patient CN after application of the median filter to spikes identified by hard thresh- olding; the same two spikes were completely removed but the filter caused artefacts on saccades. 145l+1 10 0 p−value(logscale) 145l+1 0 10 20 30 F(1,34)value 12345678910l+1 −1 0 1 2 cov 1,2 level x y x y 5% 1% l inf Fig. 9. Results of statistical analysis of patients and healthy subjects applying WS at various levels of wavelet coefficients. The best separation was found from coef- ficient 4: the approximated coefficient (l + 1) indicated the contribution of visual search exploration and the highly detailed coefficients were influenced by machine recording or saccades. 1.2 1.2 yentropyof{d 1 ,…,d l+1 } x entropy of {d 1 ,…,d l+1 } EU GV PP SL XM CN MSGFOD CTRL SCA2 NDC σ 2σ σ (a) 0.8 0.8 yentropyofd 1 x entropy of d 1 EU GV PP SL CN MS GFOD σ σ 2σ (b) pdfx pdfy 1.3 1.35 1.4 1.45 1.5 1.55 1.6 1.65 1.7 1.35 1.4 1.45 1.5 1.55 1.6 1.65 1.7 1.75 yentropyof{d1 ,…,d4 } x entropy of {d1 ,…,d4 } EU GV PP SL XM CN MS GFOD CTRL SCA2 NDC (c) Fig. 10. Scatter diagram of WS. In order to estimate motor control noise, we applied wavelet entropy (WS). (a and b) t-Test of WS applied to entire signal (using all coefficients) and d1 coefficients did not find any significant difference between patients and healthy subjects (p > 0.05). (c) t-Test analysis and post hoc Holm–Sidak procedure on WS applied to coefficients d1, . . ., d4 showed a significant difference on x (px < 0.01) and y (py < 0.01) between patients and healthy subjects. Probability distributions over x (pdfx) and y (pdfy) were calculated by kernel density (Bowman and Azzalini, 1997). Similar results were found for WS applied to coefficients d1, . . . , dlinf with linf = 5 (px < 0.05, py < 0.01).
- 8. G. Veneri et al. / Journal of Neuroscience Methods 196 (2011) 318–326 325 150 200 250 300 350 120 140 160 180 200 220 240 260 280 300 σy σ x 0 0.2 0.4 0.6 −0.2 0 0.2 0.4 0.6 0.8 1 σ y onfixations σ x on fixations Fig. 11. Standard deviation evaluated on the entire signal or only on the fixation. No significant difference (p > 0.05) was found between groups. Standard deviation cannot be used to evaluate motor control noise on visual search. successfully separated normal subjects and patients, and especially subjects and SCA2. The correlation between entropy over x and y provided further evidence of the method’s efficacy. No significant difference was found using the approximated coefficients of d1, . . ., dl+1 (Fig. 10a) and only at level 1 (Fig. 10b). We argue that motor control noise had no contributions at high frequencies or was difficult to estimate, confirming the hypothe- sis that the coefficients d1, . . ., d2 were influenced by the machine recording or the saccades; on the contrary, the approximated coef- ficients d11 = dl+1 and less detailed coefficients d9, d10 only indicated the variability of visual search exploration. The group NDC did not have a uniform distribution and post hoc analysis did not find any significant difference: we found similar results in a pro-saccade test not yet published. No differences were found in the variance, particularly within fixations variance, which could be a good candidate for estimating additive motor control noise (Fig. 11).We could not make any assumptions about the role of additive noise and signal-dependent noise. Indeed, SCA2 is known to affect movement, due to the role of the cerebellum, but not the process of fixation. We obtained results similar to those of the test of simulated cases (Fig. 4). 6. Conclusions We used the multiscale wavelet transform to remove spikes, verifying that our algorithm, based on the work of Donoho and Johnstone (1994), can be applied to eye-tracking and signals of patients. We implemented an easy procedure for “fine despik- ing” and preserving signal characteristics as well as physiological motor control noise. When the procedure was tested on computer- generated signals and those of healthy subjects, despiking proved to remove the 90% of spikes. It allowed us to investigate the role of the cerebellum in motor control, avoiding artefacts due to spikes. We then estimated the motor control noise by wavelet entropy during visual search: the procedure differentiated patients from controls on y and x, y when applied to coefficients from 8 to 1 and from 4 to 1, respectively. The ability to measure motor control noise made it possible to investigate the role of the cerebellum in free visual search in our current research. Our preliminary results, not yet published, sug- gest that humans adapt exploration in order to reduce “saccade energy”. The present method will be used to verify this hypothesis. Future research will be addressed to mother wavelet construc- tion to discover characteristic signals, such as square jerks and microsaccades: correntropy applied to wavelet transform may be useful to identify important waveforms in fixations. Correntropy is defined as a generalization of correlation of random processes, avoiding any assumption of Gaussian distribution (Liu et al., 2007). It can be used to identify the correlation between x and y during fixation and therefore “small synchronization” of motor control, providing a quantitative measure of physiological noise. Acknowledgments The authors would like to thank the editor and reviewers for improvements and suggestions, and Helen Ampt for the formal improvements. Appendix A. Algorithm Algorithm A.1. This algorithm describes the implemented pro- cedure. WTDECOMPOSITION and WTRECONSTRUCTION are the wavelet decomposition and reconstruction. HARDTHRESHOLDING are the function that implements Eq. (7). COVw is the covariance of two signals on window w. covxy ← median(COVw(x, y)) cAx, dx ← WTDECOMPOSITION(x, lmax) cAy, dy ← WTDECOMPOSITION(y, lmax) for j = 1 to lmaxdo covdxdy ← median(COVw(dxdy)) pcovxy ← covdxdy if covxy − covdx(j)dy(j) < 0 or covdx(j)dy(j)−p covxy < 0then break end if dx(j) ← HARDTHRESHOLDING(dx(j)) dy(j) ← HARDTHRESHOLDING(dy(j)) p covxy ← covdx(j)dy(j) end for x ← WTRECONSTRUCTION(cAx, dx, lmax) y ← WTRECONSTRUCTION(cAy, dy, lmax) Appendix B. Supplementary data Supplementary data associated with this article can be found, in the online version, at doi:10.1016/j.jneumeth.2011.01.006. References Abel LA, Wang ZI, Dell’Osso LF. Wavelet analysis in infantile nystagmus syndrome: limitations and abilities. Invest Ophthalmol Vis Sci 2008;49(8):3413–23. van Beers RJ. The sources of variability in saccadic eye movements. J Neurosci 2007;27(33):8757–70. van Beers RJ. Saccadic eye movements minimize the consequences of motor noise. PLoS One 2008;3(4):1–8. van Beers RJ. Motor learning is optimally tuned to the properties of motor noise. Neuron 2009;63(3):406–17. Blanco S, Figliola A, Quiroga RQ, Rosso OA, Serrano E. Time–frequency analysis of electroencephalogram series. iii. Wavelet packets and information cost function. Phys Rev E 1998;57(1):932–40. Bollen E, Bax J, van Dijk JG, Koning M, Bos JE, Kramer CG, et al. Variability of the main sequence. Invest Ophthalmol Vis Sci 1993;34(13):3700–4. Bowman AW, Azzalini A. Applied smoothing techniques for data analysis. Oxford University Press; 1997. Bürk K, Fetter M, Abele M, Laccone F, Brice A, Dichgans J, et al. Autosomal dominant cerebellar ataxia type i: oculomotor abnormalities in families with sca1, sca2, and sca3. J Neurol 1999;246(9):789–97. Coifman RR, Wickerhauser MV. Entropy based algorithms for best basis selection. IEEE Trans Inform Theory 1992;32:712–8. Corbetta M, Kincade JM, Shulman GL. Neural systems for visual orienting and their relationships to spatial working memory. J Cogn Neurosci 2002;14(3):508–23. Donoho DL, Johnstone JM. Ideal spatial adaptation by wavelet shrinkage. Biometrika 1994;81(3):425–55. Duchowski AT. A breadth-first survey of eye-tracking applications. Behav Res Meth- ods Instrum Comput 2002;34(4):455–70. Ehrentreich F, Sümmchen L. Spike removal and denoising of aman spectra by wavelet transform methods. Anal Chem 2001;73(17):4364–73. Engbert R, Kliegl R. Microsaccades uncover the orientation of covert attention. Vision Res 2003;43(9):1035–45. Filla A, Michele GD, Campanella G, Perretti A, Santoro L, Serlenga L, et al. Autosomal dominant cerebellar ataxia type i. Clinical and molecular study in 36 Italian
- 9. 326 G. Veneri et al. / Journal of Neuroscience Methods 196 (2011) 318–326 families including a comparison between sca1 and sca2 phenotypes. J Neurol Sci 1996;142(1–2):140–7. Fischer BM, Biscaldi PO. Saccadic eye movements of dyslexic adults. Neuropsycholo- gia 1993;31:887–906. Girard B, Berthoz A. From brainstem to cortex: computational models of saccade generation circuitry. Prog Neurobiol 2005;77(4):215–51. Inouye T, Shinosaki K, Iyama A, Matsumoto Y. Localization of activated areas and directional EEG patterns during mental arithmetic. Electroencephalogr Clin Neurophysiol 1993;86(4):224–30. Juhola M, Jäntti V, Pyykkä I, Schalén L, Akesson M, Magnusson M. An identifica- tion technique for the spike artefact of saccadic eye movements. Biol Cybern 1987;57(6):415–20. Kamavuako EN, Jensen W, Yoshida K, Kurstjens M, Farina D. A criterion for signal- based selection of wavelets for denoising intrafascicular nerve recordings. J Neurosci Methods 2010;186(2):274–80. Kamavuako EN, Yoshida K, Jensen W. Variance-based signal conditioning tech- nique: comparison to a wavelet-based technique to improve spike detection in multiunit intrafascicular recordings. Biomed Signal Process Contr 2009;4(2): 118–26. Leigh RJ, Kennard C. Using saccades as a research tool in the clinical neurosciences. Brain 2004;127(Pt 3):460–77. Leigh RJ, Zee D. The neurology of eye movements (Book/DVD). 4th ed. New York: Oxford University Press; 2006. Liu W, Pokharel PP, Principe JC. Correntropy: properties and applications in non-Gaussian signal processing. IEEE Trans Signal Process 2007;55(11):5286– 98. Mallat S, Hwang WL. Singularity detection and processing with wavelets. IEEE Trans Inform Theory 1992;38(2):617–43. Mallat SG. A theory for multiresolution signal decomposition: the wavelet repre- sentation. IEEE Trans Pattern Anal Mach Intell 1989;11(7):674–93. of Mathworks M. Matlab 7.5 for windows, wavelet toolbox; 2007. Nenadic Z, Burdick JW. Spike detection using the continuous wavelet transform. IEEE Trans Biomed Eng 2005;52(1):74–87. Quiroga RQ, Nadasdy Z, Ben-Shaul Y. Unsupervised spike detection and sorting with wavelets and superparamagnetic clustering. Neural Comput 2004;16(8): 1661–87. Quiroga RQ, Rosso OA, Bahar E, Schürmann M. Wavelet entropy in event-related potentials: a new method shows ordering of EEG oscillations. Biol Cybern 2001;84(4):291–9. Ramat S, Leigh RJ, Zee DS, Optican LM. What clinical disorders tell us about the neural control of saccadic eye movements. Brain 2007;130(Pt 1):10–35. Rayner K, Slowiaczek M, Clifton C, Bertera J. Latency of sequential eye movements: implications for reading. J Exp Psychol Hum Percept Perform 1983;9(6):912–22. Salvucci DD, Goldberg JH. Identifying fixations and saccades in eye-tracking proto- cols. In: ETRA ‘00: Proceedings of the 2000 symposium on eye tracking research & applications; 2000. p. 71–8. Shannon CE. A mathematical theory of communication. Bell Syst Tech J 1948;27:379–423. Sharma L, Dandapat S, Mahanta A. ECG signal denoising using higher order statistics in wavelet subbands. Biomed Signal Process Contr 2010;5(3):214–22. Shimojo S, Simion C, Shimojo E, Scheier C. Gaze bias both reflects and influences preference. Nat Neurosci 2003;6(12):1317–22. der Stigchel SV, Meeter M, Theeuwes J. Eye movement trajectories and what they tell us. Neurosci Biobehav Rev 2006;30(5):666–79. Veneri G, Federighi P, Rosini F, Federico A, Rufa A. Influences of data filtering on human–computer interaction by gaze-contingent display and eye-tracking applications. Comput Hum Behav 2010a;26(6):1555–63. Veneri G, Piu P, Federighi P, Rosini F, Federico A, Rufa A. Eye fixations identifica- tion based on statistical analysis—case study. In: 2nd international workshop on cognitive information processing (CIP); 2010b. p. 446–51. Xu-Wilson M, Zee DS, Shadmehr R. The intrinsic value of visual information affects saccade velocities. Exp Brain Res 2009;196(4):475–81. Yarbus AL. Eye movements and vision. volume chapter VII. New York: Plenum Press; 1967. Zunino L, Pérez D, Garavaglia M, Rosso O. Wavelet entropy of stochastic processes. Phys A: Stat Mech Appl 2007;379(2):503–12.