The medial prefrontal cortex to dorsal raphe circuit in the antidepressant action of ketamine
•
0 gefällt mir•405 views

Để xem full tài liệu Xin vui long liên hệ page để được hỗ trợ : https://www.facebook.com/thuvienluanvan01 HOẶC https://www.facebook.com/garmentspace/ https://www.facebook.com/thuvienluanvan01 https://www.facebook.com/thuvienluanvan01 tai lieu tong hop, thu vien luan van, luan van tong hop, do an chuyen nganh

Empfohlen
Empfohlen
Weitere ähnliche Inhalte
Was ist angesagt?
Was ist angesagt? (20)
Ähnlich wie The medial prefrontal cortex to dorsal raphe circuit in the antidepressant action of ketamine
Ähnlich wie The medial prefrontal cortex to dorsal raphe circuit in the antidepressant action of ketamine (20)
Mehr von TÀI LIỆU NGÀNH MAY
Mehr von TÀI LIỆU NGÀNH MAY (20)
Kürzlich hochgeladen
Kürzlich hochgeladen (20)
The medial prefrontal cortex to dorsal raphe circuit in the antidepressant action of ketamine
- 1. Yale University Yale University EliScholar – A Digital Platform for Scholarly Publishing at Yale EliScholar – A Digital Platform for Scholarly Publishing at Yale Yale Medicine Thesis Digital Library School of Medicine 1-1-2019 The Medial Prefrontal Cortex To Dorsal Raphe Circuit In The The Medial Prefrontal Cortex To Dorsal Raphe Circuit In The Antidepressant Action Of Ketamine Antidepressant Action Of Ketamine Alexandra Thomas Follow this and additional works at: https://elischolar.library.yale.edu/ymtdl Part of the Medicine and Health Sciences Commons Recommended Citation Recommended Citation Thomas, Alexandra, "The Medial Prefrontal Cortex To Dorsal Raphe Circuit In The Antidepressant Action Of Ketamine" (2019). Yale Medicine Thesis Digital Library. 3538. https://elischolar.library.yale.edu/ymtdl/3538 This Open Access Thesis is brought to you for free and open access by the School of Medicine at EliScholar – A Digital Platform for Scholarly Publishing at Yale. It has been accepted for inclusion in Yale Medicine Thesis Digital Library by an authorized administrator of EliScholar – A Digital Platform for Scholarly Publishing at Yale. For more information, please contact elischolar@yale.edu.
- 2. The Medial Prefrontal Cortex to Dorsal Raphe Circuit in the Antidepressant Action of Ketamine A Thesis Submitted to the Yale University School of Medicine in Partial Fulfilment of the Requirements for the Degree of Doctor of Medicine By Alexandra Moran Thomas Dissertation Director: Ronald S. Duman, Ph.D. May 2019
- 3. ii ABSTRACT Major depressive disorder is a common and debilitating illness for which there is a notable lack of efficient, effective treatment. While currently available pharmacotherapies typically take eight weeks to take effect and fail to do so at all for about a third of patients, the N-methyl-D-aspartate (NMDA) receptor antagonist ketamine has shown a much more favorable effectiveness profile, including improvements in symptoms within hours of administration, even for many patients who do not respond to typical antidepressants. Ketamine, as a modulator of glutamate signaling in the brain, has a distinct mechanism of action from the serotonin and norepinephrine modulators that are currently the mainstay of depression treatment. This dissertation seeks to contribute to the understanding of this unique mechanism, and particularly the brain circuits affected. Rodent studies have shown that ketamine induces a burst of glutamatergic activity in the medial prefrontal cortex (mPFC), which is necessary to produce its antidepressant effect. The downstream targets of this glutamatergic activity that are relevant to the ketamine antidepressant effect are unclear, but recent research has suggested a role for the dorsal raphe nucleus (DRN), which contains most of the brain’s serotonin-producing cells. In this thesis, I first provide a synthesis of the literature on the mechanism of ketamine’s antidepressant effect and the neural circuits that might underlie it. I then investigate the projection from the mPFC to the DRN using optogenetic stimulation of mPFC-originating axon terminals in the DRN, finding that activation of this pathway produces an antidepressant effect on the forced-swim test (FST), which measures “behavioral despair” induced by a stressful environment, but not on other measures of depression-like behavior. I also perform immunohistochemical studies of the DRN, which indicate that both serotonergic and non-serotonergic cells are
- 4. iii activated by this stimulation. I then find additional support for this behavioral selectivity using a pharmacological approach: by inhibiting serotonin release during ketamine administration, I find that DRN activity is needed for the antidepressant effect of ketamine on the FST but not on other behavioral tests. Finally, I interrogate the projection from the mPFC to the nucleus accumbens using the same optogenetic approach as before. These experiments show that activation of the mPFC-to-DRN pathway produces an antidepressant effect on a particular subset of depression-like behavior and supports a role for serotonin signaling in the behavior measured by the FST.
- 5. iv © Alexandra Moran Thomas All rights reserved.
- 6. v TABLE OF CONTENTS ACKNOWLEDGEMENTS .............................................................................. vi LIST OF FIGURES .......................................................................................viii LIST OF ABBREVIATIONS.......................................................................... ix CHAPTER 1: The neural and molecular mechanisms of the antidepressant effect of ketamine................................................................1 1.1. Brain pathology in depression...................................................................................... 1 1.2. Mechanism of action of currently available antidepressants ....................................... 5 1.3. Mechanism of action of ketamine................................................................................ 7 1.4. Neural circuits involved in the function of rapid-acting antidepressants................... 15 1.5. Aims ........................................................................................................................... 17 CHAPTER 2: Optogenetic stimulation of mPFC-originating axon terminals in the dorsal raphe nucleus produces an antidepressant effect..................................................................................................................18 2.1. Introduction ............................................................................................................... 18 2.2. Methods ..................................................................................................................... 21 2.3. Results........................................................................................................................ 26 2.4. Discussion................................................................................................................... 36 CHAPTER 3: Inhibition of DRN serotonin release inhibits the antidepressant effect of ketamine..............................................................42 3.1. Introduction ............................................................................................................... 42 3.2. Methods ..................................................................................................................... 43 3.3. Results........................................................................................................................ 47 3.4. Discussion................................................................................................................... 52 CHAPTER 4: Optogenetic stimulation of infralimbic-originating terminals in the nucleus accumbens does not produce an antidepressant effect.....................................................................................55 4.1. Introduction ............................................................................................................... 55 4.2. Methods ..................................................................................................................... 56 4.3. Results........................................................................................................................ 60 4.4. Discussion................................................................................................................... 62 CHAPTER 5: Conclusions and future directions....................................65 BIBLIOGRAPHY.............................................................................................70
- 7. vi ACKNOWLEDGEMENTS I have been fortunate to have many mentors, close friends, and family members who have supported me on my journey through graduate school. First among them is my advisor, Ron Duman, who has helped me develop and execute this dissertation at every step, and whose immense patience and kindness along the way has modeled for me how a good mentor should be. Yale as a whole has provided a wonderful environment in which to develop as a scientist and physician, and particularly the psychiatry department. I have greatly benefited from the input and expertise of my thesis committee, Ralph DiLeone, Marina Picciotto, and Alex Kwan; and from the depth and breadth of knowledge of my oral exam readers, John Krystal, Jane Taylor, and Angelique Bordey. The leadership and staff of the MD/PhD program has provided indispensable guidance on this long road, most notably Barbara Kazmierczak, Jim Jamieson, Cheryl Defilippo, and Sue Sansone; and the leadership of the MD program and Interdepartmental Neuroscience Program have been patient and helpful in navigating the transition from medical school to grad school and back again, especially Nancy Angoff, Michael O’Brien, Charlie Greer, Carol Russo, and Donna Carranzo. I am also grateful to the National Institute of Mental Health for the F30 grant that financed a portion of this work. My development as a scientist has been influenced by many collaborators and colleagues. George Aghajanian and Rong-Jian Liu, as well as Ben Land and Rich Trinko of the DiLeone lab, were wonderful
- 8. vii collaborators when I started my project. Manabu Fuchikami taught me nearly every technique I used in this project with care and diligence. I have learned from and gotten vital assistance from many members of the Duman lab, which made it a great place to go to work everyday: particular thanks to Kenichi Fukumoto, Brendan Hare, and Taro Kato, who directly contributed to some of the experiments in this dissertation; as well as Mouna Banasr, Astrid Becker, Cathy Duman, Jason Dwyer, Tina Franklin, Danielle Gerhard, Matthew Girgenti, Sri Ghosal, Ashley Lepack, Xiao-Yuan Li, Georgia Miller, Rose Terwiliger, Manmeet Virdee, and Eric Wohleb. I have been blessed with an immensely supportive family, who have always trusted that I would make it to the finish line, even when I doubted it myself. I remember especially those who passed away during these years and whose love and encouragement I still carry with me: my uncle Monte Sliger, stepmom Sandy Thomas, grandmother Bertine Sliger, and especially my dad, George Thomas. I continue to be uplifted by my mother Janice Sliger, brother Luke Thomas and his wife Joanie, and the very best family-in- law: Joan Russo, Donald Burset, Stephanie Burset, and Charlie King. Finally, the best decision I made during grad school was to marry Christian Burset, who has picked me up and pulled me through even the toughest parts of the last five years with his love and patience. I am especially thankful that our most ambitious collaborative project, our son Dominic, was completed in perfect form, needing not a single revision, almost simultaneously with this thesis.
- 9. viii LIST OF FIGURES Figure 1.1 Mechanisms of synapse loss in depression …………………………..6 Figure 1.2 Signaling pathways involved in the response to rapid-acting antidepressants ………………………………………………………...10 Figure 2.1 Distribution of GFP-labeled ChR2 throughout the brain…………26 Figure 2.2 DRN axon-terminal stimulation produces an antidepressant effect on the FST ………………………………………………………………28 Figure 2.3 DRN axon-terminal stimulation had no effect on the NSFT, FUST, or 7-day post-stimulation FST ……………………………………….31 Figure 2.4 Cannula placement and viral expression in the mPFC and DRN………………………………………………………………………33 Figure 2.5 c-Fos activation is increased in the DRN but not in the ilPFC in response to DRN axon-terminal stimulation ………………………35 Figure 2.6 Stimulation induces c-Fos expression in non-TPH2-expressing cells ……………………………………………………………………….36 Figure 3.1 8OH-DPAT blocks the antidepressant effect of ketamine on the FST ……………………………………………………………………….47 Figure 3.2 Ketamine increases swimming, not climbing, on the FST ……….49 Figure 3.3 8OH-DPAT does not interfere with the effect of ketamine on the NSFT …………………………………………………………………….50 Figure 3.4 Depression-like behavior is higher in control groups when drugs are administered by a male experimenter than by a female experimenter ……………………………………………………………52 Figure 4.1 ChR2 expression in the nucleus accumbens after viral injection into the mPFC ………………………………………………………….60 Figure 4.2 Stimulation of mPFC-originating NAC axon terminals does not produce an antidepressant effect ……………………………………62
- 10. ix LIST OF ABBREVIATIONS 8OH-DPAT, 8-hydroxy-n,n-dipropylaminotetralin AMPAR, α-amino-3-hydroxy-5-methyl-4-isoxazolepropionic acid BDNF, brain-derived neurotrophic factor DBS, deep brain stimulation DRN, dorsal raphe nucleus DSM, Diagnostic and Statistical Manual of Mental Disorders eEf2K, eukaryotic elongation factor-2 kinase GABAR, l-aminobutyric acid receptor GSK, glycogen synthase kinase HNK, hydroxynorketamine; mAchR, muscarinic acetylcholine receptor LHB, lateral habenula MDD, Major Depressive Disorder mGluR, metabotropic glutamate receptor mPFC, medial prefrontal cortex MSN, medium spiny neuron mTORC1, mammalian target of rapamycin complex 1 NAC, nucleus accumbens NMDAR, N-methyl-D-aspartate receptor SNRI, selective norepinephrine-reuptake inhibitors SSRI, selective serotonin-reuptake inhibitors TrkB, tropomysin receptor kinase B VDCC, voltage-gated calcium channel
- 11. 1 CHAPTER 1: The neural and molecular mechanisms of the antidepressant effect of ketamine This chapter contains a modified version of material that appeared in the author’s publication: Alexandra Thomas & Ronald Duman. 2017. Novel rapid-acting antidepressants: molecular and cellular signaling mechanisms. Neuronal Signaling, 1(4): 1-10. 1.1. Brain pathology in depression Major Depressive Disorder (MDD) affects an estimated 5% of the global population at any given time, and it is the leading cause of disability worldwide (Ferrari et al., 2013). In addition to the high toll of personal suffering it exacts, depression drains over $50 billion per year from the US economy alone in lost work productivity and medical costs (P. S. Wang, Simon, & Kessler, 2003). Despite the widespread need for effective treatment, currently available antidepressants often take 6-8 weeks to take effect, and only one-third of patients respond to their first trial on any given drug. One-third of depressed patients never get relief from typical antidepressants, even after multiple trials (Gaynes et al., 2009). Perhaps the biggest obstacle to the development of better medications has been the lack of understanding of the molecular mechanisms that underlie antidepressant
- 12. 2 effects. But several innovations in the past two decades have begun to reveal answers to this puzzle. First, the drug ketamine, which had long been used in high doses as an anesthetic, was found to have a rapid antidepressant effect in low, sub- anesthetic doses (Berman et al., 2000). It relieves symptoms within hours, even in many patients who have not responded to typical antidepressants. Notably, it acts primarily through a different neurotransmitter, glutamate, than do all currently available antidepressants, which primarily affect the transmission of serotonin and/or norepinephrine. The discovery of the rapid antidepressant action of ketamine and a handful of other drugs has spurred a rethinking of fundamental questions about how antidepressants work, and especially about the role of glutamatergic signaling in antidepressant mechanisms. To aid in this reassessment, new tools in neuroscience have shed light on the intracellular signals and neuronal networks that underlie the effects of rapid-acting agents. In order to understand how antidepressants relieve the symptoms of depression, it is helpful to understand how the brains of depressed people differ from those who are not depressed. This question has been difficult to study due to the wide diversity of clinical presentations that meet criteria for MDD according to the Diagnostic and Statistical Manual of Mental Disorders (DSM) (American Psychiatric Association, 2013). Derangements in a variety of biological processes have been imputed to lead to depression, including inflammation (Iwata, Ota, & Duman, 2012), metabolism (Abdallah et al.,
- 13. 3 2014), and stress-response pathways (Duman, 2014), and it is possible that these mechanisms interact in different ways in different subgroups of patients with MDD. But despite the probable heterogeneity of MDD mechanisms, there seem to be several common features of the depressed state that serve as hallmarks of the depressed brain. Human neuroimaging studies have consistently demonstrated reduced brain volume in key areas associated with mood regulation, including the frontal cortex, cingulate cortex, and hippocampus (Arnone, McIntosh, Ebmeier, Munafò, & Anderson, 2012). Most of the volume reduction occurs in gray matter, and evidence in both humans and animals suggests that loss of glia accounts for most of this effect, and reduction in the size of neurons also plays a role (Rajkowska et al., 1999; Treadway et al., 2015). Reduction in synapse number in the prefrontal cortex has also been found in postmortem tissue of depressed subjects and may also contribute to decreased cortical gray matter volume (Kang et al., 2012). Glial loss may be a consequence of several aspects of the stress response, including excessive release of glutamate caused by high levels of corticosteroids, decreased expression of neurotrophic factors, and increased activation of apoptotic signaling pathways (Banasr, Dwyer, & Duman, 2011). Glia are key regulators of glutamate neurotransmission, and their disruption leads to derangements in glutamatergic signaling that may be ameliorated by rapid-acting antidepressants. Specifically, glia inactivate glutamate signaling by sequestering glutamate after it is released into the
- 14. 4 synapse. With that function compromised, extracellular glutamate levels are elevated (Krystal, Sanacora, & Duman, 2013). This excess glutamate, if present at high enough levels, will bind not only to the post-synaptic α-amino- 3-hydroxy-5-methyl-4-isoxazolepropionic acid (AMPA) and N-methyl-D- aspartate (NMDA) receptors that are its primary target, but also to presynaptic metabotropic glutamate receptors (mGluRs). Activation of these presynaptic metabotropic receptors inhibits synaptic glutamate release, which leads to reduced post-synaptic glutamatergic signaling and ultimately reduced synaptic connectivity (Bonansco et al., 2011). This idea of excess glutamate leading to reduced connectivity accords well with human neuroimaging studies, which have found elevated glutamate levels and reduced functional connectivity in the anterior cingulate cortex (Horn et al., 2010). In addition, depressed patients have higher levels of activity in cingulate area 25, which normalizes after successful treatment with deep- brain stimulation (Mayberg et al., 2005). Excess extracellular glutamate may also have deleterious effects on connectivity by activating extrasynaptic NMDA receptors. Stimulation of these receptors initiates a signaling cascade that may be involved in the mechanism of rapid-acting antidepressants. Key components include the phosphorylation of eukaryotic elongation factor-2 (eEF2) and reduction of brain-derived neurotrophic factor (BDNF) levels, which lead to dendritic atrophy and dendritic-spine loss (Krystal et al., 2013). Induction of REDD1, a negative regulator of the mammalian target of rapamycin complex 1
- 15. 5 (mTORC1) pathway, which is involved in synaptic protein synthesis, has been reported in postmortem PFC of depressed subjects and in rodent chronic stress models and may also contribute to loss of synapses (Ota et al., 2014). The degeneration of dendritic structure is a consistent finding in animal models of depression and corresponds to human studies showing loss of synapses and neuronal atrophy in MDD patients (Kang et al., 2012). This model of glial loss leading to a decrease in connectivity and synaptic function provides important insights into the mechanism of action of rapid-acting antidepressants, which ameliorate those same deficits (Figure 1.1). 1.2. Mechanism of action of currently available antidepressants The research that would eventually lead to the development of the antidepressants in wide use today began in the 1950s, when it was noted that drugs that prevented the reuptake of monoamine neurotransmitters had antidepressant activity, though the exact mechanism remained unclear. As all of these drugs increased synaptic levels of serotonin, norepinephrine, dopamine, or some combination of the three, the prevailing hypothesis was that the increase in monoamine levels was the key to their effectiveness. Based on this monoamine hypothesis, pharmacologists have been able to improve upon the monoamine-oxidase inhibitors and tricyclic
- 16. 6 antidepressants, which were the first monoaminergic antidepressants in use but which often had burdensome side effects due to their relatively non- selective binding profile. The first selective serotonin-reuptake inhibitors (SSRIs) were released in the late 1980s, and they along with selective norepinephrine-reuptake inhibitors (SNRIs) have remained the first-line agents in the treatment of depression (López-Muñoz & Alamo, 2009). Figure 1.1. Mechanisms of synapse loss in depression Stress-induced loss of glia leads to excess extracellular glutamate, as glia normally remove glutamate from the synapse after an action potential. Glutamate then binds to presynaptic metabotropic glutamate receptors (mGluR) to inhibit further synaptic glutamate release, which would normally promote strengthening of synapses by binding postsynaptic AMPA receptors (AMPAR). Glutamate binding to extrasynaptic NMDA receptors (NMDAR) leads to phosphorylation of elongation factor 2 (ElF-2), which inhibits synthesis of brain-derived neurotrophic factor (BDNF), a key promoter of synaptic growth. Stress also leads to induction of REDD1, which inhibits the mammalian target of rapamycin complex 1 (mTORC1). mTORC1 is needed to promote the translation of synaptic proteins necessary for new dendrite formation. Each of these pathways contributes to the loss of synapses and dendritic spines seen in depression.
- 17. 7 Though the monoamine hypothesis became the basis for most drug- discovery efforts in the ensuing forty years, it had shortcomings that were difficult to resolve before advances in the understanding of depression pathophysiology began to emerge over the past two decades. Notably, the most frustrating clinical aspect of monoaminergic drugs, the 6-to-8-week-long delay in the onset of their antidepressant activity, cannot be adequately explained by the monoamine hypothesis, given that the drugs increase monoamine availability after a single effective dose (Sanacora, Treccani, & Popoli, 2012). Clearly, some additional mechanism besides increased monoamine levels mediates the effectiveness of these drugs. The discovery of the rapid-acting antidepressant activity of ketamine, a glutamatergic agent, forced the field to move beyond the monoamine hypothesis to integrate what is known about deficits of plasticity and connectivity in the depressed brain and the effect of rapid-acting agents on these pathways. 1.3. Mechanism of action of ketamine Ketamine, the best-characterized rapid-acting antidepressant, marks a dramatic improvement over monoaminergic agents not only because of its speed of onset but because it often relieves symptoms of depression even in patients who have not responded to other modalities, even including those who do not respond to electroconvulsive therapy and are considered treatment-resistant (Ibrahim et al., 2011). However, it does have drawbacks that limit widespread use. Specifically, it produces dissociative and psychomimetic side effects in the immediate post-administration period (1 to
- 18. 8 2 hours) in a substantial proportion of patients (Berman et al., 2000), and it has abuse potential (especially in higher doses) (Zhang et al., 2014). Even more concerning, users of frequent, high doses of ketamine suffer cortical atrophy and neurotoxicity as assessed by MRI (C. Wang, Zheng, Xu, Lam, & Yew, 2013). In order to harness the impressive antidepressant profile of ketamine, it is important to understand how it functions in the brain in order to apply that knowledge to develop new therapies that are safe for widespread use. Ketamine is an antagonist of the NMDA receptor, which is an ionotropic glutamate receptor and one of the most abundant transducers of glutamate signaling in the brain. Rodent studies have demonstrated that ketamine induces a transient increase in extracellular glutamate in the medial prefrontal cortex (mPFC) shortly (30 to 60 minutes) after administration (Moghaddam, Adams, Verma, & Daly, 1997). Blockade of AMPA receptors blocks the drug’s antidepressant effect, providing evidence that glutamate-AMPA activity is necessary to produce the effect (Maeng et al., 2008). The first challenge in explaining ketamine’s mechanism of action is reconciling how a drug that blocks a glutamate receptor leads to an increase in glutamate signaling. The key to this apparent paradox may be the fact that ketamine preferentially binds to the NMDA receptor when its ion channel is in the open conformation (Figure 1.2). Interneurons have a higher tonic firing rate than pyramidal neurons and thus their NMDA receptors are more likely to have an open channel at any given time, so it is
- 19. 9 hypothesized that low doses of ketamine preferentially bind to NMDA receptors on l-aminobutyric acid (GABA) interneurons. Blockade of the NMDA receptor blocks the function of these inhibitory cells, which in turn disinhibits the activity of glutamatergic pyramidal cells, whose activity is tonically inhibited by interneurons (Duman, 2014). This disinhibition hypothesis explains the observed glutamatergic effects of ketamine, and it also explains why ketamine does not induce a glutamate burst or an antidepressant effect at higher doses (Moghaddam et al., 1997): higher concentrations of ketamine are able to bind to NMDA receptors on both interneurons and pyramidal neurons, so at higher doses of ketamine NMDA receptor blockade on pyramidal neurons interferes with the interneuron- mediated glutamate neurotransmission necessary to achieve an antidepressant effect.
- 20. 10 The glutamate burst induced by disinhibition of pyramidal neurons initiates post-synaptic signaling cascades that affect both local networks in the prefrontal cortex and a wide range of other brain regions to which the Figure 2. Signaling pathways involved in the response to rapid-acting antidepressants In the GABA interneuron: Ketamine blocks activity of the NMDA receptor (NMDAR), which prevents GABA release and thus disinhibits the firing of the glutamatergic cell, resulting in a transient burst of glutamate release. In the postsynaptic cell: The glutamate burst activates synaptic NMDARs and AMPA receptors (AMPARs). AMPAR activity triggers the opening of voltage-gated calcium channels (VDCC); the resulting calcium influx triggers the release of BDNF, which binds to TrkB and induces mammalian target of rapamycin complex 1 (mTORC1) signaling. SSRIs also increase the expression of BDNF after chronic administration. Ketamine exerts a pro-growth effect by blocking extrasynaptic NMDARs, especially those containing the GluN2B subunit. These receptors activate elongation factor 2 kinase (EF2k), which inhibits elongation factor 2 (elF-2); their blockade induces brain-derived neurotrophic factor (BDNF) synthesis and other protein synthesis via ElF-2. mTORC1 promotes protein synthesis via multiple mechanisms. Protein synthesis is necessary for formation of new synapses, which enables the plasticity that marks a successful antidepressant response.
- 21. 11 pyramidal neurons project. The primary target of synaptic glutamate is the post-synaptic AMPA receptor; if AMPA receptors are inhibited, ketamine’s antidepressant effect is blocked as well (Maeng et al., 2008). AMPA receptor activation causes its ion channel to open and depolarizes the post-synaptic cell. In turn, depolarization leads to the opening of L-type voltage-gated calcium channels (VDCCs), which promotes the release of brain-derived neurotrophic factor (BDNF) (Lepack, Fuchikami, Dwyer, Banasr, & Duman, 2014), binding of BDNF to its receptor tropomysin receptor kinase B (TrkB), and TrkB-mediated activation of the mTORC1 signaling pathway (Jourdi et al., 2009; N. Li et al., 2010). Each of these molecular signals is necessary for the antidepressant action of ketamine and ultimately promotes the dendritic- spine growth and synaptic plasticity that are the hallmarks of ketamine- induced antidepressant activity. The signaling cascades that lead to and proceed from BDNF release and mTORC1 activation are dense and interconnected, as each is involved in different facets of the regulation of energy metabolism and cellular growth (Duman & Voleti, 2012) (Figure 1.2). Several important mediators of these pathways have been identified and their relevance to the antidepressant effect of ketamine confirmed. Autry and colleagues have shown that ketamine promotes the induction of BDNF synthesis in hippocampus through an additional mechanism by preventing the activation of eukaryotic elongation factor 2 kinase (eEF2K), which normally phosphorylates its target protein, eukaryotic elongation factor 2 (eEF2), in response to spontaneous
- 22. 12 synaptic glutamate release (as distinct from action-potential-evoked release) (Autry et al., 2011). NMDA receptors bind to spontaneously released glutamate and trigger the activation of eEF2K, so the blockade of NMDA receptors by ketamine prevents the transmission of this signal. Because phosphorylated eEF2 inhibits BDNF synthesis, ketamine’s NMDA antagonism removes this inhibition (Monteggia, Gideons, & Kavalali, 2013). This effect of NMDA receptor antagonism is distinct from the pyramidal-cell disinhibition hypothesis, but may represent a complementary mechanism. In contrast to our lab’s previous studies as well as reports from multiple other research groups (N. Li et al., 2010; Liu et al., 2017), Autry et al. (2011) and Zanos et al. (2016) have reported no effect of ketamine on mTORC1 signaling. This contradiction may be due to multiple factors, including uncontrolled stress of the animals, species (rat vs. mouse), brain region and dissection, and tissue preparation (crude homogenates vs. synaptosome-enriched preparations), that could influence the phosphorylation of mTORC1 signaling proteins, a process that is dynamic and state-dependent. Further supporting the idea that ketamine derives at least part of its antidepressant efficacy by blocking the response to spontaneous glutamate release, numerous studies have investigated an important role of NMDA receptors containing the GluN2B subunit, which is selectively activated by spontaneous glutamate release (in contrast to GluN2A subunits, which respond to action-potential-evoked glutamate). Pharmacological studies report that GluN2B-selective antagonists produce rapid antidepressant
- 23. 13 effects in depressed patients (Preskorn et al., 2015) and in rodent models (N. Li et al., 2010; Maeng et al., 2008). Using a conditional knockout to remove the GluN2B subunit selectively from cortical pyramidal neurons, Hall and colleagues found that GluN2B-selective inhibition produces a robust antidepressant response that occludes the antidepressant effect of ketamine; however, these knockout mice also display hyperlocomotor activity making it difficult to interpret these behavioral findings (Miller et al., 2014). In addition to activating in response to different patterns of glutamate release, GluN2B subunits transmit a different set of intracellular signals than do GluN2A subunits and may be most prevalent at a different part of the postsynaptic neuron (Hardingham & Bading, 2010). GluN2B-mediated signals, particularly at extrasynaptic NMDA receptors, appear to act as a brake on the plasticity-promoting effects of glutamate neurotransmission. The conditional knockout of GluN2B removes this impediment to BDNF synthesis and mTORC1 activation in a way that occludes the effects of ketamine on both of these signaling pathways (Miller et al., 2014). Though ketamine does not selectively bind to one GluN2 isoform over the other, inhibition of overactive extrasynaptic NMDARs that contain GluN2B may have a unique set of behavioral consequences. Ketamine also interacts with at least one additional facet of the plasticity-regulating machinery through the glycogen synthase kinase (GSK) pathway (Figure 1.2). GSK controls the degradation of b-catenin, which is a necessary substrate for most forms of cellular growth and plasticity,
- 24. 14 including the formation of new dendritic spines. Phosphorylation of GSK renders it inactive, thus increasing the availability of b-catenin (Duman & Voleti, 2012). Ketamine rapidly promotes GSK phosphorylation, and this activity is necessary for its antidepressant effect (Beurel, Song, & Jope, 2011). The mechanism of this effect is not clear, but it may be a downstream consequence of BDNF release, which activates Akt, a protein that phosphorylates GSK; or it may result from mTORC1 activity, which activates S6 kinase, which also phosphorylates GSK (Duman & Voleti, 2012). A recent line of research has called into question the conclusion that NMDA antagonism is the functional mechanism of ketamine at all, based on the finding that one particular metabolite of racemic (R,S) ketamine, (2R,6R)- hydroxynorketamine (HNK), is sufficient to produce a robust antidepressant response, even though it was reported that this metabolite does not show binding affinity for the NMDA receptor (Zanos et al., 2016). This enantiomer of HNK does induce a rapid, transient increase in glutamate signaling along with insertion of AMPA receptors in cell membranes, which racemic ketamine has previously been shown to do (Wohleb, Gerhard, Thomas, & Duman, 2016). However, recent evidence from another laboratory indicates that HNK may in fact act at NMDA receptors, although at higher doses (Suzuki, Nosyreva, Hunt, Kavalali, & Monteggia, 2017). Nevertheless, even if HNK acts via NMDA receptors the reduced side effects in rodent models indicate that it has the potential to be better tolerated by depressed patients than ketamine itself is.
- 25. 15 Ketamine has numerous points of interaction with signaling pathways that lead to increased synaptic plasticity and dendritic spine growth via new translation of the proteins needed to form new synapses, including the AMPA receptor subunit GluA1 (Duman, Aghajanian, Sanacora, & Krystal, 2016). Rodent models of depression induced by chronic stress have shown that loss of dendritic spines is a key feature of the depressed brain, which ketamine reverses within 24 hours of administration (N. Li, Liu, Dwyer, Banasr, Lee, Son, Li, Aghajanian, & Duman, 2011a). Both BDNF release and mTORC1 activation, two of the necessary components of ketamine’s antidepressant effect, promote synaptogenesis (Duman & Aghajanian, 2012). The restoration of synaptic plasticity appears to be the critical mechanism on which the many signaling pathways affected by ketamine converge. 1.4. Neural circuits involved in the function of rapid-acting antidepressants As the intracellular signaling pathways activated by antidepressants come into sharper and more detailed focus, the circuit level effects of antidepressants are beginning to be understood, thanks to new tools like optogenetics that enable the manipulation of specific brain circuits. The mood-regulating parts of the human brain have long been studied as an interrelated cortical-limbic system, and research efforts have identified correlates of these areas in non-human primates and rodents(Price & Drevets, 2009). A key regulator of the limbic system is the mPFC, which exerts top-down influence over other emotion-related areas. In humans, the
- 26. 16 mPFC is thought to be involved in self-evaluation and other self-referential activities, including emotional ones (Beer, Lombardo, & Bhanji, 2010). Depression causes marked deficits in self-evaluation, including feelings of guilt and worthlessness, which may stem from prefrontal dysfunction. The involvement of the mPFC in depression has been studied extensively in the field of deep-brain stimulation (DBS) research, in which permanent electrodes are placed within brain tissue and set to continuously stimulate at a high frequency in order to relieve depression and other cognitive and affective symptoms. The most consistently effective electrode placement has proven to be the subgenual cortex, an mPFC area that is overactive in depressed patients compared to controls as assessed by fMRI (Holtzheimer & Mayberg, 2011; Mayberg et al., 2005). DBS inactivates targeted axons by depleting the presynaptic neurotransmitter pool; when delivered to the cortex, it reduces the excess glutamate associated with depression (Iremonger, Anderson, Hu, & Kiss, 2006). Our lab has recently shown that optogenetic stimulation of glutamatergic neurons in the mPFC of rats, with a time course and intensity similar to that of ketamine, produces a robust and long-lasting ketamine-like synaptic and antidepressant behavioral response. Further, we demonstrated that infusion of ketamine directly into the rat infralimbic prefrontal cortex (ilPFC), thought to be a correlate of the human mPFC, was sufficient to produce an antidepressant effect similar to what is achieved when the drug is given systemically, and pharmacological silencing of infralimbic PFC blocks
- 27. 17 the effect of systemic ketamine (Fuchikami et al., 2015). This thesis builds on these studies, which demonstrate the critical role of glutamatergic neurons in the mPFC to the antidepressant effect of ketamine. 1.5. Aims The goal of this thesis is to expand the understanding of how ketamine acts as an antidepressant on a circuit level. It builds on previous work showing the importance of the medial prefrontal cortex to the ketamine antidepressant response and defines a role for the dorsal raphe nucleus (DRN) in mediating this effect. The second chapter describes the optogenetic stimulation of axon terminals projecting from the medial prefrontal cortex to the dorsal raphe nucleus and its behavioral effects. In the third chapter, this circuit is pharmacologically silenced in order to test its effect on systemic ketamine administration. In the fourth chapter, the effect of optogenetic stimulation of mPFC-originating axon terminals in the nucleus accumbens is compared to the antidepressant effects of DRN-terminal stimulation described in chapter two.
- 28. 18 CHAPTER 2: Optogenetic stimulation of mPFC-originating axon terminals in the dorsal raphe nucleus produces an antidepressant effect 2.1. Introduction Previous work in our lab showed that optogenetic stimulation of glutamatergic cells in the rat infralimbic PFC produced an antidepressant effect that lasted up to 17 days after a single hour-long stimulation treatment (Fuchikami et al., 2015). Because ketamine induces a rapid increase in ilPFC glutamatergic activity that is necessary for its antidepressant effect (Wohleb et al., 2016), we hypothesized that this stimulation mimics the antidepressant action of ketamine. The important downstream target areas affected by the stimulated cells remain unclear, as the ilPFC projects widely throughout the rat brain, including dense connections to nuclei in the rest of the medial PFC as well as to the hypothalamus, thalamus, amygdala, and brainstem; and less-dense connections to many regions, including the lateral habenula (LHB), nucleus accumbens (NAC), and dorsal raphe (DRN) (Vertes, 2004). I verified that the viral vector we used produces channelrhodopsin expression in mPFC-originating axon terminals in a similar distribution of areas (see 2.3.1). Several of these target sites, including the latter three, have been found to be directly involved in mood regulation. For example, optogenetic stimulation of mPFC-originating axon terminals in the lateral habenula leads to a depression-like phenotype (Warden et al., 2012), as does induction
- 29. 19 of activity by increased expression of bCaMKII (K. Li et al., 2013). Ketamine has been found to produce an antidepressant effect by directly blocking burst activity in the LHB (Yang et al., 2018). The effect of the mPFC-to-LHB projection, and ketamine’s modulation of it, remain unclear: it may augment ketamine’s direct effect on the LHB by acting as an inhibitory projection (if those glutamatergic axons synapse onto inhibitory cells in the LHB), or it may mitigate ketamine’s direct effect by stimulating LHB activity. In contrast to the pro-depressive output of the LHB, the dopaminergic projection from the ventral tegmental area (VTA) to the NAC is a key part of the brain’s reward pathway (and is inhibited by glutamatergic projections from the LHB) (Russo & Nestler, 2013). The NAC also receives substantial input from the mPFC, which conveys reward-related information that modulates the activity of NAC medium spiny neurons (H. Hu, 2016). Optogenetic stimulation of mPFC-originating axon terminals in the NAC ameliorated social avoidance and sucrose-preference deficits, but not anxiety- like behavior, in a mouse model of social-defeat stress (Vialou et al., 2014). This selective effect suggests that particular aspects of depression-like behavior may be controlled by different mPFC projection pathways. In addition, the evidence from optogenetic stimulation of axon terminals in the LHB and NAC suggest that the effect of any one projection from the mPFC cannot be predicted from the overall antidepressant effect of mPFC pyramidal-cell stimulation, because mPFC axons reach brain areas that drive both depressive and anti-depressive behaviors.
- 30. 20 The mPFC projection to the DRN presents an interesting avenue to further investigate our observed antidepressant effect, and potentially by extension the circuitry on which ketamine acts. The DRN has been shown to regulate depression-like behavior and is the primary source of the brain’s serotoninergic output (H. Hu, 2016), which was long thought to constitute the key neurotransmitter system involved in depression. Because ketamine targets glutamatergic receptors, its mechanism was thought to be distinct from that of SSRIs. However, recent investigations have shown that ketamine’s antidepressant effect is blocked by systemic depletion of serotonin (Fukumoto, Iijima, & Chaki, 2015), and that ketamine promotes behavioral resilience to depression via modulation of the PL-DRN projection (Amat et al., 2016). These studies suggest the DRN may be an important part of the circuitry underlying ketamine’s antidepressant effect. The interconnections between the dR and the mPFC are highly complex and may be inhibitory or excitatory depending on the context of their activation, and especially on the rate of serotonin release and the distribution of serotonin receptors within the nucleus (Celada, Puig, Casanovas, Guillazo, & Artigas, 2001). Warden et al. (2012) demonstrated that optogenetic stimulation of terminals in the dorsal raphe induced an antidepressant effect on the forced-swim test (FST) and sucrose-preference test (SPT) that is observable in real time as the stimulation is turned on or off. This paradigm showed the immediate effect of the activation of the DRN terminals, but it remained unclear how relevant the effect was to longer-lasting
- 31. 21 antidepressant treatments, if at all. To investigate this question, I optogenetically activated mPFC-originating axon terminals in the DRN and observed effects on behavior and immunohistochemistry. 2.2. Methods 2.2.1. Animal care and surgery Adult male Sprague-Dawley rats (Charles River Laboratories) weighing 200-300 g were pair-housed on a 12-h light/dark cycle (lights on 07:00) with food and water available ad libitum. All procedures were done in accordance with guidelines for the care and use of laboratory animals and the Yale University Institutional Animal Care and Use Committee. Rats were anesthetized with an intraperitoneal injection of ketamine 80 mg/kg + xylazine 6 mg/kg. (This anesthetic dose of ketamine does not produce antidepressant behavioral or molecular changes.(N. Li et al., 2010)) They were then injected with AAV2/CaMKIIa-ChR2(H134R)-eYFP (University of North Carolina Vector Core) 0.5 µL per side at a rate of 0.1 µL/min into the infralimbic PFC (+3.0 mm AP; ±0.6 mm ML; -5.0 mm DV). An optical fiber (Doric Lenses) with a fiberoptic attachment port was then inserted at a 30° angle and cemented in place, with the tip of the fiber targeted just dorsal and lateral to the DRN (-7.8 mm AP; +3.1 mm ML; -4.7 mm DV). Animals had 4 weeks after surgery to recover and to ensure adequate viral expression.
- 32. 22 2.2.2. Optogenetic stimulation A fiberoptic cable (Doric Lenses) was attached to the port on the animal’s head, and the laser was turned on (for the stimulated group) or left off (for the control group). Stimulation was conducted over the course of one hour: pulse width, 15 ms; frequency 10 Hz; intensity, 5 mW; 473 nm blue light; each minute of laser on time was alternated with one minute of laser off time to avoid any possibility of tissue damage. The 10 Hz frequency is a significant elevation from baseline and has been shown in vivo to produce reliable pyramidal-neuron action potentials at the same frequency, so the risk of depolarization block or excitotoxicity is low (Ji & Neugebauer, 2012). 2.2.3. Behavioral tests The sequence of testing was as follows: - Day 1: pre-swim - Day 2: optogenetic stimulation - Day 3: FST/NSFT/FUST (some groups had additional testing done at later days, where specified) Forced-swim test (FST): The FST is a measure of an animal’s ability to cope with a stressful situation, with the primary output, immobility, being interpreted as behavioral despair (Porsolt, Anton, Blavet, & Jalfre, 1978). Rats were placed in 25°C water in a clear Plexiglas cylinder (65 cm height, 30 cm diameter) initially for a 15-minute “pre-swim” to acclimate them to the procedure. Afterward, rats were removed and dried with a cloth. Twenty-four
- 33. 23 hours later, rats underwent optogenetic stimulation as described above. Twenty-four hours following treatment, rats were again placed in the swimming cylinders for a 10-min test swim. All sessions were video recorded and data were analyzed by measuring the amount of time the animal spent immobile (making only movements necessary to keep afloat). Data points from minutes 2-6 of the swim were used (5 minutes total). Novelty-suppressed feeding test (NSFT): Novel environments provoke anxiety in rodents, which delays their normal feeding behavior when food- deprived; ketamine and other antidepressants reduce the latency to feed (N. Li et al., 2010). Rats that had been deprived of food for 16-20 hours were placed in an open field (76.5 cm × 76.5 cm × 40 cm; acrylic) with a small amount of their normal chow in the center. Animals were allowed to explore the open field for up to 20 min. The output measured was time elapsed before approaching and taking a bite of the food. Time elapsed before taking a bite of food in the home cage (home-cage feeding, HCF) was measured as a control immediately after testing. Female-urine sniffing test (FUST): Anhedonia is an important feature of depression in humans (American Psychiatric Association, 2013). The FUST is a measure of hedonic behavior in rodents and is sensitive to SSRI treatment (Malkesman et al., 2010). After 45 minutes of habituation to the testing room, animals were allowed to briefly sniff a cotton swab dipped in water, which was then affixed to the inside of the cage; their interaction with the swab was recorded for 3 minutes. Urine was then collected from adult
- 34. 24 females on the tips of cotton swabs, one for each animal being tested. 45 minutes after the water-swab test, animals were exposed to the urine-soaked swab and again recorded for 3 minutes. Videos were scored for time spent sniffing the swab. Locomotor activity (LMA): The NSFT was video-recorded and later analyzed for distance traveled in the first 5 minutes after placement in the chamber, using AnyMaze software. 2.2.4. Immunohistochemistry Rats were anesthetized (chloral hydrate, 250 mg/kg, i.p.) and transcardially perfused with ice-cold PBS followed by freshly prepared 4% paraformaldehyde. Brains were removed and placed in the same fixative for 48–72 h at 4 °C and then cryoprotected in 20% glycerol-PBS for 48-72 h. Sections (40 µm) were cut using a sliding microtome. Cannula placements were verified in sections, and animals with incorrect placement were not included in any studies. Slices were placed in PBST (PBS + 0.1% Triton X-100) with 5% (wt/vol) normal goat serum for 3 hours and then incubated overnight with primary antibody (rabbit anti-c-Fos 1:500, Santa Cruz Biotechnology; chicken anti- GFP 1:1000, Abcam; 1:500 goat anti-TPH2, Abcam) and PBST at room temperature. After three washes in PBS, slices were incubated with secondary antibody (1:500 donkey anti-rabbit Cy3, Millipore; 1:500 donkey anti-chicken, Jackson Laboratories; 1:100 donkey anti-goat 488, ThermoFisher Scientific) in PBST for 2 h at room temperature, followed by
- 35. 25 three more washes in PBS. Sections were then mounted on a polarized glass slide and allowed to dry completely. They were then covered in DPX mounting medium (Sigma-Aldrich) and covered in a glass coverslip. Sections were collected at approximately bregma -7.8mm. The boundaries of each area for counting were manually drawn and were held constant between sections. Tissue was visualized using a fluorescent microscope (Zeiss) using standard FITC and TRITC filters. c-Fos expression was determined using image-analysis software (ImageJ64 1.49o, National Institutes of Health). The software calculated mean pixel value and standard deviation of background staining. The mean background pixel values of all sections were within 2-3 SD, so a threshold was set at four SDs above the mean of background; only the brightly stained cells exceeding that threshold were counted. These parameters produced a close agreement between manual and computer-counted c-Fos-positive cells. Mean number of positive cells in each section was computed and averaged among 2-3 sections per subject. Data are expressed as average c-Fos positive cells per section per subject. 2.2.5. Data analysis For behavioral testing and c-Fos quantification, control vs. stimulated groups were compared using a two-tailed t-test. To analyze TPH2 reactivity x stimulation status, a two-way ANOVA with LSD post-hoc test was used. Significance was determined at p < 0.05. All data are represented as mean ± SEM.
- 36. 26 2.3. Results 2.3.1. Survey of brain regions with mPFC-originating axon terminals My first step was to examine the expression of GFP throughout the brain after injection of the channelrhodopsin-containing viral construct into the ilPFC. The ChR2 protein is transported into axons and axon terminals, allowing identification of distant target regions of the cells expressing the protein (Han, 2012). The distribution of GFP-tagged terminals generally Figure 2.1. Distribution of GFP-labeled ChR2 throughout the brain GFP fluorescence was found in the following regions, captured at 10X magnification: (A) bed nucleus of the stria terminalis (bregma -0.3mm); (B) medial dorsal caudate- putamen (bregma +1.6mm); (C) mediodorsal thalamus (bregma -2.3mm); (D) lateral posterior thalamus (bregma -3.3mm); (E) nucleus reuniens (bregma -2.8mm); (F) basomedial and central amygdala (bregma -2.8mm); (G) lateral habenula, medial part (bregma -3.14mm); (H) nucleus accumbens, core and shell (bregma +1.6mm). A. D. C. B. E. G. F. H.
- 37. 27 matched that found in retrograde tracer studies of ilPFC target sites (Vertes, 2004). Notable areas of ChR2 expression include the bed nucleus of the stria terminalis, caudate-putamen, mediodorsal and lateral posterior thalamus, nucleus reuniens, basomedial and central amygdala, LHB, and NAC (Figure 2.1); and the DRN (Figure 2.4). All of these areas present potential stimulation targets, though some would be difficult to selectively target due to the presence of other GFP- expressing areas nearby (e.g., LHB or central amygdala); and some areas may have significant GFP expression in fibers of passage rather than axon terminals (e.g., thalamic nuclei), which would complicate interpretation. For these reasons, as well as the important mechanistic questions described in the introduction, I targeted the DRN first. 2.3.2. Optogenetic stimulation of mPFC-originating axon terminals in the DRN produces an antidepressant effect on the FST
- 38. 28 To test the hypothesis that the projection from the mPFC to the DRN is involved in the mPFC-mediated antidepressant effect described in Fuchikami et al. (2015), I injected ChR2-containing virus into the mPFC targeting the infralimbic region (Figure 2.2.B)(Paxinos & Watson, 1998). The virus, AAV2, enters all neurons, but the CamKII promoter associated A. B. C. D. Figure 2.2. DRN axon-terminal stimulation produces an antidepressant effect on the FST Illustrations showing the target area of bilateral virus injection into the ilPFC (bregma +3.2 mm; dotted pattern), position of the implanted fiberoptic (solid line in-plane, dotted line out-of-plane), and target area of light exposure (bregma -7.8 mm; solid gray fill) {Paxinos:1998ui}22 in (A) sagittal (0.4mm lateral) and (B) coronal sections. (C) Reduction of immobility on the FST induced by stimulation of ChR2-expressing axon terminals in the DRN (*p = 0.01, t-test). Minutes 2-6 of the FST were analyzed. (D) Stimulation had no significant effect on locomotor activity. n = 12-13 per group. immobility time (s) c o n t r o l s t i m u l a t e d 0 20 40 60 80 100 * c o n t r o l s t i m u l a t e d 0 10 20 30 distance traveled (m)
- 39. 29 with the ChR2 gene ensures that the protein is expressed predominantly in excitatory neurons (McDonald, Muller, & Mascagni, 2002). I then stimulated ChR2-expressing axon terminals in the DRN (Figure 2.2.A) with a fiberoptic positioned dorsal and lateral to the target area so that it would not damage DRN cells. I used the same stimulation protocol that had produced the antidepressant effect when used on the cell bodies in the infralimbic PFC; the control group received no stimulation. On the FST 24 hours after stimulation, animals showed a significant decrease in time spent immobile (t23 = 2.8, p = 0.01) (Figure 2.2.C). Immobility is used as a measure of behavioral despair, and many antidepressant drugs reliably decrease immobility on this test, which makes it one of the most reliable and facially valid tests for assessing depression-like behavior in rodents (Porsolt, Brossard, Hautbois, & Roux, 2001). The effect was not explained by a difference in locomotor activity between the two groups (t26 = 0.9, p = 0.4) (Figure 2.2.D). 2.3.3. DRN axon-terminal stimulation did not produce an antidepressant effect on other behavioral measures or at a longer time point Using the same viral-injection and stimulation protocols, I then tested separate groups of animals on two other behavioral measures, the NSFT and FUST, which measure different aspects of depression-like behavior. In the NSFT, latency to feed on pellets placed in an open field is used as a measure of anxiety. Chronic SSRI administration treatment decreases latency to feed in this model (Bodnoff, Suranyi-Cadotte, Aitken, Quirion, & Meaney, 1988),
- 40. 30 as did a one-hour optogenetic stimulation of ilPFC glutamatergic cell bodies (Fuchikami et al., 2015). Time spent sniffing female urine is a measure of hedonic behavior in male rodents which is improved by acute ketamine treatment in serotonin-depleted rats (Malkesman et al., 2011). On neither the NSFT (t15 = 1.0, p = 0.3) nor the FUST (t11 = 0.9, p = 0.4) was there a difference between the groups at 24 hours post-stimulation (Figure 2.3.A and C), indicating that the antidepressant effect of DRN axon-terminal stimulation was narrower in scope than the antidepressant effect induced by stimulating cell bodies in the infralimbic PFC. There was no difference in appetite as measured by home-cage feeding behavior (t25 = 0.4, p = 0.7) (Figure 2.3.B), which is a common confound of behavior in the NSFT. I also tested a cohort on the FST one week after stimulation, and there was no difference between stimulated and non-stimulated animals (t16 = 0.002, p = 1.0) (Figure 2.3.D), indicating that the antidepressant effect observed at 24 hours dissipated more quickly than the antidepressant effect induced by infralimbic PFC cell body stimulation, which lasted at least 17 days (Fuchikami et al., 2015).
- 41. 31 2.3.4. DRN axon-terminal stimulation results in increased local neuronal activity but mPFC activity is not affected To understand the effects of this stimulation on a cellular level, I sectioned tissue and stained for GFP, which was tagged to the channelrhodopsin protein; c-Fos, a marker of neuronal activation; and/or TPH2, an enzyme found in serotonin-releasing cells. I could also verify cannula placements from the DRN sections (Figure 2.4.A). >75% of A. B. C. D. Figure 2.3. DRN axon-terminal stimulation had no effect on the NSFT, FUST, or 7-day post-stimulation FST (A) DRN terminal stimulation had no effect on the NSFT, conducted 24 hours after stimulation. (B) Those groups showed no difference in home-cage feeding. (C) DRN terminal stimulation did not significantly affect behavior on the FUST, conducted at 24 hours post-stimulation on a separate cohort. (D) There was also no effect on the FST at 7-days post-stimulation. All comparisons analyzed by t-test. n = 5-13 rats per group. Time immobile (s) C o n t r o l S t i m u l a t e d 0 20 40 60 80 100 W a t e r - c o n t r o l W a t e r - s t i m u l a t e d U r i n e - c o n t r o l U r i n e - s t i m u l a t e d 0 20 40 60 80 Time sniffing (s) c o n t r o l s t i m u l a t e d 0 50 100 150 200 time to first bite (s) time to first bite (s) c o n t r o l s t i m u l a t e d 0 200 400 600 800 1000
- 42. 32 cannulas were in the targeted area; all animals with off-target cannulas were removed from the study. GFP staining in the mPFC verified accurate placement of the virus (Figure 2.4.B and C). In every instance, virus was concentrated in the infralimbic PFC, where it was targeted, and it also typically spread dorsally to the prelimbic PFC. Though stimulation of cell bodies in the prelimbic did not produce an antidepressant effect in our previous study (Fuchikami et al., 2015), the prelimbic PFC does project to the DRN (Vertes, 2004), so the potential involvement of prelimbic-originating axon terminals in this behavioral effect cannot be ruled out. To estimate neuronal activity as a result of stimulation, I perfused and fixed brain tissue 90 minutes after a 20-minute stimulation using the same parameters as with the behavioral tests. After complete fixation, I sectioned and stained the brains for c-Fos, which is induced in response to neuronal activity. Stimulation significantly increased c-Fos expression in the DRN (t11 = 5.5, p = 0.0002), as would be expected of stimulation of glutamatergic axon
- 43. 33 terminals (Figure 2.5.A and B). Stimulation did not have a noticeable effect on c-Fos expression in the mPFC as compared to unstimulated controls, meaning that the stimulation did not trigger action potentials back- propagating to mPFC cell bodies to an extent significant enough to trigger expression of c-Fos. This finding indicates that the behavioral results A. B. C. Figure 2.4. Cannula placement and viral expression in the mPFC and DRN (A) Cannula placement locations for the experiments described in Figure 2.2; Os are correctly placed and Xs are misses. The blue box indicates the target area for the tip of the cannula that would ensure light exposure to the DRN. Misses were excluded from results. Three additional incorrect placements were out of plane and not shown. (B) Representative viral expression in the mPFC. (CC: corpus callosum) (C) Representative viral expression in the DRN. (Aq.: cerebral aqueduct) CC ilPFC plPFC Aq. DRN Aq. DRN
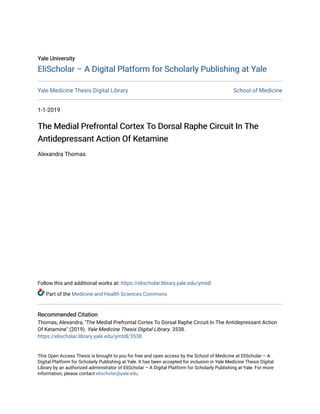
- 44. 34 resulting from this stimulation are likely the result of its effects on cells in the DRN rather than on the mPFC or other PFC target areas. Co-staining for c-Fos and TPH2 showed that stimulation induced a non-significant upward trend in the percentage of TPH2-reactive cells that colocalized with c-Fos immunoreactivity (t11 = 1.7, p = 0.1) (Figure 2.6.A and B). However, the vast majority of the increase in c-Fos expression induced by DRN stimulation was not colocalized with TPH2. Comparison of the effect of stimulation on c-Fos expression that was TPH2-colocalized versus non-TPH2- colocalized showed a significant positive effect of stimulation (F1,22 = 26.7, p < 0.0001) and TPH2 non-reactivity (F1,22 = 18.9, p = 0.0003) as well as an interaction between the two (stimulation x TPH2 interaction F1,22 = 6.4, p = 0.02) in a two-way ANOVA. This was not accounted for by a difference in the number of TPH2+ cells between the non-stimulated and stimulated groups (mean TPH2 count in non-stimulated animals was 195 vs. in stimulated animals 211; difference between the means was 16 ± SEM of 35). This result suggests that mPFC projections to the DRN may activate predominantly non- serotonergic cell populations.
- 45. 35 A. B. Figure 2.5. c-Fos activation is increased in the DRN but not in the ilPFC in response to DRN axon-terminal stimulation (A) Representative images of c-Fos expression in the DRN and ilPFC either without stimulation or 2 hours after a 20min stimulation of mPFC-originating axons in the DRN. Scale bar = 100µm. (B) Quantification of c-Fos+ cells in the DRN showed a significant increase after stimulation (*p = 0.0002, t-test). c-Fos expression was similarly sparse in the mPFC in both conditions (not quantified). n = 6-7 animals per group, 2-3 sections per brain area per animal. N o n - s t i m u l a t e d S t i m u l a t e d 0 50 100 150 c-Fos+ cells * DRN ilPFC Non-stimulated Stimulated
- 46. 36 2.4. Discussion These results help clarify the mechanism of the antidepressant effect induced by mPFC glutamatergic-cell stimulation, which is designed to mimic A. B. C. Figure 2.6. Stimulation induces c-Fos expression in non-TPH2-expressing cells (A) Representative images from non-stimulated and stimulated conditions stained for both c-Fos (red) and TPH2 (green); cells stained with both are marked with a white arrow. Scale bar = 100µm. (B) Percentage of TPH2+ cells that also expressed c-Fos was non-significantly increased by stimulation (p = 0.1, t-test). (C) Stimulation increased non-colocalized c-Fos expression (*p < 0.0001; Fisher’s LSD) but did not significantly increase c-Fos expression colocalized with TPH2 (p = 0.08, Fisher’s LSD). n = 6-7 animals per group, 2-3 sections per animal. Non-stimulated Stimulated c-Fos TPH2 c-Fos+TPH2 c - F o s + , T P H 2 + c - F o s + , T P H 2 - 0 20 40 60 80 100 c-Fos+ cells Non-stimulated Stimulated N o n - s t i m u l a t e d S t i m u l a t e d 0.00 0.05 0.10 0.15 0.20 0.25 Colocalization % n.s. * n.s.
- 47. 37 the glutamatergic activity induced by ketamine. The antidepressant effect found in these studies, induced by stimulating mPFC-originating axon terminals in the DRN, differs from the effect of stimulating mPFC neurons in two important ways. First, it persists for a shorter time; second, it only affects a subset of depression-like behavior. The first difference is not unsurprising given the likely mechanism of the antidepressant effect. In order to endure for over two weeks, as the behavior described in Fuchikami et al. (2015) did, the effect must be mediated by durable changes at the cellular level. These changes included the formation of new dendritic spines and strengthening of synaptic connections, for which we found electrophysiological evidence. Stimulation of the cell bodies may have induced changes in gene expression or activity, as these processes requires protein translation, which could explain their duration. However, long-lasting changes based on gene expression may not be triggered by axonal stimulation, especially if there is minimal back- propagation of action potentials, as suggested by the c-Fos staining in the mPFC shown in Figure 2.5A. Protein translation does occur locally within axons using pre-existing mRNA (Van Driesche & Martin, 2018), so it is plausible that axonal stimulation could trigger the formation of new synapses or changes in synaptic strength. Without nuclear involvement, these local changes may be sufficient to produce behavioral effects lasting a few days but not to induce the longer-lasting changes produced by somatic stimulation.
- 48. 38 The nature of the behavioral changes induced by axonal stimulation is a property of the particular projection being stimulated, which may differ from the net effect of stimulating cell bodies and their multitude of axonal targets. In this case, stimulation affects the activity of the brain’s primary serotonergic output source. Which cells within the DRN are targeted and the net effect of mPFC input on serotonin release has been a matter of debate, and the results from this chapter may help clarify the former question, as most of the cells activated by mPFC axon stimulation were not TPH2- expressing, i.e., not serotonin neurons. Most of the non-serotonergic cells in the DRN are GABAergic interneurons (Maier & Watkins, 2005) (though the rostral part of the DRN contains a small population of dopaminergic neurons as well (Hale & Lowry, 2011)). Axons from the rat mPFC may regulate DRN activity by synapsing onto subpopulations of both 5HT and GABA neurons, as they do in mice (Weissbourd et al., 2014). The findings from Figure 2.6 are not inconsistent with this idea, though there was a clear predominance of c-Fos activity in non-TPH2-expressing cells. An additional consideration is that previous studies in mice have found that mPFC axons overlap with both serotonergic and GABAergic portions of the DRN in different rostrocaudal planes (Challis, Beck, & Berton, 2014). Though similar studies have not been conducted in rats, that finding raises the possibility that the results from this study, taken from a single rostrocaudal plane, may not reflect the activity that was occurring in other parts of the DRN.
- 49. 39 Understanding the relationship between mPFC glutamatergic activity and DRN cellular subpopulations has relevance for the larger question of how the mPFC affects the functional output of the DRN. Modulation of the serotonin system is recognized as an important feature of SSRIs, but it had not been linked to the antidepressant effect of ketamine or other rapid-acting antidepressants until recently. Ketamine has been shown to increase serotonin release from DRN neurons into the mPFC (Nishitani et al., 2014). Further, its antidepressant effect in mice requires activation of serotonin neurons in the DRN (Fukumoto et al., 2015). (That study found that ketamine administration into the mPFC induced c-Fos activation in TPH2- expressing cells, which is at odds with the results from Figure 2.6. Those differences may be due to a number of factors, including neuroanatomical differences between rats and mice, differences in the effect of axon terminal stimulation compared to intra-PFC ketamine administration, or differences in the particular part of the DRN sampled for the colocalization studies.) Finally, experiments in mice have shown that serotonin release in the mPFC is necessary for ketamine’s antidepressant effect (Fukumoto, Iijima, Funakoshi, & Chaki, 2017). Given that serotonergic and glutamatergic projections overlap in many areas of the brain (Russo & Nestler, 2013), and this recent evidence strongly suggests that ketamine’s antidepressant effect requires activation of an mPFC-to-DRN-to-mPFC circuit, in which mPFC glutamatergic activation of the DRN triggers serotonin release in the mPFC.
- 50. 40 A different set of neuroanatomical questions is raised by the behavioral results from this chapter, specifically that stimulation of the mPFC-to-DRN projection selectively affects one specific aspect of depression behavior but not others. MDD is a heterogenous illness, and the wide range of features that can characterize its clinical presentation include changes in emotionality, irritability, hedonic appraisal, sleep, appetite, concentration, energy, motivation, and psychomotor tone (American Psychiatric Association, 2013)—functions that could plausibly signify changes in a large number of neural pathways. Each of these features may be modulated by a unique set of brain areas and circuits. The FST is designed to capture behavioral despair (immobility) and escape behavior (swimming and climbing) in rodents; these behaviors may be analogous to certain features found in human depression (especially changes in energy and motivation), but likely have little relevance to other features (Cryan, Valentino, & Lucki, 2005). The selective effect of DRN axon-terminal stimulation on FST behaviors, but not on NSFT or FUST behaviors, may reflect the reality that each of these tests—and the circuitry that modulates the tested behaviors—only capture a small subset of the rodent behavioral analogues of symptoms of human depression. It is reasonable to hypothesize from Figures 2.2 & 3 that the mPFC-to-DRN projection mediates the motivation and energy an animal has available to navigate stressful situations, which is not relevant to the tasks measured by either the NSFT—in which an animal can avoid engaging with the stressful open field altogether by forgoing the food offered (Bodnoff et al.,
- 51. 41 1988)—nor the FUST, which involves only a rewarding stimulus (the smell of female urine) but nothing aversive or stressful (Malkesman et al., 2010). Only the FST requires an animal to engage with a stressful situation, and so only the FST will capture those particular aspects of depressive behavior. In summary, the implication of the behavioral pattern seen in these studies is that the mPFC-to-DRN projection modifies the expression of behavioral despair and escape behavior, but it is not involved in balancing anxiety with a drive for food as measured by the NSFT or hedonic activity as measured by the FUST. Further, I would hypothesize that other projections from the mPFC may mediate these different facets of the antidepressant response but leave the FST unaffected, a topic that will be explored in more detail in Chapter 4. To the extent that the stimulation protocol used here mimics the effects of ketamine, this pathway may play a similarly selective role in the ketamine antidepressant response, which will be explored in the next chapter.
- 52. 42 CHAPTER 3: Inhibition of DRN serotonin release blocks the antidepressant effect of ketamine 3.1. Introduction The optogenetic stimulation described in the last chapter was designed to mimic the effect of ketamine on glutamatergic neurons in the mPFC. Ketamine has been shown to induce a burst of glutamate release in the mPFC starting within an hour of local administration and fading by about 90 minutes post-administration (Moghaddam et al., 1997). This activation appears to critical to its antidepressant function, because blocking excitation in the infralimbic PFC negates ketamine’s behavioral effects (Fuchikami et al., 2015). After this initial burst of activity, a single administration of ketamine induces long-lasting changes in protein expression and neuronal structure in rodent brains, including activation of mTOR and increased dendritic-spine density (N. Li et al., 2010). Both the initial burst of glutamate and the longer-term changes—notably increased spine density 24 hours after stimulation—are reproduced by the optogenetic stimulation of infralimbic PFC neurons (Fuchikami et al., 2015). I hypothesized that optogenetic stimulation of DRN axon terminals would also mimic the effect of ketamine on this circuit, and thus that part of ketamine’s antidepressant effect would require mPFC glutamate release in the DRN. This hypothesis could be tested directly by blocking the effect of this pathway during ketamine administration. Glutamatergic input to the DRN would be expected to stimulate serotonin release, given that the primary
- 53. 43 neurotransmitter in a large majority of DRN neurons is serotonin (Weissbourd et al., 2014). It was important to block serotonin release transiently in order not to interfere with animal behavior during testing in the following days, as permanent DRN blockade can lead to changes in appetite and body temperature regulation, among other effects (Breisch, Zemlan, & Hoebel, 1976). To do this, I used 8OH-DPAT, a 5-HT1a agonist. 5-HT1a receptors are autoreceptors, which bind serotonin (usually released by the cell on which they are located or by nearby cells) and inhibit further serotonin release, providing a built-in brake on serotonin activity. 8OH- DPAT induces the blockade of serotonin release without disabling the serotonin system in the longer term. By microinfusing 8OH-DPAT into the DRN during systemic ketamine administration, I was able to analyze which aspects of the ketamine antidepressant response required DRN serotonin activity. 3.2. Methods 3.2.1. Animal care and surgery Adult male Sprague-Dawley rats (Charles River Laboratories) weighing 200-300 g were pair-housed on a 12-h light/dark cycle (lights on 07:00) with food and water available ad libitum. All procedures were done in accordance with guidelines for the care and use of laboratory animals and the Yale University Institutional Animal Care and Use Committee. Rats were anesthetized with an intraperitoneal injection of ketamine 80 mg/kg +
- 54. 44 xylazine 6 mg/kg. (This anesthetic dose of ketamine does not produce antidepressant behavioral or molecular changes.(N. Li et al., 2010)). They were then implanted with a guide cannula (Plastics One) inserted at 30° with the tip of the cannula dorsal and lateral to the DRN (-7.8 mm AP; +3.1 mm ML; the cannula was lowered along the DV axis until the 6mm cannula was flush with the skull). The internal cannula, when inserted during infusion, extended 1 mm beyond the end of the guide cannula. The cannula was held in place with a cement cap that was stabilized with two screws. Animals were given one week to recover from surgery before testing. 3.2.2. Drug administration 8-hydroxy-n,n-dipropylaminotetralin (8OH-DPAT; Abcam) was administered through the implanted cannula at a concentration of 1 mg/mL. A total of 1 µL was infused over the course of 1 minute, and the internal cannula remained in place for an additional 2 minutes to allow diffusion. Half the animals received 8OH-DPAT, and half received PBS solution. Fifteen minutes after the start of the infusion, ketamine (Sigma) 10 mg/kg was injected intraperitoneally. Half the animals received ketamine and half received 0.9% saline solution, in a 2x2 design (infusion x injection). Animals were then returned to their home cages; no testing was done on the day of drug administration.
- 55. 45 3.2.3. Behavioral tests The sequence of testing was as follows. The antidepressant effect of ketamine is detectable in rats for several days post-administration (N. Li, Liu, Dwyer, Banasr, Lee, Son, Li, Aghajanian, & Duman, 2011b), so each cohort of animals did multiple tests over the course of several days. - Day 1: pre-swim - Day 2: drug administration - Day 3: FST - Day 4: food deprivation starts - Day 5: NSFT - Day 6: FUST Forced-swim test (FST): Rats were placed in 25°C water in a clear Plexiglas cylinder (65 cm height, 30 cm diameter) initially for a 15-minute “pre-swim” to acclimate them to the procedure. Afterward, rats were removed and dried with a cloth. Twenty-four hours later, drugs were administered as described above. Twenty-four hours following treatment, rats were again placed in the swimming cylinders for a 10-min test swim. All sessions were video recorded and data were analyzed by scoring each 5- second time bin as being primarily one of three behaviors: immobility (making only movements necessary to keep afloat), swimming, or climbing. Data points from minutes 2-6 of the swim were used (5 minutes total). The number of bins in each condition was then multiplied by 5 seconds to estimate total time spent on each behavior.
- 56. 46 Novelty-suppressed feeding test (NSFT): Rats that had been deprived of food for 16-20 hours were placed in an open field (76.5 cm × 76.5 cm × 40 cm; acrylic) with a small amount of their normal chow in the center. Animals were allowed to explore the open field for up to 20 min. The output measured was time elapsed before approaching and taking a bite of the food. Time elapsed before taking a bite of food in the home cage (home-cage feeding, HCF) was measured as a control immediately after testing. Female-urine sniffing test (FUST): After 45 minutes of habituation to the testing room, animals were allowed to briefly sniff a cotton swab dipped in water, which was then affixed to the inside of the cage; their interaction with the swab was recorded for 3 minutes. Urine was then collected from adult females on the tips of cotton swabs, one for each animal being tested. 45 minutes after the water-swab test, animals were exposed to the urine-soaked swab and again recorded for 3 minutes. Videos were scored for time spent sniffing the swab. Locomotor activity (LMA): The NSFT was video-recorded and later analyzed for distance traveled in the first 5 minutes after placement in the chamber, using AnyMaze software. 3.2.4. Data analysis Data were analyzed using a two-way ANOVA (injection x infusion) with LSD post-hoc tests where appropriate. Significance was determined at p < 0.05. All data are represented as mean ± SEM.
- 57. 47 3.3. Results 3.3.1. Blockade of serotonin release prevents the antidepressant effect of ketamine on the FST To test the hypothesis that ketamine requires DRN activation for the antidepressant behaviors measured on the FST, I infused 8OH-DPAT into the DRN to block the release of serotonin 15 minutes before the administration of systemic ketamine (Figure 3.1.A). Four test groups were compared, varying by infusion and injection: PBS-saline, PBS-ketamine, DPAT-saline, and DPAT-ketamine. Ketamine reduced immobility when paired with a PBS infusion, but the group that received ketamine with an 8OH-DPAT infusion had a higher immobility time similar to controls; a two- way ANOVA showed a significant interaction between ketamine and 8OH- P B S - s a l P B S - k e t D P A T - s a l D P A T - k e t 0 50 100 150 Immobility time (s) A. B. Figure 3.1. 8OH-DPAT blocks the antidepressant effect of ketamine on the FST (A) The location of the guide cannula and target area for infusion (bregma -7.8) {Paxinos:1998ui}. (B) Systemic ketamine injection reduced immobility time when PBS was infused (p = 0.04, Fisher’s LSD), but 8OH-DPAT blocked this effect (p = 0.02, Fisher’s LSD). Data are expressed as time spent immobile during minutes 2- 6 of the test. n = 7-8 per group. * **
- 58. 48 DPAT (injection x infusion interaction F1,26 = 5.0, p = 0.03). Neither infusion status (F1,26 = 1.6, p = 0.2) nor injection status (F1,26 = 0.8, p = 0.4) had a significant main effect on immobility by two-way ANOVA. Consistent with results from the optogenetic stimulation of the mPFC to DRN projection, ketamine does not exert an antidepressant effect on the FST in the absence of DRN serotonin release. 3.3.2. The variation in immobility time induced by ketamine with or without 8OH-DPAT is accounted for by changes in swimming, not climbing Escape behavior on the FST consists of two distinguishable behaviors: swimming, in which the animal moves around the tank with mostly lateral forelimb movements; and climbing, in which the animal moves the forepaws perpendicular to the water against the side of the tank. Comparison of the effects of serotonergic and noradrenergic compounds has shown that climbing behavior, occurring mostly in the first few minutes of the test, is mediated by noradrenergic stimulation, while swimming, which predominates in the second half of the test, is mediated by serotonergic stimulation (Bogdanova, Kanekar, D'Anci, & Renshaw, 2013). Given that DRN serotonin release is required for the antidepressant effect of ketamine seen in Figure 3.1, I hypothesized that the difference in immobility would be due to increased swimming in the PBS-ketamine animals. Indeed, ketamine increased time spent swimming in PBS-infused animals, which was significant by post-hoc testing though the two-way ANOVA did not show a significant effect of injection (F1,26 = 1.8, p = 0.2), infusion (F1,26 = 0.07, p = 0.8), or interaction
- 59. 49 (F1,26 = 3.0, p = 0.09) (Figure 3.2.A). There was no difference by any measure in climbing behavior (injection F1,26 = 0.2, p = 0.6; infusion F1,26 = 1.6, p = 0.2; interaction F1,26 = 0.5, p = 0.5). Though not conclusive, the observed effect of ketamine on swimming time supports the conclusion that the its antidepressant effect as measured on the FST is mediated by serotonin release rather than norepinephrine. A. B. Figure 3.2. Ketamine increases swimming, not climbing, on the FST (A) Swimming behavior in minutes 2-6 of the FST, measured in number of 5- second bins in which each behavior predominated, multiplied by 5 seconds. Ketamine increased swimming time when paired with a PBS infusion (*p = 0.04, Fisher’s LSD). (B) Climbing behavior in minutes 2-6 of the FST showed no significant differences with ketamine treatment. n = 7-8 per group. * P B S - s a l P B S - k e t D P A T - s a l D P A T - k e t 0 50 100 150 200 Swimming time (s) P B S - s a l P B S - k e t D P A T - s a l D P A T - k e t 0 50 100 150 200 Climbing time (s)
- 60. 50 3.3.3. Blockade of serotonin release did not significantly change the effect of ketamine on other behavioral tests Next, I ran behavioral tests to assess whether 8OH-DPAT affected the ketamine-induced antidepressant effect on other behavioral dimensions: the NSFT, which measures anxiety behavior, or the FUST, which measures hedonic behavior (as discussed in Section 2.4 above). DPAT did not appear to change the effect of systemic ketamine injection on the NSFT, as there was a significant effect of the injection (F1,26 = 5.8, p = 0.02) but not the infusion (F1,26 = 0.004, p = 0.9) nor any interaction between the two (F1,26 = 0.07, p = A. B. Figure 3.3. 8OH-DPAT does not interfere with the effect of ketamine on the NSFT (A) Ketamine led to a downward trend in time to first bite on the NSFT (p = 0.07, Fisher’s LSD), which did not appear to be affected by 8OH-DPAT (p = 0.8, Fisher’s LSD). n = 7-8 per group. (B) Ketamine did not significantly increase urine-sniffing time on the FUST, nor did 8OH-DPAT induce a significant effect. n = 6-9 per group. P B S - s a l P B S - k e t D P A T - s a l D P A T - k e t 0 200 400 600 800 1000 Time to first bite P B S - s a l P B S - k e t D P A T - s a l D P A T - k e t 0 10 20 30 40 50 Time sniffing - water P B S - s a l P B S - k e t D P A T - s a l D P A T - k e t 0 10 20 30 40 50 Time sniffing - urine n.s.
- 61. 51 0.8) by two-way ANOVA (Figure 3.3.A). The variability on the FUST was too high to discern a significant effect of ketamine, so those results cannot be interpreted conclusively. 3.3.4. Animals show more baseline depression-like behavior when drug administration is performed by a male experimenter than by a female experimenter One additional factor was found to influence the expression of ketamine’s antidepressant effect: the sex of the experimenter administering the drugs. In order for animals to show a significant antidepressant response to ketamine, they have to exhibit some degree of baseline depression-like behavior. With a female experimenter, the behavior of both control and ketamine-exposed animals on the FST (Figure 3.4.A) and NSFT (Figure 3.4.C) was similar to that of animals who had received ketamine from a male experimenter (Figure 3.4.B and D). However, control animals had a higher level of depression-like behavior on both measures when the experiment was performed by a male, and thus there was separation between ketamine and control groups only with a male experimenter. Tests were initially performed with a female running all parts of the experiment; the higher-baseline results were obtained with a male performing only the drug administration with a female performing the behavioral tests.
- 62. 52 3.4. Discussion These results, using pharmacological tools to examine the mPFC to DRN pathway in relation to the antidepressant effect of ketamine, echo the results from the previous chapter, which used optogenetic stimulation to interrogate the same pathway. Both sets of experiments suggest that the mPFC to DRN projection modulates depression-like behavior on the FST and P B S - s a l P B S - k e t D P A T - s a l D P A T - k e t 0 200 400 600 800 1000 Time to first bite P B S - s a l P B S - k e t D P A T - s a l D P A T - k e t 0 50 100 150 Time immobile Time to first bite P B S - s a l P B S - k e t D P A T - s a l D P A T - k e t 0 200 400 600 800 1000 A. B. C. D. Figure 3.4. Depression-like behavior is higher in control groups when drugs are administered by a male experimenter than by a female experimenter (A) FST results from a female experimenter; (B) from a male experimenter (reproduced from Figure 3.1.B). Measured in seconds of immobility in minutes 2-6 of the test. (C) NSFT results from a female experimenter; (D) from a male experimenter (reproduced from Figure 3.3.A). P B S - s a l P B S - k e t D P A T - s a l D P A T - k e t 0 50 100 150 Time immobile * ** p = 0.07
- 63. 53 that ketamine activates this pathway to produce an antidepressant effect on the FST. Because ketamine directly affects glutamate signaling through NMDAR antagonism, it is considered a glutamatergic antidepressant, in contrast to the serotonergic and noradrenergic agents that are currently used clinically to treat depression. However, the interconnections between these neurotransmitter systems may facilitate changes in nuclei that primarily use different neurotransmitters from the one most directly affected by a given drug. The mPFC to DRN projection has been implicated in numerous aspects of depression-related behavior, which may represent a link between the glutamatergic actions of ketamine and the serotonergic actions of commonly used SSRIs. Notably, activation of this pathway has been found to reduce stress-induced depression behavior (Amat et al., 2005). There is also evidence that some of ketamine’s antidepressant actions are mediated by this pathway (Amat et al., 2016). The results described here are consistent with the idea that the mPFC exerts control over the expression of depression- related behaviors on the FST via its connection to the DRN and that ketamine utilizes this pathway for some of its antidepressant actions. The exact nature of the changes that mPFC activation induces within the DRN is a matter of some debate, especially regarding whether the net effect is to stimulate or inhibit DRN output and which target areas of the DRN are affected in turn (Chaki, 2017; Maier & Watkins, 2005). The DRN projects widely, including to the basolateral amygdala (BLA) and mPFC.
- 64. 54 Different studies have shown that ketamine reduces serotonin input to the BLA (Amat et al., 2016) and increases serotonin input to the mPFC (Fukumoto et al., 2017), which may indicate that various subpopulations of DRN cells are differentially affected by mPFC input. It is important to note that ketamine ameliorates stress-induced behaviors, and that its effect may be attenuated or changed in the absence of stress. The production of stress hormones induced by male scent was found to be a necessary condition for ketamine to exert an antidepressant effect in mice, and female scent blocked this effect (“Human experimenter modulates mouse behavioral responses to stress and to the antidepressant ketamine,” 2018). Rats also respond to male olfactory cues with a stress response (Sorge et al., 2014), and males may handle rats differently on average than females. Both of these factors may contribute to a greater baseline stress response in rats exposed to a male experimenter, which would induce changes in the DRN and elsewhere that ketamine can reverse. The DRN in particular undergoes numerous molecular and synaptic changes under stressful conditions (Amat et al., 2005), without which ketamine might not have the same function. Without the added stress of a male experimenter, rats may not be sufficiently stressed to display a depression-like phenotype that would distinguish controls from ketamine-exposed animals.
- 65. 55 CHAPTER 4: Optogenetic stimulation of infralimbic-originating terminals in the nucleus accumbens does not produce an antidepressant effect 4.1. Introduction Among the many targets of mPFC glutamatergic axons, several have been implicated in the pathogenesis of depression in addition to the DRN. Perhaps the best-studied of these is the nucleus accumbens (NAC), a key part of the brain’s reward circuitry due to the extensive dopaminergic input it receives from the ventral tegmental area (VTA)(Russo & Nestler, 2013). The NAC, especially its ventral portion, also receives substantial input from the mPFC, which is thought to stimulate GABAergic, inhibitory outputs of the NAC. Activation of this pathway correlates with improved MDD symptoms (Mayberg et al., 2000), which indicates a possible role in the mediation of some of the antidepressant effects induced by mPFC stimulation. However, the role that mPFC-mediated inhibition of the NAC may play in depression remains unclear, as NAC inhibitory output has also been implicated in depression-associated synaptic remodeling (Golden et al., 2013). In addition to this literature on the potential effects of mPFC stimulation, the NAC is also an interesting target because ketamine is known to increase synaptic plasticity in the NAC after stress (Belujon & Grace, 2014). I provided evidence in chapter 2 that the projection from mPFC to DRN is required for FST-related antidepressant behavior, but those data could not establish whether the effect was specific to the DRN and raised the
- 66. 56 question of which brain areas might be important for the other aspects of the antidepressant response induced by stimulation of ilPFC pyramidal neurons. To address that question, I stimulated mPFC-originating axon terminals in the NAC. These studies both provide a comparison to establish whether the effects of DRN axonal stimulation were specific to that region, and they may shed light on the unclear role of the mPFC to NAC projection in mediating depression-like behavior. Specifically, stimulation of ilPFC glutamatergic cells produced an antidepressant effect on both the NSFT and FUST that was not reproduced by stimulation of mPFC-originating terminals in the DRN. Given the central role of the NAC in mediating behavioral responses to reward (H. Hu, 2016), the NAC might be involved in mediating the behavioral response captured by the FUST, which measures hedonic reward-seeking (Malkesman et al., 2010), either selectively or in combination with other behavioral responses. 4.2. Methods 4.2.1. Animal care and surgery Adult male Sprague-Dawley rats (Charles River Laboratories) weighing 200-300 g were pair-housed on a 12-h light/dark cycle (lights on 07:00) with food and water available ad libitum. All procedures were done in accordance with guidelines for the care and use of laboratory animals and the Yale University Institutional Animal Care and Use Committee. Rats were anesthetized with an intraperitoneal injection of ketamine 80 mg/kg +
- 67. 57 xylazine 6 mg/kg. (This anesthetic dose of ketamine does not produce antidepressant behavioral or molecular changes.(N. Li et al., 2010)) They were then injected with AAV2/CaMKIIa-ChR2(H134R)-eYFP (University of North Carolina Vector Core) 0.5 µL per side at a rate of 0.1 µL/min into the infralimbic PFC (+3.0 mm AP; ±0.6 mm ML; -5.0 mm DV). Bilateral optical fibers (Doric Lenses) with fiberoptic attachment ports were then inserted at a 9° angle with the tip of the fiber positioned at the dorsal edge of the nucleus accumbens (AP +1.6 mm, ML ±1.0 mm, DV -6.2 mm), so both shell and core were exposed to laser light. Animals had 4 weeks after surgery to recover and to ensure adequate viral expression. 4.2.2. Optogenetic stimulation A fiberoptic cable (Doric Lenses) was attached to the port on the animal’s head, and the laser was turned on (for the stimulated group) or left off (for the control group). Stimulation was conducted over the course of one hour: pulse width, 15 ms; frequency 10 Hz; intensity, 5 mW; 473 nm blue light; each minute of laser on time was alternated with one minute of laser off time to avoid any possibility of tissue damage. 4.2.3. Behavioral tests The sequence of testing was as follows: - Day 1: pre-swim - Day 2: optogenetic stimulation - Day 3: FST
- 68. 58 - Day 4: food deprivation starts - Day 5: NSFT - Day 6: FUST Forced-swim test (FST): Rats were placed in 25°C water in a clear Plexiglas cylinder (65 cm height, 30 cm diameter) initially for a 15-minute “pre-swim” to acclimate them to the procedure. Afterward, rats were removed and dried with a cloth. Twenty-four hours later, drugs were administered as described above. Twenty-four hours following treatment, rats were again placed in the swimming cylinders for a 10-min test swim. All sessions were video recorded and data were analyzed by scoring each 5- second time bin as being primarily one of three behaviors: immobility (making only movements necessary to keep afloat), swimming, or climbing. Data points from minutes 2-6 of the swim were used (5 minutes total). Novelty-suppressed feeding test (NSFT): Rats that had been deprived of food for 16-20 hours were placed in an open field (76.5 cm × 76.5 cm × 40 cm; acrylic) with a small amount of their normal chow in the center. Animals were allowed to explore the open field for up to 20 min. The output measured was time elapsed before approaching and taking a bite of the food. Time elapsed before taking a bite of food in the home cage (home-cage feeding, HCF) was measured as a control immediately after testing. Female-urine sniffing test (FUST): After 45 minutes of habituation to the testing room, animals were allowed to briefly sniff a cotton swab dipped in water, which was then affixed to the inside of the cage; their interaction
- 69. 59 with the swab was recorded for 3 minutes. Urine was then collected from adult females on the tips of cotton swabs, one for each animal being tested. 45 minutes after the water-swab test, animals were exposed to the urine-soaked swab and again recorded for 3 minutes. Videos were scored for time spent sniffing the swab. Locomotor activity (LMA): The NSFT was video-recorded and later analyzed for distance traveled in the first 5 minutes after placement in the chamber, using AnyMaze software. 4.2.4. Data analysis Behavioral data were analyzed using a two-tailed t-test to compare control vs. stimulated conditions. Significance was determined at p < 0.05. All data are represented as mean ± SEM.
- 70. 60 4.3. Results 4.3.1. ChR2 is expressed in axon terminals in both shell and core of the NAC Neurons in the mPFC send axons to both the shell and the core of the NAC, with prelimbic synapses outnumbering infralimbic ones (Vertes, 2004). The shell and core regions have distinct functions in reward processing, but any differential role in mood regulation is unclear (Price & Drevets, 2009). Interestingly, the brain area in humans that is most sensitive to deep-brain NAC shell NAC core LV A. B. C. D. Figure 4.1. ChR2 expression in the nucleus accumbens after viral injection into the mPFC The target area of virus injection in the ilPFC (bregma +3.2mm; dotted pattern); and the location of the bilateral implanted fiberoptics (dark gray dotted line out-of-plane, solid line in-plane) and target area of light stimulation in the NAC (bregma +1.6mm) in (A) sagittal section and (B) coronal section {Paxinos:1998ui}2. (C) Representative GFP-tagged ChR2 expression in the NAC. (LV: lateral ventricle). (D) Cannula placement locations for the experiments described in Figure 4.2; Os are correctly placed and Xs are misses. The blue box indicates the target area for the tip of the cannula that would ensure light exposure to both shell and core of the NAC. Misses were excluded from results. One additional incorrect placement was out of plane and not shown.
- 71. 61 stimulation, Cg25 (Mayberg et al., 2005), projects directly the NAC shell (Price & Drevets, 2009). The fiberoptics in this experiment were place so that both the shell and core received photostimulation in order to activate the greatest number of axons (Figure 4.1.A). As with the previous experiments, the infralimbic PFC was targeted for viral expression (Figure 4.1.B), but there was substantial expression in the prelimbic region as well. Staining revealed robust ChR2 expression in both shell and core (Figure 4.1.C). The nearby caudate/putamen also had significant virus expression, but the angle of the fiberoptic and the ventral-facing tip should minimize light exposure to that region. 4.3.2. Photostimulation of axon terminals in the NAC did not produce an antidepressant effect Using the same protocol as with the DRN-stimulation experiments, axon terminals in the NAC were stimulated and behavioral testing begun the following day. No significant effects were found on the FST (t11 = 1.0, p = 0.3) (Figure 4.2.A), in contrast to DRN stimulation. There were no significant behavioral differences as measured by the NSFT (t9 = 0.4, p = 0.7) or FUST (t10 = 1.0, p = 0.3) (Figure 4.2.B and C). Stimulated animals spent a non- significantly greater amount of time sniffing the urine swab than non- stimulated controls did, but variability was too high to draw any conclusions from this finding.
- 72. 62 4.4. Discussion These results provide a basis for comparison to the effects of DRN stimulation. Activation of the mPFC to NAC projection does not produce an antidepressant effect on the FST, indicating that the antidepressant effect of DRN terminal stimulation is a specific property of that pathway. This result is also further evidence that the effect of DRN terminal stimulation is not mediated by back-propagating action potentials activating mPFC cell bodies, A. B. C. Figure 4.2. Stimulation of mPFC-originating NAC axon terminals does not produce an antidepressant effect No significant effect of stimulation on the (A) FST (p = 0.3, t-test), (B) NSFT (p = 0.7, t- test), or (C) urine-sniffing time on the FUST (p = 0.3, t-test). n = 4-9 per group. c o n t r o l - w a t e r s t i m u l a t e d - w a t e r c o n t r o l - u r i n e s t i m u l a t e d - u r i n e 0 20 40 60 Time sniffing c o n t r o l s t i m u l a t e d 0 200 400 600 Time to first bite c o n t r o l s t i m u l a t e d 0 5 10 15 20 25 Immobility