
Empfohlen
Weitere ähnliche Inhalte
Was ist angesagt?
Was ist angesagt? (19)
Ähnlich wie 2 Fundamentals of Google Analytics
Ähnlich wie 2 Fundamentals of Google Analytics (20)
Mehr von Friday Explorer
Mehr von Friday Explorer (15)
Kürzlich hochgeladen
Kürzlich hochgeladen (20)
2 Fundamentals of Google Analytics
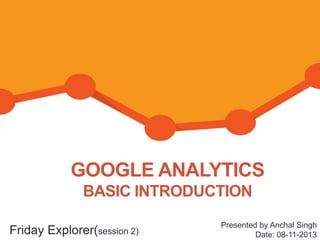
- 1. GOOGLE ANALYTICS BASIC INTRODUCTION Friday Explorer(session 2) Presented by Anchal Singh Date: 08-11-2013
- 2. Overview • What’s Web Analytics & GA • Who will use GA • Why GA • How to set up a GA Account • How GA works • GA Basics • Fundamentals • What’s in for web • What’s in for Media • What’s in for Social • What’s in for Search
- 3. • What’s Web Analytics & GA Web analytics is the measurement, collection, analysis and reporting of internet data for purposes of understanding and optimizing web usage.
- 4. Who will use GA Search Web GA Social Media
- 5. Why GA To Understand What is Working To Fix Things that Are not Working
- 6. PDCA
- 7. How to set up a GA account
- 8. 1 2
- 9. 3
- 10. Two ways to add GA Tracking code Place the code in template of website Use Google Tag Manager
- 11. Add code to template file
- 12. Use Google Tag Manager
- 13. How GA works
- 16. Dashboard view
- 17. Dashboard View
- 19. Glossary • Session/Visit • Session time out • Goal • Page Views • Page/Visits
- 21. Page visit Duration & Time spent on website Page 1 Page 2 08:00 08:05 Session end @ 08:20 Page 3 08:15
- 22. Fundamentals
- 23. Bounce Page view = 0 Visit Duration = 0 Page 1
- 24. Adjusted Bounce Rate Page view = 1 Visit Duration = 2 min Page 1
- 25. Exit Rate v/s Bounce Rate Monday Page B Page A Tuesday Page B Exit Wednesda y Page A Page C Thursday Page C Exit Friday Page B Page C Page C Page B Page A • Exit Rate: • Page A: 33% (only 3 of 5 sessions included Page A) • Page B: 50% (only 4 of 5 sessions included Page B) • Page C: 50% (only 4 of 5 sessions included Page C) • Bounce Rate: • Page A: 0% (no sessions began with Page A, so it has no bounce rate) • Page B: 33% (bounce rate is higher than exit rate, because 3 sessions started with Page B, with one leading to a bounce) • Page C: 100% (one session started with Page C, and it lead to a bounce)
- 26. What’s in for web? • Vanity URL- Integrating offline initiatives with online • Excluding IPs for tracking • Event tracking • Basic Goal • Ad unit performance(multiple ad units, route working or not etc) • Visitors flow • In page analytics
- 27. Visitors flow
- 28. Page load
- 30. What’s in for Media? • Campaign Performance
- 31. What’s in for Search? • Link web master & ad tools
- 33. Now soon to be moved to: Queries
- 34. Landing pages
- 36. What’s in for Social? • Social referrals-Code for posts • Data Hub Activity
- 37. Thank you
- 38. Q&A
Hinweis der Redaktion
- Web analytics is the study of online behavior in order to improve it. And the critical part here is the in order to improve it section. We're not just here to look at pretty pie charts for sake of fancy reports. We need to find those insights that will allow us to take action, and actually improve our sites based on those pretty reports.It's perhaps just as important to realize what a Web analytics is not. Let's take this by way of a common analogy.Web analytics software is like an x-ray machine. In this case, the patient is your Web site, and the x-ray machine is Google Analytics. The tool will identify and display exactly what's going on under the skin of your Web site, much like this x-ray will detect and display the broken bones.However, it won't end your pain, and it won't ultimately fix your problem. For that, you're going to need someone who can actually read and interpret the x-ray, and perform the analysis necessary to actually take action, and improve the situation.This is why even the best or most expensive analytics tools still won't do it for you. You still need smart people like yourselves at the helm of the tool in order to get any real improvement. And like any good doctor, we're going to assess the entire situation. We're going to perform triage to figure out which areas need the attention first, such as prioritizing the skull over the finger. After we address that appropriately, maybe by prescribing some drugs to deal with the swelling, we move on to the next issue, and we continue down the line, constantly analyzing, adjusting, improving, and optimizing.Web analytics is a process, and set it and forget it has no place here. We first perform the measurement, we apply analysis and learn from what we see, and then we take action. Our site is constantly changing, our marketing is changing, the tools themselves are changing, and the Web is continually changing; even the world itself is ever changing. We need to make sure our analytics process doesn't become stale, but rather evolves and keeps up with those changes in order to ensure our site is always performing at its best.
- PDCA(Plan-do-check-act)The four phases in the Plan-Do-Check-Act Cycle involve:Plan: Identifying and analyzing the problem.Do: Developing and testing a potential solution.Check: Measuring how effective the test solution was, and analyzing whether it could be improved in any way.Act: Implementing the improved solution fully.
- Dimensions define characteristics of users, their sessions & actionsMetrics are quantitative measurements of users actions & sessions
- Bounce rate is the percentage of visits that go only one page before exiting a site.There are a number of factors that contribute to your bounce rate. For example, visitors might leave your site from the entrance page if there are site design or usability issues. Alternatively, visitors might also leave the site after viewing a single page if they've found the information they need on that one page, and had no need or interest in visiting other pages.
- There is a solution to this - something that we call “Adjusted bounce rate”. You implement a small tweak to your Google Analytics code, which executes an event when a user has spent over a certain amount of time on the webpage. Depending on the website, the time can range from 10 seconds to few minutes - you should decide for yourself the amount of time you consider the user to be sufficiently engaged with your website or product.Once the event is executed, the visitor is no longer counted as “bounce,” even though no additional pageview is recorded. This will mean your bounce rate will show users who have not spent a required “minimal time” on your website - the ones who have really bounced.
- Now let's extend this example to explore the Exit rate and Bounce rate metrics for a series of single-session days on your site.Monday: Page B > Page A > Page CTuesday: Page B > ExitWednesday: Page A > Page C > Page BThursday: Page C > ExitFriday: Page B > Page C > Page AThe % Exit and Bounce rate calculations are:Exit Rate: Page A: 33% (only 3 of 5 sessions included Page A)Page B: 50% (only 4 of 5 sessions included Page B)Page C: 50% (only 4 of 5 sessions included Page C)Bounce Rate:Page A: 0% (no sessions began with Page A, so it has no bounce rate)Page B: 33% (bounce rate is higher than exit rate, because 3 sessions started with Page B, with one leading to a bounce)Page C: 100% (one session started with Page C, and it lead to a bounce)
- Ad uni
- Ad units, portals, time on site, bounce, conversions
- Key words giving conversion & organic search
- Informs us what content is most searched, relatively changes could be made