allstate Quarter Information 2008 3rd Earnings Press Release
1. Allstate Reports 2008 Third Quarter Results
Catastrophe Losses and Investment Valuation Declines
Partially Offset by Ongoing Risk Mitigation Actions
o Catastrophe losses of $1.8 billion, including losses from Hurricanes Ike and Gustav, were partially
mitigated by exposure reduction actions and reinsurance.
o Pretax net realized capital losses of $1.3 billion reflect unprecedented declines in credit markets,
partially offset by positive impact of risk mitigation programs.
o Profitability from underlying underwriting remains strong and within fullyear outlook range.
o Strong liquidity and capital positions.
NORTHBROOK, Ill., October 22, 2008 – The Allstate Corporation (NYSE: ALL) today reported results for
the third quarter of 2008:
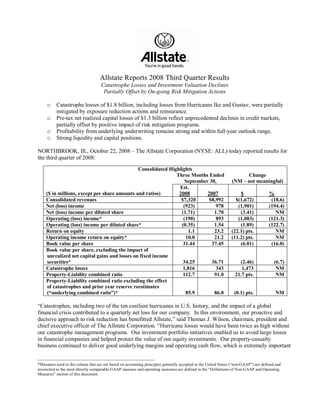
Consolidated Highlights
Three Months Ended Change
September 30, (NM – not meaningful)
Est.
($ in millions, except per share amounts and ratios) 2008 2007 $ %
Consolidated revenues $7,320 $8,992 $(1,672) (18.6)
Net (loss) income (923) 978 (1,901) (194.4)
Net (loss) income per diluted share (1.71) 1.70 (3.41) NM
Operating (loss) income* (190) 893 (1,083) (121.3)
Operating (loss) income per diluted share* (0.35) 1.54 (1.89) (122.7)
Return on equity 1.1 23.2 (22.1) pts. NM
Operating income return on equity* 10.0 21.2 (11.2) pts. NM
Book value per share 31.44 37.45 (6.01) (16.0)
Book value per share, excluding the impact of
unrealized net capital gains and losses on fixed income
securities* 34.25 36.71 (2.46) (6.7)
Catastrophe losses 1,816 343 1,473 NM
PropertyLiability combined ratio 112.7 91.0 21.7 pts. NM
PropertyLiability combined ratio excluding the effect
of catastrophes and prior year reserve reestimates
(“underlying combined ratio”)* 85.9 86.0 (0.1) pts. NM
“Catastrophes, including two of the ten costliest hurricanes in U.S. history, and the impact of a global
financial crisis contributed to a quarterly net loss for our company. In this environment, our proactive and
decisive approach to risk reduction has benefitted Allstate,” said Thomas J. Wilson, chairman, president and
chief executive officer of The Allstate Corporation. “Hurricane losses would have been twice as high without
our catastrophe management programs. Our investment portfolio initiatives enabled us to avoid large losses
in financial companies and helped protect the value of our equity investments. Our propertycasualty
business continued to deliver good underlying margins and operating cash flow, which is extremely important
________________________________________________________
*Measures used in this release that are not based on accounting principles generally accepted in the United States (“nonGAAP”) are defined and
reconciled to the most directly comparable GAAP measure and operating measures are defined in the “Definitions of NonGAAP and Operating
Measures” section of this document.
2. in this economic climate. As a result, Allstate has maintained strong liquidity and capital positions which
protect our customers and shareholders in these difficult times.”
Allstate’s operating loss of $190 million for the third quarter of 2008 is primarily attributable to catastrophe
pretax losses of $1.8 billion from 35 events, including Hurricanes Ike and Gustav. The $923 million net loss
for the third quarter of 2008 reflects the operating loss and net realized capital losses of $728 million.
Catastrophe Mitigation Impact
Losses from Hurricanes Ike and Gustav were mitigated by catastrophe exposure management actions taken
over the last several years, which include reductions in policies in force, reinsurance and policy changes.
Reflecting the combination of reduced policies in force and ceded wind coverage in the coastal regions of
Texas and Louisiana, at the beginning of the third quarter of 2008, the Company’s catastrophe exposure was
42% and 33%, respectively, below 2006 levels. Reinsurance recoverables during the quarter offset losses by
$246 million. Allstate’s analysis shows that the Company’s losses from Hurricanes Ike and Gustav would
have been approximately twice the amount recorded in the third quarter without the catastrophe exposure
management actions and reinsurance programs put into place beginning in 2005.
Investment Portfolio Risk Mitigation Impact
As of September 30, 2008, Allstate's consolidated total investments were $105 billion, with more than two
thirds in investment grade fixed income securities. From June 30, 2008 to September 30, 2008, the
Company’s portfolio value declined by approximately $8.6 billion, primarily reflecting reduced market
valuations of $4.6 billion and net sales of $3.8 billion to fund net reductions in liabilities. The $4.6 billion
decline in market valuations during the period was predominantly due to the widening of credit spreads and,
to a lesser extent, equity market value declines. The decline was reflected through a $3.3 billion increase in
net unrealized losses and $1.3 billion of realized capital losses.
Net realized capital losses for the third quarter of $1.3 billion on a pretax basis reduced net income by $728
million. Net realized capital losses primarily consisted of impairment writedowns of $666 million and
change in intent writedowns of $453 million. While change in intent losses flow through the income
statement, the Company believes the flexibility the classification provides enables it to execute faster market
decisions. Since valuation related losses on these assets are realized each period, any potential losses realized
upon sale will be limited to declines in value since the last reporting date.
Net unrealized losses, primarily reflecting depressed valuations from widening credit spreads, were $4.1
billion as of September 30, 2008. Gross unrealized losses as of September 30 were $6.3 billion, $2.5 billion
higher than June 30, 2008. Given its current level of liquidity, the Company intends and believes it has the
ability to hold these assets to recovery and therefore does not anticipate significant conversion from
unrealized to realized losses.
The Company employs proactive risk mitigation and return optimization programs, which were augmented in
June, 2008. The programs consist of macrohedging actions, including equity hedges, interest rate risk
hedges and credit spread risk hedges, as well as reductions in residential and commercial real estate holdings
and financial assets. For investments under this program, the Company changed its intent to hold to recovery,
which resulted in realized losses affecting the income statement.
During the third quarter, Allstate sold 33% of securities identified as part of the targeted $3.3 billion risk
mitigation program. These assets were sold at approximately 95% of the fair values reported at June 30,
2008. Also during the quarter, Allstate’s macrohedging program produced gains that partially offset
investment losses.
2
3. Strong Capital and Liquidity Positions
Allstate maintains strong liquidity and capital supported by ongoing catastrophe management actions and
proactive investment risk mitigation and return optimization programs. As of September 30, 2008, the
Company held capital totaling $16.9 billion, including $5.0 billion in invested assets at the holding company
level, including Kennett Capital, Inc. These assets are available to meet general corporate purposes such as
dividends, debt servicing and share repurchases and to support operating subsidiaries through capital
contributions or intercompany borrowing arrangements. In October, Allstate’s board of directors approved
infusions of up to $1.25 billion of additional capital into Allstate Life Insurance Company (“ALIC”) through
Allstate Insurance Company and funded by the holding company.
The Company believes its current portfolio position and strong underlying operating cash flows provide
sufficient liquidity to meet its needs. As of September 30, Allstate maintained $5.4 billion, or 5.1% of total
investments, in sameday or nextday liquidity and $33.4 billion, or 31.9% of total investments, in assets that
are generally saleable within ninety days. The Company also has access to a longterm, untapped revolving $1
billion line of credit available from a group of 13 banks through 2012. Allstate has had no commercial paper
obligations outstanding in 2008 and no corporate debt coming due until $750 million is scheduled to mature
in December 2009.
During the third quarter, Allstate further enhanced its liquidity position with a series of actions, including
reducing its securities lending portfolio to $1.6 billion, shortening its investment portfolio duration, and early
retirement of institutional markets deposits. In October, Allstate suspended its $2.0 billion share repurchase
program and does not plan to complete it by the original target date of March, 2009. The Company will re
evaluate this program as market conditions develop in 2009. The number of shares repurchased under the
program during the quarter was 9.9 million shares for $449 million.
“We’ve taken proactive and prudent steps to maintain strong capital and liquidity positions,” said Don Civgin,
Allstate’s chief financial officer. “In these uncertain times we will remain vigilant. Our top priority is to
ensure we have the capital and liquidity necessary to serve our customers and continue to deliver solid returns
to our shareholders.”
Continued Underlying Business Profitability
Allstate’s PropertyLiability business continued to produce strong underlying profitability. Favorable
frequency combined with moderate severity to produce an underlying PropertyLiability combined ratio of
85.9 for the quarter. Allstate Financial operating income declined to $88 million in the third quarter of 2008
from $147 million in the prior year quarter, reflecting lower investment spreads related to market conditions,
proactive actions taken to improve liquidity and lower benefit spreads.
Outlook
“We expect volatile financial markets and tough economic conditions to persist for some time. Our focus will
remain on running our businesses efficiently and effectively to serve our customers and proactively managing
catastrophe and investment risk,” concluded Wilson. Allstate expects its PropertyLiability underlying
combined ratio, which excludes the effects of catastrophes and prior year reserve reestimates, to be at the
favorable end of the previously stated range of 86.0 and 88.0 for the full year 2008.
3
4. PERFORMANCE HIGHLIGHTS
Consolidated
· Consolidated revenues were $7.3 billion in the third quarter of 2008 compared to $9.0 billion in the third
quarter of 2007, reflecting net realized capital losses in the third quarter of 2008 compared to net realized
capital gains in the third quarter of 2007.
· Operating loss per diluted share was $0.35 in the quarter compared to operating income per diluted share
of $1.54 in the third quarter of 2007, reflecting higher catastrophe losses. Catastrophe losses per diluted
share, aftertax, were $2.19 and $0.38 in the third quarter of 2008 and 2007, respectively.
· Net loss per diluted share was $1.71 in the quarter compared to net income per diluted share of $1.70 in
the third quarter of 2007, reflecting net realized capital losses in the third quarter of 2008 compared to net
realized capital gains in the third quarter of 2007 and an operating loss in the third quarter of 2008
compared to operating income in the third quarter of 2007.
BUSINESS HIGHLIGHTS
Three Months Ended Nine Months Ended
($ in millions, except ratios) September 30, September 30,
Est. % Est. %
2008 2007 Change 2008 2007 Change
PropertyLiability
Premiums written* $6,966 $7,075 (1.5) $20,283 $20,623 (1.6)
Underwriting (loss) income* (865) 617 NM (79) 2,508 (103.1)
Net (loss) income (661) 935 (170.7) 281 3,514 (92.0)
Combined Ratio 112.7 91.0 21.7 pts 100.4 87.7 12.7 pts
Allstate Financial
Premiums and deposits* $1,896 $2,302 (17.6) $9,395 $7,817 20.2
Operating income 88 147 (40.1) 349 457 (23.6)
Net (loss) income (196) 70 NM (686) 434 NM
Investments
Net investment income $1,355 $1,603 (15.5) $4,293 $4,808 (10.7)
Realized capital gains and losses (1,288) 121 NM (3,158) 1,137 NM
Total investments 104,983 121,129 (13.3)
Net unrealized capital gains and
losses (pretax) (4,099) 2,606 NM
PropertyLiability
PropertyLiability premiums written declined 1.5% in the third quarter of 2008 from the third quarter of
·
2007. Excluding the impact of the catastrophe reinsurance program, PropertyLiability premiums written
declined 2.4% in the quarter.
Allstate brand standard auto premiums written declined 0.7% in the third quarter of 2008 from the third
·
quarter of 2007. Contributing to this result were the following:
1.1% decrease in policies in force (“PIF”)
0.5 point decline in the six month renewal ratio to 88.9%
0.9% increase in six month average premium before reinsurance to $427
2.7% decrease in new issued applications
4
5. · Allstate brand homeowners premiums written declined 0.9% in the third quarter of 2008, compared to the
prior year quarter, primarily due to our catastrophe risk management actions. Contributing to this result
were the following:
4.0% decrease in PIF
1.0 point increase in the twelve month renewal ratio to 87.3%
0.7% increase in twelve month average premium before reinsurance to $852
23.4% decrease in new issued applications
$49 million decrease in catastrophe reinsurance costs
· Standard auto property damage frequency decreased 11.8% and bodily injury frequency decreased 13.7%
in the third quarter of 2008 compared to the third quarter of 2007, which may be in part due to a reduction
in the number of miles driven. Claim severities (average paid cost per claim) for auto property damage
and bodily injury decreased 0.3% and increased 6.4%, respectively. Increased catastrophe losses,
however, led to a 0.9 point increase in the Allstate brand standard auto loss ratio in the third quarter of
2008 compared to the third quarter of 2007.
· Homeowners gross claim frequency, excluding catastrophes, increased 6.6% in the third quarter of 2008
compared to the third quarter of 2007 fueled by noncatastrophe weatherrelated claim trends. Claim
severity (average paid cost per claim) for homeowners, excluding catastrophes, decreased 4.2% in the
third quarter of 2008 compared to the third quarter of 2007. Higher catastrophe losses resulted in an 89.7
point increase to 158.1 in the Allstate brand homeowners loss ratio in the third quarter of 2008 compared
to the third quarter of 2007. The effect of catastrophe losses on the Allstate brand homeowners loss ratio
totaled 106.2 in the third quarter of 2008 compared to 19.8 in the third quarter of 2007.
· Catastrophe losses for the quarter totaled $1.8 billion, compared to $343 million in the third quarter of
2007, impacting the combined ratio by 26.8 points in the third quarter of 2008 and 5.0 points in the third
quarter of 2007. Catastrophe losses for the quarter include estimates of losses for Hurricanes Ike and
Gustav of $944 million and $459 million, respectively, among other events. The catastrophe losses for
Hurricane Ike reflect reinsurance recoverables of $246 million. Hurricane Ike catastrophe losses included
$325 million related to states other than Texas. Hurricane Ike is expected to be among the top three
costliest U.S. hurricanes along with Hurricane Katrina of 2005 and Hurricane Andrew of 1992. Hurricane
Gustav is expected to be among the top 10 costliest U.S. hurricanes. See the Catastrophe Losses,
Reinsurance and Exposure Management section of this document for further detail.
· PropertyLiability prior year reserve reestimates for the third quarter of 2008 netted to zero, compared to
unfavorable prior year reserve reestimates of $52 million in the third quarter of 2007. Prior year reserve
reestimates in the third quarter of 2007 resulted from the annual discontinued lines reserve study.
5
6. · Allstate expects the PropertyLiability underlying combined ratio will be at the favorable end of the range
of 86.0 and 88.0 for the full year 2008. The calculations of the underlying combined ratio for the three
months and nine months ended September 30 are shown in the table below. Favorable reserve
reestimates are shown in parenthesis.
Three Months Ended Nine Months Ended
September 30, September 30,
Est. Est.
2008 2007 2008 2007
Combined ratio excluding the effect of catastrophes
and prior year reserve reestimates (“underlying
85.9 86.0 85.2 84.7
combined ratio”)
Effect of catastrophe losses 26.8 5.0 15.2 4.6
Effect of prior year noncatastrophe reserve reestimates (1.6)
112.7 91.0 100.4 87.7
Combined ratio (GAAP)
Effect of prior year catastrophe reserve reestimates 0.8 0.6 0.5
Allstate Financial
· Premiums and deposits in the third quarter of 2008 were $1.9 billion, a decrease of $406 million or 17.6%
from the prior year quarter. This decrease is due to the absence of issuances of institutional products in
the third quarter of 2008 compared to $500 million in the prior year quarter, partially offset by an increase
in retail premiums and deposits of $94 million or 5.2% due to an increase in deposits on fixed deferred
annuities of 14.3%.
· Operating income for the third quarter of 2008 was $88 million, a decrease of $59 million from the prior
year quarter. The decline was primarily due to lower investment spreads, reduced benefit spreads on life
and annuities reflecting unfavorable mortality experience and increased operating expenses related to our
continuing efforts to reinvent protection and retirement for consumers, partially offset by lower
amortization of deferred policy acquisition costs (“DAC”).
· Net loss for the third quarter of 2008 was $196 million compared to net income of $70 million in the prior
year quarter. The decline was primarily due to a $209 million increase in aftertax net realized capital
losses including the effect of DAC and deferred sales inducements accretion related to the net realized
capital losses, and a $59 million decline in operating income.
· During the third quarter of 2008, we retired $2.2 billion of institutional market deposits for which
investors had elected to nonextend their maturity date through a combination of maturities, calls, and
acquisitions in the secondary market. Total outstanding nonextended institutional market deposits were
$1.3 billion as of September 30, 2008, all of which become due before the end of the third quarter of
2009. We have accumulated, and expect to maintain, shortterm and other maturing investments to fund
the retirement of these obligations.
Investments
During the third quarter, reflecting decisions made and reported at the end of the second quarter, we
·
pursued risk mitigation and return optimization programs to protect portfolio value. These programs
performed as intended. Our stock market portfolio hedge, for example, experienced realized capital gains
of $76 million which partially offset the impact of a 9% market decline on a large portion of our publicly
traded equities portfolio. See derivative instruments table in the Realized Capital Gains and Losses
Analysis section. During the third quarter of 2008, we sold $1.1 billion of investments that we believed
to be vulnerable to significant additional credit and pricing pressures. See the Investments section of this
document for more detail on investments for which we changed our intent to hold to recovery. We also
6
7. implemented hedges to mitigate equity market risk, interest rate and credit spread risk.
Consolidated net investment income was $1.4 billion in the third quarter of 2008, a decline of $248
·
million or 15.5% from $1.6 billion in the third quarter of 2007. PropertyLiability net investment income
decreased to $386 million in the third quarter of 2008 from $474 million in the third quarter of 2007, a
decline of $88 million or 18.6%. This decline was due to lower average asset balances reflecting
dividends to the parent company, reduced portfolio yields and valuation losses on limited partnership
interests accounted for in accordance with the equity method of accounting in the current year quarter
compared to income in the prior year quarter. Allstate Financial net investment income decreased to $937
million in the third quarter of 2008 from $1.1 billion in the third quarter of 2007, a decline of $149
million or 13.7%. This decline was primarily due to lower yields on floating rate securities, increased
shortterm investment balances reflecting liquidity management, lower average asset balances, and
valuation losses on limited partnership interests in the current year quarter compared to income in the
prior year quarter.
· Net realized capital losses were $1.3 billion on a pretax basis for the quarter, due to $666 million of
impairment writedowns, $453 million of change in intent writedowns, $137 million of sales and $32
million of net losses on the settlement and valuation of derivative instruments. This compares to net
realized capital gains of $121 million in the prior year quarter that were driven primarily by net gains on
sales of $206 million partially offset by net losses on the valuation and settlement of derivative
instruments of $50 million and impairment writedowns of $24 million. See the Realized Capital Gains
and Losses Analysis section of this document for more information.
· Impairment writedowns of $666 million in the quarter comprised $488 million related to fixed income
securities (primarily related to financial services sector corporate bonds, synthetic collateralized debt
obligations, and AltA mortgagebacked securities), $139 million related to equity securities, and $39
million related to limited partnership interests. Over 71% of the impairment writedowns on fixed income
securities are performing in line with anticipated or contractual cash flows, but were written down
primarily because of expected deterioration in the performance of the underlying collateral. Equity
securities were written down primarily due to the length of time and extent fair value was below cost.
· Change in intent writedowns of $453 million in the third quarter of 2008 were primarily a result of our
risk mitigation and return optimization programs, strategic asset allocation actions and ongoing
comprehensive reviews of our portfolios. These losses include $392 million related to securities for
which we changed our intent to hold to recovery in the second quarter of 2008 that we still hold at
September 30 and $61 million related to securities for which we changed our intent to hold to recovery in
the third quarter of 2008 due to unanticipated changes in facts and circumstances. In the third quarter of
the prior year, realized capital losses related to change in intent writedowns totaled $11 million.
· Net realized capital losses from sales of investments totaled $137 million in the quarter, compared to
$206 million of net gains in the prior year quarter. This included $146 million of writedowns for equity
securities effectively carried on a lower of cost or fair value basis.
· Net realized capital losses on the valuation and settlement of derivative instruments totaled $32 million
for the third quarter of 2008 and included $132 million of gains for previously established risk reduction
programs. These gains were offset by $40 million of losses for income generation programs involving
replication and $124 million of losses for the accounting valuation of embedded equity options in fixed
income securities, mainly from equity indexed notes and convertible bonds. In the third quarter of 2007,
net realized capital losses on the valuation and settlement of derivative instruments totaled $50 million
and included net losses of $98 million on risk mitigation programs and $9 million of net losses for the
accounting valuation of embedded equity options in fixed income securities, partially offset by net gains
of $57 million for income generation programs.
7
8. · Consolidated total investments were $105.0 billion as of September 30, 2008, a decline of $8.6 billion
from June 30, 2008, due primarily to fair value decreases of $4.6 billion comprising an increase of $3.3
billion of unrealized net capital losses and $1.3 billion of net realized capital losses recognized in the
quarter, and asset sales to support net liability decreases of $4.5 billion comprising $3.3 billion of
retirements and maturities of Allstate Financial institutional markets deposits and $1.2 billion in lower
funds associated with collateral received in conjunction with securities lending transactions.
The increase in unrealized net capital losses during the third quarter of 2008 of $3.3 billion was primarily
·
related to widening credit spreads and equity market declines. The total increase in unrealized net capital
losses included unfavorable changes related to municipal bonds ($848 million), corporate bonds ($1.3
billion), commercial mortgagebacked securities ($375 million), assetbacked securities ($225 million)
and equity securities ($391 million). The increase attributable to commercial mortgagebacked and asset
backed securities was also attributable to price declines due to market and liquidity disruptions. Net
unrealized capital losses increased despite the realization of capital losses on sales and impairments,
including change in intent writedowns, during the quarter. Consolidated net unrealized capital gains and
losses are presented in the following table.
September 30, June 30, December 31,
($ in millions) 2008 2008 2007
U.S. government and agencies $ 748 $ 854 $ 918
Municipal (816) 32 720
Corporate (1,846) (530) 90
Foreign government 323 354 394
Mortgagebacked securities (227) (183) (43)
Commercial mortgagebacked securities (763) (388) (308)
Assetbacked securities (1,576) (1,351) (816)
Redeemable preferred stock (4) (2) 1
Fixed income securities (4,161) (1,214) 956
Equity securities 76 467 990
Derivatives (14) (42) (33)
$ (4,099) $ (789) $ 1,913
Net unrealized capital gains and losses
Unrealized net capital losses on fixed income securities were $4.2 billion as of September 30, 2008, and
·
comprised $1.9 billion of gross unrealized gains and $6.1 billion of gross unrealized losses. Included in
gross unrealized losses were $2.5 billion of securities with a fair value below 70% of amortized cost, or
3.3% of our fixed income portfolio at September 30, 2008. The percentage of fair value to amortized cost
for the remaining gross unrealized losses on fixed income securities at September 30, 2008 are shown in
the following table.
% of Total
Unrealized Fair Fixed Income
($ in millions) (Loss) Gain Value Securities
> 80% of amortized cost $ (3,131) $ 42,354 55.7%
70% to 80% of amortized cost (933) 2,896 3.8
< 70% of amortized cost (1,984) 2,519 3.3
Gross unrealized losses on fixed income
securities (6,048) 47,769 62.8
Gross unrealized gains on fixed income
securities 1,887 28,239 37.2
Net unrealized gains and losses on fixed
(1)
$ (4,161) $ 76,008 100.0%
income securities
(1)
See the SFAS 157 Level 3 section of this document for further details of net unrealized losses on Level 3 investments
totaling $2.4 billion as of September 30, 2008.
________________________
8
9. Included in the fixed income securities with a fair value less than 70% of amortized cost were unrealized
losses for other collateralized debt obligations (“other CDO”) of $569 million (which primarily includes
$270 million of cash flow collateralized loan obligations (“cash flow CLO”) and $99 million of synthetic
collateralized debt obligations (“synthetic CDO”)), assetbacked residential mortgagebacked securities
(“ABS RMBS”) of $538 million, corporate bonds of $480 million, and commercial mortgagebacked
securities (“CMBS”) of $305 million. For additional information on ABS RMBS, CMBS, and other
CDO, see the Securities Experiencing Illiquid and Disrupted Markets section of this document. We
continue to believe that the unrealized losses on these securities are not necessarily predictive of the
ultimate performance. The unrealized losses should reverse over the remaining lives of the securities in
the absence of further deterioration in the collateral relative to our positions in the securities’ respective
capital structures.
For our illiquid investment portfolios, par value totaled $8.6 billion and amortized cost totaled $7.2
·
billion or 84% of par value at September 30, 2008, which is primarily the result of writedowns of
approximately $1.4 billion. Fair value of these investments totaled $5.5 billion or 64% of par value. See
additional details and discussion in the Securities Experiencing Illiquid and Disrupted Markets section of
this document. Our illiquid portfolios include prime residential mortgagebacked securities (“Prime”),
AltA residential mortgagebacked securities (“AltA”), commercial real estate collateralized debt
obligations (“CRE CDO”), and certain assetbacked securities including ABS RMBS, assetbacked
collateralized debt obligations (“ABS CDO”) and other CDO. In addition, for commercial mortgage
backed securities excluding CRE CDO, par value totaled $6.0 billion and amortized cost totaled $5.9
billion or 98% of par value, which was primarily the result of writedowns. Fair value totaled $5.1 billion
or 85% of par value.
Consolidated unrealized net capital losses aftertax and after adjustments for deferred policy acquisition
·
costs, deferred sales inducements and insurance reserves, as of September 30, 2008, were $1.5 billion and
were comprised of $640 million related to PropertyLiability, $820 million related to Allstate Financial
and $15 million related to Corporate and Other.
Statutory accounting principles (“statutory”) for the recognition of writedowns resulting from changes in
·
intent differ from those under GAAP. For statutory, declines in fair value below amortized cost resulting
from changes in riskfree interest rates and general credit spread widening, are deemed otherthan
temporary when the investor has the intent to sell the security at the financial reporting date. GAAP
requires writedowns when the investor cannot assert a positive intent to hold a security to recovery, even
if a decision to sell a security has not been made. At September 30, 2008, there are $186 million of after
tax unrealized losses, comprising $46 million for PropertyLiability investments and $140 million for
Allstate Financial investments, which have not been recognized in the statutory financial statements,
related to securities which are subject to change in intent writedowns for GAAP since no intent to sell
currently exists.
9
10. THE ALLSTATE CORPORATION
CONSOLIDATED AND SEGMENT HIGHLIGHTS
Three Months Ended Nine Months Ended
September 30, September 30,
($ in millions, except per share amounts, Est. Percent Est. Percent
return data and ratios) 2008 2007 Change Change 2008 2007 Change Change
Consolidated Highlights
Revenues $ 7,320 $ 8,992 $ (1,672) (18.6) $ 22,825 $ 27,778 $ (4,953) (17.8)
Net (loss) income (923) 978 (1,901) (194.4) (550) 3,876 (4,426) (114.2)
Operating (loss) income (190) 893 (1,083) (121.3) 1,240 3,162 (1,922) (60.8)
(Loss) income per diluted share (1)
Net (1.71) 1.70 (3.41) NM (1.00) 6.41 (7.41) (115.6)
Operating (0.35) 1.54 (1.89) (122.7) 2.26 5.23 (2.97) (56.8)
Weighted average shares outstanding (diluted) (1) 540.1 585.1 (45.0) (7.7) 549.5 605.1 (55.6) (9.2)
Net shares outstanding 536.1 573.6 (37.5) (6.5)
Return on equity
Net income 1.1 23.2 (22.1) pts. NM
Operating income 10.0 21.2 (11.2) pts. NM
Book value per diluted share 31.44 37.45 (6.01) (16.0)
Book value per diluted share, excluding the
impact of unrealized net capital gains and
losses on fixed income securities 34.25 36.71 (2.46) (6.7)
PropertyLiability Highlights
PropertyLiability premiums written $ 6,966 $ 7,075 $ (109) (1.5) $ 20,283 $ 20,623 $ (340) (1.6)
PropertyLiability revenues 6,537 7,543 (1,006) (13.3) 20,520 23,060 (2,540) (11.0)
Net (loss) income (661) 935 (1,596) (170.7) 281 3,514 (3,233) (92.0)
Underwriting (loss) income (865) 617 (1,482) NM (79) 2,508 (2,587) (103.1)
Net investment income 386 474 (88) (18.6) 1,287 1,482 (195) (13.2)
Operating (loss) income (248) 772 (1,020) (132.1) 973 2,781 (1,808) (65.0)
Catastrophe losses 1,816 343 1,473 NM 3,082 937 2,145 NM
Ratios:
Allstate Protection loss ratio 87.9 65.1 22.8 pts. NM 75.9 63.2 12.7 pts. NM
Allstate Protection expense ratio 24.7 24.8 (0.1) pts. NM 24.4 24.4 pts. NM
Allstate Protection combined ratio 112.6 89.9 22.7 pts. NM 100.3 87.6 12.7 pts. NM
Effect of Discontinued Lines and Coverages on
combined ratio 0.1 1.1 (1.0) pts. NM 0.1 0.1 pts. NM
PropertyLiability combined ratio 112.7 91.0 21.7 pts. NM 100.4 87.7 12.7 pts. NM
Effect of catastrophe losses on combined ratio 26.8 5.0 21.8 pts. NM 15.2 4.6 10.6 pts. NM
PropertyLiability combined ratio excluding
effect of catastrophes 85.9 86.0 (0.1) pts. NM 85.2 83.1 2.1 pts. NM
Effect of prior year reserve reestimates on
combined ratio 0.8 (0.8) pts. NM 0.6 (1.1) 1.7 pts. NM
Effect of catastrophe losses included in prior
year reserve reestimates on combined ratio (0.8) 0.8 pts. NM (0.6) (0.5) (0.1) pts. NM
PropertyLiability combined ratio excluding
effect of catastrophes and prior year
reserve reestimates 85.9 86.0 (0.1) pts. NM 85.2 84.7 0.5 pts. NM
Allstate Financial Highlights
Premiums and deposits $ 1,896 $ 2,302 $ (406) (17.6) $ 9,395 $ 7,817 $ 1,578 20.2
Allstate Financial revenues 806 1,408 (602) (42.8) 2,290 4,598 (2,308) (50.2)
Realized capital gains and losses (pretax) (599) (127) (472) NM (1,996) (1,996) NM
Net (loss) income (196) 70 (266) NM (686) 434 (1,120) NM
Operating income 88 147 (59) (40.1) 349 457 (108) (23.6)
Net income analysis
Benefit spread 97 129 (32) (24.8) 335 361 (26) (7.2)
Investment spread 214 266 (52) (19.5) 709 794 (85) (10.7)
Investment Highlights
Net investment income $ 1,355 $ 1,603 $ (248) (15.5) $ 4,293 $ 4,808 $ (515) (10.7)
Realized capital gains and losses (pretax) (1,288) 121 (1,409) NM (3,158) 1,137 (4,295) NM
Total investments 104,983 121,129 (16,146) (13.3)
(1) As prescribed by accounting principles generally accepted in the United States of America (quot;GAAPquot;), the three months and nine months ended September 30, 2008 earnings per share amounts were computed
discretely and the antidilutive effects of potential common shares outstanding totaling 2.6 million and 2.9 million, respectively, were excluded from weighted average shares diluted due to the third quarter and
year to date 2008 net loss. Accordingly, the sum of the per share amounts for the three quarters of 2008 does not equal the year to date per share amount.
10
11. THE ALLSTATE CORPORATION
CONSOLIDATED STATEMENTS OF OPERATIONS
Three Months Ended Nine Months Ended
September 30, September 30,
Est. Percent Est. Percent
($ in millions, except per share data) 2008 2007 Change 2008 2007 Change
Revenues
Propertyliability insurance premiums $ 6,785 $ 6,819 (0.5) $ 20,299 $ 20,447 (0.7)
Life and annuity premiums
and contract charges 468 449 4.2 1,391 1,386 0.4
Net investment income 1,355 1,603 (15.5) 4,293 4,808 (10.7)
Realized capital gains and losses (1,288) 121 NM (3,158) 1,137 NM
Total revenues 7,320 8,992 (18.6) 22,825 27,778 (17.8)
Costs and expenses
Propertyliability insurance
claims and claims expense 5,971 4,509 32.4 15,423 12,943 19.2
Life and annuity contract benefits 418 371 12.7 1,210 1,185 2.1
Interest credited to contractholder funds 586 685 (14.5) 1,773 2,007 (11.7)
Amortization of deferred policy
acquisition costs 980 1,170 (16.2) 3,014 3,539 (14.8)
Operating costs and expenses 814 785 3.7 2,334 2,246 3.9
Restructuring and related charges 10 2 NM 4 5 (20.0)
Interest expense 88 90 (2.2) 264 245 7.8
Total costs and expenses 8,867 7,612 16.5 24,022 22,170 8.4
Gain (loss) on disposition of operations 3 6 (50.0) (6) 8 (175.0)
(Loss) income from operations before income
tax (benefit) expense (1,544) 1,386 NM (1,203) 5,616 (121.4)
Income tax (benefit) expense (621) 408 NM (653) 1,740 (137.5)
Net (loss) income $ (923) $ 978 (194.4) $ (550) $ 3,876 (114.2)
Net (loss) income per share Basic $ (1.71) $ 1.70 $ (1.00) $ 6.45
Weighted average shares Basic 540.1 581.1 549.5 600.5
Net (loss) income per share Diluted (1) $ (1.71) $ 1.70 $ (1.00) $ 6.41
Weighted average shares Diluted (1) 540.1 585.1 549.5 605.1
Cash dividends declared per share $ 0.41 $ 0.38 $ 1.23 $ 1.14
(1) As prescribed by GAAP, the three months and nine months ended September 30, 2008 earnings per share amounts were computed discretely and the
antidilutive effects of potential common shares outstanding totaling 2.6 million and 2.9 million, respectively, were excluded from weighted average shares
diluted due to the third quarter and year to date 2008 net loss. Accordingly, the sum of the per share amounts for the three quarters of 2008 does not equal
the year to date per share amount.
11
12. THE ALLSTATE CORPORATION
CONTRIBUTION TO INCOME
Three Months Ended Nine Months Ended
September 30, September 30,
Est. Percent Est. Percent
($ in millions, except per share data) 2008 2007 Change 2008 2007 Change
Contribution to income
Operating (loss) income before the impact of
restructuring and related charges $ (183) $ 894 (120.5) $ 1,243 $ 3,165 (60.7)
Restructuring and related charges,
aftertax 7 1 NM 3 3
Operating (loss) income (190) 893 (121.3) 1,240 3,162 (60.8)
Realized capital gains and losses, aftertax (838) 80 NM (2,051) 737 NM
DAC and DSI amortization relating to realized capital
gains and losses, aftertax 110 11 NM 283 (4) NM
Reclassification of periodic settlements
and accruals on nonhedge derivative
instruments, aftertax (7) (8) 12.5 (18) (23) 21.7
Gain (loss) on disposition of operations, aftertax 2 2 (4) 4 NM
Net (loss) income $ (923) $ 978 (194.4) $ (550) $ 3,876 (114.2)
Income per share Diluted (1)
Operating (loss) income before the impact of
restructuring and related charges $ (0.34) $ 1.54 (122.1) $ 2.26 $ 5.23 (56.8)
Restructuring and related charges,
aftertax 0.01
Operating (loss) income (0.35) 1.54 (122.7) 2.26 5.23 (56.8)
Realized capital gains and losses, aftertax (1.55) 0.15 NM (3.73) 1.22 NM
DAC and DSI amortization relating to realized capital
gains and losses, aftertax 0.20 0.01 NM 0.51 (0.01) NM
Reclassification of periodic settlements
and accruals on nonhedge derivative
instruments, aftertax (0.01) (0.01) (0.03) (0.04) 25.0
Gain (loss) on disposition of operations, aftertax 0.01 (100.0) (0.01) 0.01
Net (loss) income $ (1.71) $ 1.70 NM $ (1.00) $ 6.41 (115.6)
(1) As prescribed by GAAP, the three months and nine months ended September 30, 2008 earnings per share amounts were computed discretely and the
antidilutive effects of potential common shares outstanding totaling 2.6 million and 2.9 million, respectively, were excluded from weighted average shares diluted
due to the third quarter and year to date 2008 net loss. Accordingly, the sum of the per share amounts for the three quarters of 2008 does not equal the year to
date per share amount.
12
13. THE ALLSTATE CORPORATION
SEGMENT RESULTS
Three Months Ended Nine Months Ended
September 30, September 30,
($ in millions, except ratios) Est. Est.
2008 2007 2008 2007
PropertyLiability
Premiums written (1) $ 6,966 $ 7,075 $ 20,283 $ 20,623
Premiums earned $ 6,785 $ 6,819 $ 20,299 $ 20,447
Claims and claims expense 5,971 4,509 15,423 12,943
Amortization of deferred policy acquisition costs 991 1,025 3,002 3,081
Operating costs and expenses 678 667 1,949 1,910
Restructuring and related charges 10 1 4 5
Underwriting (loss) income (865) 617 (79) 2,508
Net investment income 386 474 1,287 1,482
Periodic settlements and accruals on nonhedge derivative instruments 1 2
Income tax (benefit) expense on operations (230) 319 237 1,209
Operating (loss) income (248) 772 973 2,781
Realized capital gains and losses, aftertax (412) 163 (690) 733
Reclassification of periodic settlements and accruals on nonhedge
derivative instruments, aftertax (1) (2)
Net (loss) income $ (661) $ 935 $ 281 $ 3,514
Catastrophe losses $ 1,816 $ 343 $ 3,082 $ 937
Operating ratios:
Claims and claims expense ratio 88.0 66.1 76.0 63.3
Expense ratio 24.7 24.9 24.4 24.4
Combined ratio 112.7 91.0 100.4 87.7
Effect of catastrophe losses on combined ratio 26.8 5.0 15.2 4.6
Effect of prior year reserve reestimates on combined ratio 0.8 0.6 (1.1)
Effect of catastrophe losses included in prior year reserve reestimate on combined ratio (0.8) (0.6) (0.5)
Effect of Discontinued Lines and Coverages on combined ratio 0.1 1.1 0.1 0.1
Allstate Financial
Premiums and deposits $ 1,896 $ 2,302 $ 9,395 $ 7,817
Investments $ 66,547 $ 76,314 $ 66,547 $ 76,314
Premiums and contract charges $ 468 $ 449 $ 1,391 $ 1,386
Net investment income 937 1,086 2,895 3,212
Periodic settlements and accruals on nonhedge derivative instruments 9 12 25 36
Contract benefits 418 371 1,210 1,185
Interest credited to contractholder funds 604 687 1,833 2,006
Amortization of deferred policy acquisition costs 140 160 387 453
Operating costs and expenses 134 113 377 313
Restructuring and related charges 1
Income tax expense on operations 30 68 155 220
Operating income 88 147 349 457
Realized capital gains and losses, aftertax (390) (82) (1,298)
DAC and DSI amortization relating to realized capital gains and losses, aftertax 110 11 283 (4)
Reclassification of periodic settlements and accruals on nonhedge
derivative instruments, aftertax (6) (8) (16) (23)
Gain (loss) on disposition of operations, aftertax 2 2 (4) 4
Net (loss) income $ (196) $ 70 $ (686) $ 434
Corporate and Other
Net investment income $ 32 $ 43 $ 111 $ 114
Operating costs and expenses 90 95 272 268
Income tax benefit on operations (28) (26) (79) (78)
Operating loss (30) (26) (82) (76)
Realized capital gains and losses, aftertax (36) (1) (63) 4
Net loss $ (66) $ (27) $ (145) $ (72)
Consolidated net (loss) income $ (923) $ 978 $ (550) $ 3,876
(1) The cost of the catastrophe reinsurance program was $164 million and $227 million in the three months ended September 30, 2008 and 2007, respectively,
and $613 million and $674 million in the nine months ended September 30, 2008 and 2007, respectively.
13
14. THE ALLSTATE CORPORATION
UNDERWRITING RESULTS BY AREA OF BUSINESS
Three Months Ended Nine Months Ended
September 30, September 30,
Est. Percent Est. Percent
($ in millions, except ratios) 2008 2007 Change 2008 2007 Change
PropertyLiability Underwriting Summary
Allstate Protection $ (857) $ 688 NM $ (61) $ 2,544 (102.4)
Discontinued Lines and Coverages (8) (71) 88.7 (18) (36) 50.0
Underwriting (loss) income $ (865) $ 617 NM $ (79) $ 2,508 (103.1)
Allstate Protection Underwriting Summary
Premiums written $ 6,966 $ 7,075 (1.5) $ 20,283 $ 20,623 (1.6)
Premiums earned $ 6,785 $ 6,819 (0.5) $ 20,299 $ 20,447 (0.7)
Claims and claims expense 5,965 4,439 34.4 15,410 12,912 19.3
Amortization of deferred policy acquisition costs 991 1,025 (3.3) 3,002 3,081 (2.6)
Operating costs and expenses 676 666 1.5 1,944 1,905 2.0
Restructuring and related charges 10 1 NM 4 5 (20.0)
Underwriting (loss) income $ (857) $ 688 NM $ (61) $ 2,544 (102.4)
Catastrophe losses $ 1,816 $ 343 NM $ 3,082 $ 937 NM
Operating ratios:
Claims and claims expense ratio 87.9 65.1 75.9 63.2
Expense ratio 24.7 24.8 24.4 24.4
Combined ratio 112.6 89.9 100.3 87.6
Effect of catastrophe losses
on combined ratio 26.8 5.0 15.2 4.6
Effect of restructuring and related
charges on combined ratio 0.1
Discontinued Lines and Coverages
Underwriting Summary
Premiums written $ $ $ $
Premiums earned $ $ $ $
Claims and claims expense 6 70 (91.4) 13 31 (58.1)
Operating costs and expenses 2 1 100.0 5 5
Underwriting loss $ (8) $ (71) 88.7 $ (18) $ (36) 50.0
Effect of Discontinued Lines and Coverages
on the PropertyLiability combined ratio 0.1 1.1 0.1 0.1
14
15. THE ALLSTATE CORPORATION
PROPERTYLIABILITY PREMIUMS WRITTEN BY MARKET SEGMENT
Three Months Ended Nine Months Ended
September 30, September 30,
Est. Percent Est. Percent
($ in millions) 2008 2007 Change 2008 2007 Change
Allstate brand
Standard auto $ 4,050 $ 4,079 (0.7) $ 12,084 $ 12,086
Nonstandard auto 257 293 (12.3) 792 914 (13.3)
Involuntary auto 13 18 (27.8) 46 62 (25.8)
Commercial lines 153 175 (12.6) 493 568 (13.2)
Homeowners 1,576 1,590 (0.9) 4,292 4,346 (1.2)
Other personal lines (1) 488 432 13.0 1,282 1,219 5.2
6,537 6,587 (0.8) 18,989 19,195 (1.1)
Encompass brand
Standard auto 264 296 (10.8) 806 859 (6.2)
Nonstandard auto 8 15 (46.7) 31 54 (42.6)
Involuntary auto 4 3 33.3 10 14 (28.6)
Homeowners 126 145 (13.1) 368 415 (11.3)
Other personal lines 27 29 (6.9) 79 86 (8.1)
429 488 (12.1) 1,294 1,428 (9.4)
Allstate Protection 6,966 7,075 (1.5) 20,283 20,623 (1.6)
Discontinued Lines and Coverages
PropertyLiability $ 6,966 $ 7,075 (1.5) $ 20,283 $ 20,623 (1.6)
Allstate Protection
Standard auto $ 4,314 $ 4,375 (1.4) $ 12,890 $ 12,945 (0.4)
Nonstandard auto 265 308 (14.0) 823 968 (15.0)
Involuntary auto 17 21 (19.0) 56 76 (26.3)
Commercial lines 153 175 (12.6) 493 568 (13.2)
Homeowners 1,702 1,735 (1.9) 4,660 4,761 (2.1)
Other personal lines 515 461 11.7 1,361 1,305 4.3
$ 6,966 $ 7,075 (1.5) $ 20,283 $ 20,623 (1.6)
(1) The three months and nine months ended September 30, 2008 include $52 million of premiums written related to the acquisition of
Partnership Marketing Group.
15
16. THE ALLSTATE CORPORATION
PROPERTYLIABILITY
ANNUAL IMPACT OF NET RATE CHANGES APPROVED ON PREMIUMS WRITTEN (1)
Three Months Ended
September 30, 2008 (Est.)
Number of
Countrywide (%) (2) State Specific (%) (3)
States
Allstate brand
Standard auto 12 0.6 3.8
Nonstandard auto 2 0.6
Homeowners (5) (6) 17 (3.1) (11.5)
Encompass brand
Standard auto 14 1.3 11.0
Nonstandard auto 3 4.0 20.7
Homeowners 12 0.5 2.3
Nine Months Ended
September 30, 2008 (Est.)
Number of
Countrywide (%) (2) State Specific (%) (3)
States
Allstate brand
Standard auto (4) 30 1.1 1.9
Nonstandard auto (6) 9 0.1 0.5
Homeowners (5) (6) 33 (1.1) (1.9)
Encompass brand
Standard auto 32 2.4 4.6
Nonstandard auto 3 4.0 20.7
Homeowners (6) 25 1.8 4.0
(1) Rate increases that are indicated based on a loss trend analysis to achieve a targeted return will continue to be
pursued in all locations and for all products. Rate changes include changes approved based on our net cost of
reinsurance. These rate changes do not reflect initial rates filed for insurance subsidiaries initially writing
business. Based on historical premiums written in those states, rate changes approved for the three month
and nine month periods ending September 30, 2008, are estimated to total $(78) million and $135 million,
respectively.
(2) Represents the impact in the states where rate changes were approved during 2008 as a percentage of total
countrywide prior yearend premiums written.
(3) Represents the impact in the states where rate changes were approved during 2008 as a percentage of total
prior yearend premiums written in those states.
(4) Excluding the impact of a 15.9% rate reduction in California related to an order effective in April 2008, the
Allstate brand standard auto rate change is 6.1% on a state specific basis and 2.8% on a countrywide basis for
the nine months ended September 30, 2008. We estimate that this rate decrease will have an impact of $68
million on premiums written and $55 million on underwriting income during the remainder of 2008.
(5) Excluding the impact of a 28.5% rate reduction in California related to a resolution reached in the third quarter
of 2008, the Allstate brand homeowners rate change is 3.9% on a state specific basis and 0.6% on a
countrywide basis for the three months ended September 30, 2008. Excluding the impact of a 3.0% rate
reduction in Texas related to a resolution reached in the second quarter of 2008 and a 28.5% rate reduction in
California related to a resolution reached in the third quarter of 2008, the Allstate brand homeowners rate
change is 5.9% on a state specific basis and 2.9% on a countrywide basis for the nine months ended
September 30, 2008. We estimate that these rate decreases will have an impact of $58 million on premiums
written and $13 million on underwriting income during the remainder of 2008.
(6) Includes Washington, D.C.
16
17. THE ALLSTATE CORPORATION
ALLSTATE PROTECTION MARKET SEGMENT ANALYSIS
Three Months Ended September 30,
($ in millions, except ratios) Est. 2008 2007 Est. 2008 2007 Est. 2008 2007 Est. 2008 2007
Effect of
Catastrophe Losses
Loss Ratio (2)
Premiums Earned on the Loss Ratio Expense Ratio
Allstate brand
Standard auto $ 3,993 $ 4,004 66.7 65.8 1.9 0.5 24.3 24.4
Nonstandard auto 261 304 57.1 54.3 1.5 24.1 23.7
Homeowners 1,453 1,429 158.1 68.4 106.2 19.8 23.2 24.7
Other (1) 643 612 77.0 63.1 17.1 4.1 28.3 25.3
Total Allstate brand 6,350 6,349 88.2 65.6 27.3 5.2 24.5 24.5
Encompass brand
Standard auto 272 283 71.0 61.5 1.1 0.4 27.2 27.9
Nonstandard auto 9 18 77.8 66.7 33.3 33.3
Homeowners 124 137 113.7 55.5 62.9 9.5 30.7 30.6
Other (1) 30 32 66.6 37.5 6.7 26.7 28.1
Total Encompass brand 435 470 83.0 58.3 19.1 3.0 28.3 28.9
Allstate Protection $ 6,785 $ 6,819 87.9 65.1 26.8 5.0 24.7 24.8
Nine Months Ended September 30,
($ in millions, except ratios) Est. 2008 2007 Est. 2008 2007 Est. 2008 2007 Est. 2008 2007
Effect of
Catastrophe Losses
Loss Ratio (2)
Premiums Earned on the Loss Ratio Expense Ratio
Allstate brand
Standard auto $ 12,018 $ 11,941 66.4 64.3 1.8 0.7 24.0 24.0
Nonstandard auto 809 942 60.8 58.0 1.1 0.2 23.5 23.0
Homeowners 4,299 4,304 108.6 63.7 58.3 16.6 23.0 24.3
Other (1) 1,828 1,829 70.1 60.2 11.2 4.8 27.7 25.5
Total Allstate brand 18,954 19,016 76.1 63.5 15.5 4.7 24.1 24.1
Encompass brand
Standard auto 830 850 62.5 61.2 1.1 0.5 27.1 27.0
Nonstandard auto 35 60 77.2 75.0 31.4 26.7
Homeowners 386 418 83.4 53.4 34.5 10.3 31.1 29.9
Other (1) 94 103 123.4 51.5 6.4 2.9 27.7 26.2
Total Encompass brand 1,345 1,431 73.2 58.8 11.0 3.5 28.4 27.8
Allstate Protection $ 20,299 $ 20,447 75.9 63.2 15.2 4.6 24.4 24.4
(1) Other includes commercial lines, condominium, renters, involuntary auto and other personal lines.
(2) Loss Ratio comparisons are impacted by the relative level of prior year reserve reestimates. Please refer to the quot;Effect of Pretax Prior Year Reserve
Reestimates on the Combined Ratioquot; table for detailed reserve reestimate information.
17
18. THE ALLSTATE CORPORATION
PROPERTYLIABILITY
EFFECT OF PRETAX PRIOR YEAR RESERVE REESTIMATES ON THE COMBINED RATIO
Three Months Ended September 30,
Effect of Pretax Reserve
Pretax Reestimates on the
Reserve Reestimates (1) Combined Ratio
Est. Est.
($ in millions, except ratios) 2008 2007 2008 2007
Auto $ (27) $ (77) (0.4) (1.1)
Homeowners 20 49 0.3 0.7
Other 11 0.1
Allstate Protection (2) (7) (17) (0.1) (0.3)
Discontinued Lines and Coverages 7 69 0.1 1.1
PropertyLiability $ $ 52 0.8
Allstate brand $ (4) $ 8 (0.1) 0.1
Encompass brand (3) (25) (0.4)
Allstate Protection (2) $ (7) $ (17) (0.1) (0.3)
Nine Months Ended September 30,
Effect of Pretax Reserve
Pretax Reestimates on the
Reserve Reestimates (1) Combined Ratio
Est. Est.
($ in millions, except ratios) 2008 2007 2008 2007
Auto $ (94) $ (289) (0.5) (1.4)
Homeowners 116 71 0.6 0.4
Other 74 (33) 0.4 (0.2)
Allstate Protection (3) 96 (251) 0.5 (1.2)
Discontinued Lines and Coverages 14 31 0.1 0.1
PropertyLiability $ 110 $ (220) 0.6 (1.1)
Allstate brand $ 90 $ (184) 0.5 (0.9)
Encompass brand 6 (67) (0.3)
Allstate Protection (3) $ 96 $ (251) 0.5 (1.2)
(1) Favorable reserve reestimates are shown in parentheses.
(2) Favorable reserve reestimates included in catastrophe losses totaled $3 million in the three months ended
September 30, 2008 and unfavorable reserve reestimates included in catastrophe losses totaled $57 million in the
three months ended September 30, 2007.
(3) Unfavorable reserve reestimates included in catastrophe losses totaled $125 million and $101 million in the nine
months ended September 30, 2008 and 2007, respectively.
18
19. THE ALLSTATE CORPORATION
ALLSTATE FINANCIAL PREMIUMS AND DEPOSITS
Three Months Ended Nine Months Ended
September 30, September 30,
Est. Percent Est. Percent
($ in millions) 2008 2007 Change 2008 2007 Change
Life Products
Interestsensitive life $ 349 $ 352 (0.9) $ 1,069 $ 1,070 (0.1)
Traditional 100 98 2.0 288 280 2.9
Other 104 98 6.1 304 279 9.0
553 548 0.9 1,661 1,629 2.0
Annuities
Indexed annuities 138 152 (9.2) 422 464 (9.1)
Fixed deferred annuities 965 844 14.3 2,518 1,981 27.1
Subtotal 1,103 996 10.7 2,940 2,445 20.2
Fixed immediate annuities 99 100 (1.0) 251 353 (28.9)
1,202 1,096 9.7 3,191 2,798 14.0
Institutional Products
Funding agreements backing
mediumterm notes 500 (100.0) 4,158 3,000 38.6
Bank Deposits 141 158 (10.8) 385 390 (1.3)
Total $ 1,896 $ 2,302 (17.6) $ 9,395 $ 7,817 20.2
19