SlideShare a Scribd company logo
1 of 11
Download to read offline
Symantec's Fiscal 2008 Third Quarter Supplemental Information
                                                                                                  (Unaudited)


                         SUMMARY (1) (in thousands)
                                                                                                                                                       Y/Y      Q/Q
                                                                                                                                               (2)
                                                                                         Dec-07Q               Sep-07Q             Dec-06Q            Growth   Growth
                        Revenue and Earnings Results

                        Non-GAAP Revenue:                                               $1,529,026            $1,437,332            $1,326,341         15%       6%

                        GAAP Revenue:                                                   $1,515,251            $1,419,089            $1,315,873         15%       7%

                        Non-GAAP EPS:                                                     $0.33                 $0.29                 $0.26            27%      14%

                        GAAP EPS:                                                         $0.15                 $0.06                 $0.12            25%      150%

                                                                                                                                                       Y/Y      Q/Q         Total
                                                                 (3)                                                                           (2)
                        Revenue by Segment - Non-GAAP                                    Dec-07Q               Sep-07Q             Dec-06Q            Growth   Growth      Revenue

                        Security & Data Management:                                      $448,203              $423,210              $412,698          9%        6%          29%

                        Data Center Management:                                          $443,555              $402,347              $399,844          11%      10%          29%

                                   (4)
                        Altiris:                                                         $100,378              $91,929               $39,151          156%       9%          7%

                        Services:                                                        $96,189               $86,010               $68,517           40%      12%          6%

                                         Total Enterprise:                              $1,088,325            $1,003,496             $920,210          18%       8%          71%

                        Consumer:                                                        $440,206              $433,508              $406,145          8%        2%          29%

                        Other:                                                            $495                  $328                  ($14)            N/A      51%          0%

                                                                                                                                                       Y/Y      Q/Q         Total
                                                                                                                                               (2)
                                                                                         Dec-07Q               Sep-07Q             Dec-06Q            Growth   Growth      Revenue
                        Revenue by Geography - Non-GAAP

                        International:                                                   $811,760              $729,788              $669,153          21%      11%          53%

                        U.S.:                                                            $717,266              $707,544              $657,188          9%        1%          47%

                                         Americas (U.S., Latin America, Canada):         $789,075              $776,692              $727,323          8%        2%          51%

                                         EMEA:                                           $528,860              $465,676              $420,919          26%      14%          35%

                                         Asia Pacific & Japan:                           $211,091              $194,964              $178,099          19%       8%          14%


                                                                                                                                               (2)
                                                                                         Dec-07Q               Sep-07Q             Dec-06Q
                        Expenses and Profitability - Non-GAAP

                        Gross Margin:                                                     86.2%                 85.3%                 83.2%

                        Operating Expenses:                                              $898,708              $864,820              $762,661

                        Operating Expenses as a % of total revenue:                        59%                   60%                   58%

                        Operating Income:                                                $419,538              $361,548              $341,508

                        Operating Margin:                                                 27.4%                 25.2%                  26%

                        Net Income:                                                      $291,748              $262,636              $250,806

                        Fully Diluted Shares Outstanding:                                876,221               892,759               963,309

                                                                                                                                                       Y/Y      Q/Q
                                                                                                                                               (2)
                                                                                         Dec-07Q               Sep-07Q             Dec-06Q            Growth   Growth
                        Balance Sheet & Cash Flow Metrics

                        Cash position (including short-term investments):               $1,984,596            $2,015,842            $2,974,522          -         -

                        DSO:                                                             54 days               38 days               51 days            -         -

                        Non-GAAP Deferred Revenue:                                      $2,897,029            $2,624,485            $2,584,649         12%      10%

                        GAAP Deferred Revenue:                                          $2,877,173            $2,598,597            $2,559,201         12%      11%

                        Cash Flow from Operating Activities:                           $462 million          $331 million          $454 million        2%       40%

                        Capital Expenditures:                                          $71 million           $63 million          $ 113 million       -37%      12%

                        Stock Repurchase - number of shares purchased:              22.7 million shares   21.6 million shares   18.8 million shares


(1) The information presented above includes selected historical GAAP and non-GAAP financial information. To see the most directly comparable GAAP financial measures together with the reconciliation, go to:
http://investor.symantec.com/phoenix.zhtml?c=89422&p=irol-irhome

(2) We adopted Staff Accounting Bulletin No. 108, “Considering the Effects of Prior Year Misstatements when Quantifying Misstatements in Current Year Financial Statements,” or SAB 108, in fiscal year ended
March 2007, and our results for the three and nine months ended December 2006 include the adoption of SAB 108. See item 15, quot;Summary of Significant Accounting Policiesquot; in our March 2007 10-K for a
detailed explanation of the impact of our adoption of SAB 108.

(3) Following our ERP system implementation in the December 2006 quarter, we completed an analysis of the allocation of maintenance revenues across our enterprise segments. Accordingly, we have recast
maintenance revenues for these segments for each quarter of fiscal 2007. This recast primarily affected our Data Center Management and Security and Data Management segments. In addition, during the June
2007 quarter, we added a new business segment called Altiris consisting of the Altiris products and our Ghost, pcAnywhere, and LiveState Delivery products, which moved from the Security and Data
Management segment. We also moved our Managed Security Services and DeepSight products to the Services segment from the Security and Data Management segment. During the September 2007 quarter, we
recast certain amounts from the Services segment to the Security and Data Management segment.

(4) Altiris was acquired on April 6, 2007. As a result, the December 2007 and the September 2007 quarters include the Altiris products combined with the Ghost, pcAnywhere, and LiveState Delivery products,
and previous quarters exclude the Altiris products. See page 2 for Altiris standalone numbers.

                                                                                                                                                                                                           1
Symantec Big Deal Summary (1)                                                      Symantec Headcount
                           Greater than Greater than
                               $300k              $1m                                                     Employees
                                    554                 127                                                 17,906
Dec-07                                                                             Dec-07
                                    302                  64                                                 18,059
Sep-07                                                                             Sep-07
                                    249                  48                                                 17,705
Jun-07                                                                             Jun-07
                                    391                 101                                                 17,131
Mar-07                                                                             Mar-07
                                    409                 115                                                 17,396
Dec-06                                                                             Dec-06
                                    293                  67                                                 16,598
Sep-06                                                                             Sep-06
                                    299                  64                                                 16,161
Jun-06                                                                             Jun-06

(1) Includes Altiris products for all periods shown.


Altiris Standalone - Non-GAAP (2)                                                  Altiris Standalone - GAAP (2)
Quarterly Revenue for Altiris Standalone for Fiscal Year 2008:                     Quarterly Revenue for Altiris Standalone for Fiscal Year 2007:
     (Unaudited)                                                                       (Unaudited)
   (in thousands)        Altiris                                                      (in thousands)     Altiris
Jun-07               $       53,257                                                Jun-06              $ 57,404
Sep-07                       55,687                                                Sep-06                  55,620
Dec-07                       65,121                                                Dec-06                  55,969
                                                                                   Mar-07                  60,441
                           $     174,065                                                               $ 229,434
YTD FY-08                                                                          FY-07


(2) The historical Altiris standalone amounts are shown using Symantec’s fiscal periods. Symantec's fiscal years end March 31st whereas Altiris’
fiscal years ended December 31st.


                                                                                                                                              2
SYMANTEC CORPORATION
Reconciliation of GAAP Revenue Components to Non-GAAP Revenue Components

(In thousands)
(Unaudited)

                                                                        YTD FY 2008                             Three Months Ended Dec 31, 2007                    Three Months Ended Sep 30, 2007                  Three Months Ended Jun 30, 2007
                                                                        Non-GAAP                                       Non-GAAP                                            Non-GAAP                                          Non-GAAP
                                                                                   (1)                                                (1)                                                (1)                                                (1)
                                                                     Adjustments                                        Adjustments                                        Adjustments                                        Adjustments
                                                          GAAP                           Non-GAAP            GAAP                           Non-GAAP            GAAP                           Non-GAAP            GAAP                           Non-GAAP

                                                      $   4,334,678 $        54,524      $   4,389,202   $ 1,515,251 $           13,775     $   1,529,026   $   1,419,089 $        18,243      $   1,437,332   $ 1,400,338 $          22,506      $   1,422,844
Net Revenues

Revenue By Segment:
                                                      $   1,292,564 $         3,107      $   1,295,671   $    446,839 $          1,364      $     448,203   $    422,464 $            746      $     423,210   $    423,261 $            997      $    424,258
Security & Data Management
Data Center Management                                    1,237,996          12,284          1,250,280        440,416            3,139            443,555        398,355            3,992            402,347        399,225            5,153           404,378
                                                                                 -                                                  -                                                  -                                                  -
Consumer                                                  1,297,464                          1,297,464        440,206                             440,206        433,508                             433,508        423,750                            423,750
         (2)
Altiris                                                    242,245           39,133           281,378          91,106            9,272            100,378         78,424           13,505             91,929         72,715           16,356            89,071
                                                                                 -                                                  -                                                  -                                                  -
Services                                                   263,345                            263,345          96,189                              96,189         86,010                              86,010         81,146                             81,146
        (3)
Other                                                 $      1,064 $               -     $       1,064   $          495 $              -    $        495    $          328 $             -     $        328    $       241 $                -     $        241

Revenue by Geography:
               (4)
Americas                                              $   2,295,736 $        36,431      $   2,332,167   $    779,817 $          9,258      $     789,075   $    764,470 $         12,222      $     776,692   $    751,449 $         14,951      $    766,400
EMEA                                                      1,443,270          15,555          1,458,825        524,981            3,879            528,860        460,485            5,191            465,676        457,804            6,485           464,289
                                                      $     595,672 $         2,538      $     598,210   $    210,453 $            638      $     211,091   $    194,134 $            830      $     194,964   $    191,085 $          1,070      $    192,155
Asia Pacific/Japan

                                                      $   2,085,349 $        35,803      $   2,121,152   $    708,186 $           9,080     $     717,266   $    695,517 $         12,027      $     707,544   $    681,646 $         14,696      $    696,342
Total U.S. Revenue
                                                      $   2,249,329 $        18,721      $   2,268,050   $    807,065 $           4,695     $     811,760   $    723,572 $          6,216      $     729,788   $    718,692 $          7,810      $    726,502
Total International Revenue


                              (5)
                                                      $    134,933 $         39,132      $    174,065    $     55,850 $           9,271     $      65,121   $     42,182 $         13,505      $      55,687   $     36,901 $         16,356      $     53,257
Altiris Standalone Net Revenues


We include certain non-GAAP revenue and deferred revenue components in the tracking and forecasting of our revenue and management of our business. This includes non-GAAP revenue associated with deferred
revenue that was excluded as a result of purchase accounting adjustments related to acquisitions. We believe the non-GAAP revenue measures set forth above are useful to investors, and such items are used by our
management, because this revenue is reflective of our ongoing operating results.

(1) We have completed numerous business combinations and acquisitions for a variety of strategic purposes over the past several years. As is the case with our existing business, at the time of acquisition, acquired
business had recorded deferred revenue related to past transactions for which revenue would be recognized in future periods as revenue recognition criteria are satisfied. The purchase accounting entries for these
acquisitions require us to write down a portion of this deferred revenue to its then current fair value. Consequently, in post acquisition periods, we do not recognize the full amount of this deferred revenue. When
measuring the performance of our business, however, we add back non-GAAP revenue associated with certain types of deferred revenue that were excluded as a result of these purchase accounting adjustments, as we
believe that this provides information about the operating impact of the acquired businesses in a manner consistent with the revenue recognition for our for our pre-existing products and services. We believe that the
inclusion of this revenue provides useful information to our management as well as to investors.

(2) During the June 2007 quarter, we added a new business segment called Altiris consisting of the Altiris products and our Ghost, pcAnywhere, and LiveState Delivery products, which moved from the Security and
Data Management segment. We also moved our Managed Security Services and DeepSight products to the Services segment from the Security and Data Management segment. During the September 2007 quarter,
we recast certain amounts from the Services segment to the Security and Data Management segment.

(3) Other includes divested product lines and/or product lines nearing the end of their life cycle. See item 15, Footnote 15 in our March 2007 10-K.

(4) The Americas includes the United States, Latin America, and Canada.

(5) Excludes legacy Symantec products included in the Altiris segment. See note (2) above.


                                                                                                                                                                                                                                                            3
SYMANTEC CORPORATION
Reconciliation of GAAP Revenue Components to Non-GAAP Revenue Components

(In thousands)
(Unaudited)


                                                                         FY 2007 (1)                                                                              Three Months Ended Dec 31, 2006 (1)                   Three Months Ended Sep 30, 2006 (1)                   Three Months Ended Jun 30, 2006 (1)
                                                                                                               Three Months Ended Mar 31, 2007 (1)
                                                                         Non-GAAP                                      Non-GAAP                                             Non-GAAP                                              Non-GAAP                                              Non-GAAP
                                                                     Adjustments (2)                                    Adjustments (2)                                      Adjustments (2)                                       Adjustments (5)                                       Adjustments (2)
                                                          GAAP                           Non-GAAP            GAAP                          Non-GAAP               GAAP                             Non-GAAP             GAAP                           Non-GAAP               GAAP                           Non-GAAP

                                                      $ 5,199,366 $             53,298   $   5,252,664   $ 1,357,217 $            7,565    $   1,364,782      $ 1,315,873 $           10,468    $       1,326,341   $ 1,260,408 $           12,984     $      1,273,392   $ 1,265,868 $           22,281    $       1,288,149
Net Revenues

Revenue By Segment: (3)
Security & Data Management                            $ 1,621,190 $              9,455   $   1,630,645   $    410,869 $           1,234    $     412,103      $    411,140 $           1,558    $        412,698    $    394,892 $           2,232     $       397,124    $    404,289 $           4,431    $        408,720
Data Center Management                                  1,533,848               43,641       1,577,489        411,081             6,331          417,412           390,934             8,910             399,844         363,778            10,752             374,530         368,055            17,648             385,703
Consumer                                                1,590,505                   -        1,590,505        408,200                -           408,200           406,145                -              406,145         394,382                -              394,382         381,778                -              381,778
Altiris (3)                                                                        -                                                 -                                                    -                                                     -                                                     -
                                                           160,475                            160,475          40,562                                40,562         39,151                                39,151          40,933                                40,933          39,829                                39,829
                                                                                                                                     -                                                    -                                                     -
Services                                                   293,226                202         293,428          86,439                                86,439         68,517                                68,517          66,356                                66,356          71,914               202              72,116
Other (4)                                             $          122 $             -     $        122    $          66 $             -     $             66   $        (14) $             -    $             (14)   $          67 $             -      $            67    $          3$               -     $              3

Revenue by Geography:
Americas (5)                                          $ 2,840,450 $             35,496   $   2,875,946   $    729,747 $           4,711    $     734,458      $    720,492 $           6,831    $        727,323    $    696,367 $           9,071     $       705,438    $    693,844 $          14,883    $        708,727
EMEA                                                    1,644,295               13,245       1,657,540        442,394             2,340          444,734           417,931             2,988             420,919         386,422             3,166             389,588         397,548             4,751             402,299
                                                      $   714,621 $              4,557   $     719,178   $    185,076 $             514    $     185,590      $    177,450 $             649    $        178,099    $    177,619 $             747     $       178,366    $    174,476 $           2,647    $        177,123
Asia Pacific/Japan

                                                      $ 2,560,194 $             33,403   $   2,593,597   $    654,748 $           4,401    $     659,149      $    650,721 $           6,467    $        657,188    $    628,614 $           8,659     $       637,273    $    626,111 $          13,876    $        639,987
Total U.S. Revenue
                                                      $ 2,639,172 $             19,895   $   2,659,067   $    702,469 $           3,164    $     705,633      $    665,152 $           4,001    $        669,153    $    631,794 $           4,325     $       636,119    $    639,757 $           8,405    $        648,162
Total International Revenue


We include certain non-GAAP revenue and deferred revenue components in the tracking and forecasting of our revenue and management of our business. This includes non-GAAP revenue associated with deferred
revenue that was excluded as a result of purchase accounting adjustments related to acquisitions. We believe the non-GAAP revenue measures set forth above are useful to investors, and such items are used by our
management, because this revenue is reflective of our ongoing operating results.

(1) We adopted Staff Accounting Bulletin No. 108, “Considering the Effects of Prior Year Misstatements when Quantifying Misstatements in Current Year Financial Statements,” or SAB 108, in fiscal year ended
March 2007, and our results for the three and nine months ended December 2006 include the adoption of SAB 108. See item 15, quot;Summary of Significant Accounting Policiesquot; in our March 2007 10-K for a
detailed explanation of the impact of our adoption of SAB 108.

(2) We have completed numerous business combinations and acquisitions for a variety of strategic purposes over the past several years. As is the case with our existing business, at the time of acquisition, acquired
business had recorded deferred revenue related to past transactions for which revenue would be recognized in future periods as revenue recognition criteria are satisfied. The purchase accounting entries for these
acquisitions require us to write down a portion of this deferred revenue to its then current fair value. Consequently, in post acquisition periods, we do not recognize the full amount of this deferred revenue. When
measuring the performance of our business, however, we add back non-GAAP revenue associated with certain types of deferred revenue that were excluded as a result of these purchase accounting adjustments, as we
believe that this provides information about the operating impact of the acquired businesses in a manner consistent with the revenue recognition for our for our pre-existing products and services. We believe that the
inclusion of this revenue provides useful information to our management as well as to investors.

(3) Following our ERP system implementation in the December 2006 quarter, we completed an analysis of the allocation of maintenance revenues across our enterprise segments. Accordingly, we have recast
maintenance revenues for these segments for each quarter of fiscal 2007. This recast primarily affected our Data Center Management and Security and Data Management segments. In addition, during the June 2007
quarter, we added a new business segment called Altiris consisting of the Altiris products and our Ghost, pcAnywhere, and LiveState Delivery products, which moved from the Security and Data Management
segment. We also moved our Managed Security Services and DeepSight products to the Services segment from the Security and Data Management segment. During the September 2007 quarter, we recast certain
amounts from the Services segment to the Security and Data Management segment.

(4) Other includes divested product lines and/or product lines nearing the end of their life cycle. See item 15, Footnote 15 in our March 2007 10-K.

(5) The Americas includes the United States, Latin America, and Canada.


                                                                                                                                                                                                                                                                                                                          4
Symantec Corporation
 GAAP Statements of Operations
 (In thousands, except per share data)
 (Unaudited)
                                                                                                                                                                                                                      Fiscal (4)                 Quarter Ended (4)          Quarter Ended (4)        Quarter Ended (4)          Quarter Ended (4)
                                                                                          Fiscal YTD                   Quarter Ended                  Quarter Ended                 Quarter Ended
                                                                                             2008                        31-Dec-07                      30-Sep-07                     30-Jun-07                         2007                       31-Mar-07                   31-Dec-06                30-Sep-06                  30-Jun-06

Net revenues:
 Content, subscriptions, and maintenance                                           $               3,371,126       $              1,167,443       $             1,117,165       $             1,086,518       $              3,917,796       $            1,051,336    $               993,889       $          955,025         $         917,546
 Licenses                                                                                            963,552                        347,808                       301,924                       313,820                      1,281,570                      305,881                    321,984                  305,383                   348,322
    Total net revenues                                                                             4,334,678                      1,515,251                     1,419,089                     1,400,338                      5,199,366                    1,357,217                  1,315,873                1,260,408                 1,265,868
Cost of revenues:
 Content, subscriptions, and maintenance                                                             619,593                        204,355                       205,572                       209,666                        823,525                      210,888                    213,977                 203,524                    195,136
 Licenses                                                                                             31,434                         10,304                         9,892                        11,238                         49,968                       10,502                     12,015                  11,539                     15,912
 Amortization of acquired product rights                                                             262,924                         84,502                        89,062                        89,360                        342,333                       84,873                     84,511                  85,338                     87,611
    Total cost of revenues                                                                           913,951                        299,161                       304,526                       310,264                      1,215,826                      306,263                    310,503                 300,401                    298,659
Gross Profit                                                                                       3,420,727                      1,216,090                     1,114,563                     1,090,074                      3,983,540                    1,050,954                  1,005,370                 960,007                    967,209

Operating expenses:
 Sales and marketing                                                                               1,791,672                        627,980                       595,162                       568,530                      2,007,649                      575,544                   500,067                  464,589                    467,449
  Research and development (1)                                                                      671,928                         225,293                       221,057                       225,578                           866,884                   218,470                   216,969                  218,250                    213,195
  General and administrative                                                                        254,850                          82,600                        86,405                        85,845                           316,783                    79,266                    78,820                   80,076                     78,621
  Amortization of other purchased intangible assets                                                 168,847                          54,996                        56,926                        56,925                           201,502                    49,932                    50,476                   50,480                     50,614
  Restructuring                                                                                      51,883                          23,305                         9,578                        19,000                            70,236                    50,758                       -                      6,220                     13,258
  Integration                                                                                           -                               -                             -                             -                                 744                       744                       -                        -                          -
  Write-down of assets (2)                                                                            92,688                          6,142                        86,546                           -                              -                            -                         -                        -                          -
   Total operating expenses                                                                        3,031,868                      1,020,316                     1,055,674                       955,878                      3,463,798                      974,714                   846,332                  819,615                    823,137

Operating income (loss)                                                                             388,859                         195,774                        58,889                       134,196                           519,742                    76,240                   159,038                  140,392                    144,072
  Interest income                                                                                    59,997                          19,997                        19,179                        20,821                           122,041                    30,501                    28,741                   34,983                     27,816
  Interest expense                                                                                  (20,385)                         (7,477)                       (6,617)                       (6,291)                          (27,232)                   (6,245)                   (6,257)                  (8,052)                    (6,678)
  Other income (expense), net                                                                           883                          (2,348)                        1,965                         1,266                            17,069                     5,567                    (3,897)                  15,581                       (182)
Income (loss) before income taxes                                                                   429,354                         205,946                        73,416                       149,992                           631,620                   106,063                   177,625                  182,904                    165,028

 Provision for income taxes                                                                         151,890                          74,056                        23,048                         54,786                          227,239                    45,168                    60,855                   56,722                     64,494
Net income (loss)                                                                  $                277,464        $                131,890       $                50,368       $                 95,206      $                   404,381    $               60,895    $              116,770        $         126,182          $         100,534

Net income (loss) per share - diluted                                              $                    0.31       $                    0.15      $                   0.06      $                   0.10      $                      0.41    $                  0.07   $                  0.12       $             0.13         $             0.10

                                                                                                                                     876,221                       892,759
Shares used to compute net income (loss) per share - diluted                                        893,794                                                                                     910,302                           983,261                   932,985                   963,309                  987,916                  1,048,833


 Symantec Corporation
 Non-GAAP Statements of Operations (3)
 (In thousands, except per share data)
 (Unaudited)
                                                                                                                                                                                                                     Fiscal (4)                  Quarter Ended (4)         Quarter Ended (4)      Quarter Ended (4)          Quarter Ended (4)
                                                                                         Fiscal YTD                    Quarter Ended                  Quarter Ended                 Quarter Ended
                                                                                            2008                         31-Dec-07                      30-Sep-07                     30-Jun-07                        2007                        31-Mar-07                  31-Dec-06              30-Sep-06                  30-Jun-06

Net revenues                                                                       $              4,389,202       $              1,529,026       $              1,437,332      $              1,422,844      $              5,252,664        $           1,364,782     $            1,326,341    $          1,273,392       $          1,288,149
 Cost of revenues                                                                                   638,252                        210,780                        210,964                       216,508                       857,053                      217,936                    222,172                 209,879                    207,066
 Gross profit                                                                                     3,750,950                      1,318,246                      1,226,368                     1,206,336                     4,395,611                    1,146,846                  1,104,169               1,063,513                  1,081,083

Operating expenses:
  Sales and marketing                                                                             1,747,781                        613,857                       580,736                        553,188                     1,950,204                      563,459                   487,210                  446,947                   452,588
  Research and development                                                                          626,898                        209,579                       206,056                        211,263                       807,950                      206,148                   202,607                  200,963                   198,232
  General and administrative                                                                        230,211                         75,272                        78,028                         76,911                       291,767                       72,036                    72,844                   73,293                    73,594
    Total operating expenses                                                                      2,604,890                        898,708                       864,820                        841,362                     3,049,921                      841,643                   762,661                  721,203                   724,414

Operating income                                                                                  1,146,060                        419,538                       361,548                        364,974                     1,345,690                      305,203                   341,508                  342,310                   356,669
  Interest income                                                                                    59,997                         19,997                        19,179                         20,821                       122,041                       30,501                    28,741                   34,983                    27,816
  Interest expense                                                                                  (20,385)                        (7,477)                       (6,617)                        (6,291)                      (27,232)                      (6,245)                   (6,257)                  (8,052)                   (6,678)
  Other income (expense), net                                                                        (2,394)                        (5,626)                        1,966                          1,266                        (2,919)                       2,347                    (3,897)                  (1,187)                     (182)
Income before income taxes                                                                        1,183,278                        426,432                       376,076                        380,770                     1,437,580                      331,806                   360,095                  368,054                   377,625

  Provision for income taxes                                                                        366,196                        134,684                       113,440                        118,072                       445,102                      105,038                   109,289                  106,592                   124,183
Net income                                                                         $                817,082       $                291,748       $               262,636       $                262,698      $                992,478        $             226,768     $             250,806     $            261,462       $           253,442

Net income per share - diluted                                                     $                    0.91      $                    0.33      $                   0.29      $                   0.29      $                      1.01     $                 0.24    $                 0.26    $                0.26      $               0.24

                                                                                                                                    876,221
Shares used to compute net income per share - diluted                                               893,794                                                      892,759                        910,302                       983,261                      932,985                   963,309                  987,916                  1,048,833


The above information reflects the financial results of Symantec Corporation. Symantec acquired Altiris Inc. on April 6, 2007. The results of operations of Altiris have been included in the Symantec results of operations since that date.

(1) During the December 2007 quarter, we recorded a $1 million write-down to a research and development facility classified as held for sale.

(2) Write-down of assets. During the September 2007 quarter, management determined that certain tangible and intangible assets and liabilities of the Data Center Management segment did not meet the long term strategic objectives of the segment, and we recorded a write-down of $87 million to value these assets and liabilities at the respective estimated fair
value. We adjusted this amount to $93 million in the December 2007 quarter. On January 10, 2008 we signed an agreement to sell these assets.

3) The method we use to produce non-GAAP results is not computed according to GAAP and may differ from the methods used by other companies. Our non-GAAP results are not meant to be considered in isolation or as a substitute for comparable GAAP measures and should be read only in conjunction with our condensed consolidated financial
statements prepared in accordance with GAAP.

(4) We adopted Staff Accounting Bulletin No. 108, “Considering the Effects of Prior Year Misstatements when Quantifying Misstatements in Current Year Financial Statements,” or SAB 108, in fiscal year ended March 2007, and our results for the three and nine months ended December 2006 include the adoption of SAB 108. See item 15, quot;Summary of
Significant Accounting Policiesquot; in our March 2007 10-K for a detailed explanation of the impact of our adoption of SAB 108.


                                                                                                                                                                                                                                                                                                                                                                   5
Symantec Corporation
 Reconciliation of Non-GAAP Adjustments
  Statements of Operations
 (In thousands, except per share data)
 (Unaudited)
                                                                                                                                                                          Fiscal (10)             Quarter Ended (10)     Quarter Ended (10)    Quarter Ended (10)    Quarter Ended (10)
                                                                      Fiscal YTD               Quarter Ended            Quarter Ended            Quarter Ended
                                                                         2008                    31-Dec-07                30-Sep-07                30-Jun-07                2007                     31-Mar-07              31-Dec-06             30-Sep-06             30-Jun-06

NET REVENUES:
GAAP net revenues                                                 $         4,334,678      $           1,515,251    $           1,419,089    $           1,400,338    $          5,199,366        $        1,357,217     $        1,315,873    $        1,260,408    $        1,265,868
 Deferred revenue related to acquisitions(1)                                   54,524                     13,775                   18,243                   22,506                  53,298                     7,565                 10,468                12,984                22,281
Non-GAAP net revenues                                             $         4,389,202      $           1,529,026    $           1,437,332    $           1,422,844    $          5,252,664        $        1,364,782     $        1,326,341    $        1,273,392    $        1,288,149

GROSS PROFIT:
GAAP gross profit                                                 $         3,420,727      $           1,216,090    $           1,114,563    $           1,090,074    $          3,983,540        $        1,050,954     $        1,005,370    $         960,007     $         967,209
  Deferred revenue related to acquisitions(1)                                  54,524                    13,775                   18,243                   22,506                       53,298                 7,565                 10,468                12,984               22,281
                                            (2)
  Amortization of acquired product rights                                     262,925                    84,502                   89,063                   89,360                  342,335                    84,873                 84,512                85,339               87,611
                               (4)
 Stock-based compensation                                                      12,774                      3,879                    4,499                    4,396                  16,438                     3,454                  3,819                 5,183                 3,982
   Gross profit adjustment                                                    330,223                    102,156                  111,805                  116,262                 412,071                    95,892                 98,799               103,506               113,874
Non-GAAP gross profit                                             $         3,750,950      $           1,318,246    $           1,226,368    $           1,206,336    $          4,395,611        $        1,146,846     $        1,104,169    $        1,063,513    $        1,081,083

OPERATING EXPENSES:
GAAP operating expenses                                           $         3,031,868      $           1,020,316    $           1,055,674    $            955,878     $          3,463,798        $          974,714     $          846,332    $         819,615     $         823,137
  Executive incentive bonuses (3)                                              (3,540)                      (424)                  (1,314)                  (1,802)                     (3,951)                      3                 (897)               (1,083)               (1,974)
  Stock-based compensation (4)                                               (108,379)                   (35,541)                 (36,490)                 (36,348)               (137,443)                  (31,640)               (32,298)              (40,628)              (32,877)
  Restructuring (5)                                                           (51,883)                   (23,305)                  (9,578)                 (19,000)                 (70,236)                 (50,758)                   -                  (6,220)              (13,258)
  Integration (6)                                                                  (441)                       -                        -                    (441)                       (744)                  (744)                   -                     -                     -
                         (7)
  Write-down of assets                                                        (93,888)                    (7,342)                 (86,546)                       -                         -                     -                      -                     -                     -
                                           (2)
 Amortization of other intangible assets                                     (168,847)                   (54,996)                (56,926)                 (56,925)                (201,503)                  (49,932)               (50,476)             (50,481)              (50,614)
   Operating expense adjustment                                              (426,978)                  (121,608)               (190,854)                (114,516)                (413,877)                 (133,071)               (83,671)             (98,412)              (98,723)
Non-GAAP operating expenses                                       $         2,604,890      $             898,708    $            864,820     $            841,362     $          3,049,921        $          841,643     $          762,661    $         721,203     $         724,414

OPERATING INCOME:
GAAP operating income (loss)                                      $           388,859      $            195,774     $             58,889     $            134,196     $            519,742        $           76,240     $          159,038    $         140,392     $         144,072
 Gross profit adjustment                                                      330,223                   102,156                  111,805                  116,262                  412,071                    95,892                 98,799              103,506               113,874
 Operating expense adjustment                                                 426,978                   121,608                  190,854                  114,516                  413,877                   133,071                 83,671               98,412                98,723
Non-GAAP operating income                                         $         1,146,060      $            419,538     $            361,548     $            364,974     $          1,345,690        $          305,203     $          341,508    $         342,310     $         356,669

NET INCOME (LOSS):
GAAP net income (loss)                                            $           277,464      $            131,890     $             50,368     $             95,206     $            404,381        $           60,895     $          116,770    $         126,182     $         100,534
 Gross profit adjustment                                                      330,223                   102,156                  111,805                  116,262                  412,071                    95,892                 98,799              103,506               113,874
 Operating expense adjustment                                                 426,978                   121,608                  190,854                  114,516                  413,877                   133,071                 83,671               98,412                98,723
 Income tax effect on above items (8)                                        (214,306)                  (60,629)                 (90,391)                 (63,286)                (217,863)                  (59,870)               (48,434)             (49,870)              (59,689)
 Gain on sale of assets (9)                                                    (3,277)                   (3,277)                     -                        -                    (19,988)                   (3,220)                   -                (16,768)                  -
Non-GAAP net income                                               $           817,082      $            291,748     $            262,636     $            262,698     $            992,478        $          226,768     $          250,806    $         261,462     $         253,442

NET INCOME (LOSS) PER SHARE - DILUTED:
GAAP net income (loss) per share                                  $                0.31    $                0.15    $                0.06    $                0.10    $                   0.41    $             0.07     $             0.12    $             0.13    $             0.10
  Stock-based compensation adjustment per share, net of tax (4)                    0.11                     0.04                     0.04                     0.04                        0.12                  0.03                   0.03                  0.04                  0.03
                                                     (1-3, 5-6)
 Other non-GAAP adjustments per share, net of tax                                  0.49                     0.14                     0.19                     0.15                        0.48                  0.14                   0.11                  0.09                  0.11
Non-GAAP net income per share                                     $                0.91    $                0.33    $                0.29    $                0.29    $                   1.01    $             0.24     $             0.26    $             0.26    $             0.24

SHARES USED TO COMPUTE NET INCOME (LOSS) PER SHARE - DILUTED:
GAAP shares used to compute net income (loss) per share                       893,794                   876,221                  892,759                  910,302                  983,261                   932,985                963,309              987,916             1,048,833


(see notes on following page)


                                                                                                                                                                                                                                                                                           6
The information included in the Reconciliation of Non-GAAP Adjustments table reflects the financial results of Symantec Corporation. Symantec acquired Altiris Inc. on April 6, 2007. The results of operations of Altiris have been included in the Symantec results of operations since that date.

The method we use to produce non-GAAP results is not computed according to GAAP and may differ from the methods used by other companies. Our non-GAAP results are not meant to be considered in isolation or as a substitute for comparable GAAP measures and should be read only in
conjunction with our consolidated condensed financial statements prepared in accordance with GAAP.

The non-GAAP financial measures included in the tables above are non-GAAP net revenues, non-GAAP net income and non-GAAP net income per share, which adjust for the following items: business combination accounting entries, expenses related to acquisitions, stock-based compensation
expense, restructuring charges and charges related to the amortization of intangible assets, write-downs of intangible assets and certain other items. We believe the presentation of these non-GAAP financial measures, when taken together with the corresponding GAAP financial measures,
provides meaningful supplemental information regarding the Company's operating performance for the reasons discussed below. Our management uses these non-GAAP financial measures in assessing the Company's operating results, as well as when planning, forecasting and analyzing future
periods. We believe that these non-GAAP financial measures also facilitate comparisons of the Company's performance to prior periods and to our peers and that investors benefit from an understanding of these non-GAAP financial measures.

(1) Fair value adjustment to deferred revenue. We have completed numerous business combinations and acquisitions for a variety of strategic purposes over the past several years. As is the case with our existing business, at the time of acquisition, acquired businesses recorded deferred
revenue related to past transactions for which revenue would be recognized in future periods as revenue recognition criteria are satisfied. The purchase accounting entries for these acquisitions require us to write down a portion of this deferred revenue to its then current fair value.
Consequently, in post acquisition periods, we do not recognize the full amount of this deferred revenue. When measuring the performance of our business, however, we add back non-GAAP revenue associated with certain types of deferred revenue that were excluded as a result of these
purchase accounting adjustments, as we believe that this provides information about the operating impact of the acquired businesses in a manner consistent with the revenue recognition for our for our pre-existing products and services. We believe that the inclusion of this revenue provides
useful information to our management as well as to investors.

(2) Amortization of acquired product rights and other intangible assets. When conducting internal development of intangible assets, accounting rules require that we expense the costs as incurred. In the case of acquired businesses, however, we are required to allocate a portion of the purchase
price to the accounting value assigned to intangible assets acquired and amortize this amount over the estimated useful lives of the acquired intangibles. The acquired company, in most cases, has itself previously expensed the costs incurred to develop the acquired intangible assets, and the
purchase price allocated to these assets is not necessarily reflective of the cost we would incur in developing the intangible asset. We eliminate this amortization charge from our non-GAAP operating results to provide better comparability of pre and post-acquisition operating results and
comparability to results of businesses utilizing internally developed intangible assets.

 (3) Executive incentive bonuses. We have excluded bonuses related to acquisitions and executive sign-on bonuses for newly hired executives. We expect the benefit from these hires and retentions to extend over an indeterminate future period, but under GAAP we are required to expense the
entire cost of the bonus in the period paid. We exclude these amounts to provide better comparability of the periods that include and do not include these charges. We believe that investors benefit from an understanding of our operating results for the periods presented without giving effect to
these charges.

 (4) Stock-based compensation. Consists of expenses for employee stock options, restricted stock units, restricted stock awards and our employee stock purchase plan determined in accordance with Statement of Financial Accounting Standards Number 123(R), or SFAS 123(R). When
evaluating the performance of our individual business units and developing short and long term plans, we do not consider stock-based compensation charges. Our management team is held accountable for cash-based compensation, but we believe that management is limited in its ability to
project the impact of stock-based compensation, and accordingly, is not held accountable for its impact on our operating results. Although stock-based compensation is necessary to attract and retain quality employees, our consideration of stock based compensation places its primary emphasis
on overall shareholder dilution rather than the accounting charges associated with such grants. In addition, for comparability purposes, we believe it is useful to provide a non-GAAP financial measure that excludes stock-based compensation in order to better understand the long-term
performance of our core business and to facilitate the comparison of our results to the results of our peer companies. Furthermore, unlike cash compensation, the value of stock-based compensation is determined using a complex formula that incorporates factors, such as market volatility, that
are beyond our control. Further, we believe it is useful to investors to understand the impact of SFAS 123(R) to our results of operations. For the three months and nine months ended December 31, 2007 and December 31, 2006, stock-based compensation was allocated as follows:

                                                                  Three Months Ended                        Nine Months Ended
                                                                      December 31,                            December 31,
                                                               2007                                  2007
                                                                                     2006                                       2006
Cost of revenues                                           $       3,879        $        3,819   $      12,774          $          12,984
Sales and marketing                                              14,013                12,520          42,433                     43,771
Research and development                                         14,431                13,803          43,439                     44,847
General and administrative                                        7,097                 5,975          22,507                     17,185
 Total stock-based compensation                            $      39,420       $        36,117   $     121,153          $         118,787


 (5) Restructuring. We have engaged in various restructuring activities over the past several years that have resulted in costs associated with severance, benefits, outplacement services, and excess facilities. Each restructuring has been a discrete event based on a unique set of business
objectives or circumstances, and each has differed from the others in terms of its operational implementation, business impact and scope. We do not engage in restructuring activities in the ordinary course of business. While our operations previously benefited from the employees and facilities
covered by our various restructuring charges, these charges have benefited different parts of our business in different ways and the amount of these charges has varied significantly from period to period. We believe that it is important to understand these charges; however, we do not believe
that these charges are indicative of future operating results and that investors benefit from an understanding of our operating results without giving effect to them.

(6) Integration. These charges consist of expenses incurred for consulting services and other professional fees associated with integration activities of acquisitions. Because these expenses are non-recurring and unique to specific acquisitions, we believe they are not indicative of future
operating results and that investors benefit from an understanding of our operating results without giving effect to them.

(7) Write-down of assets. During the September 2007 quarter, management determined that certain tangible and intangible assets and liabilities of the Data Center Management segment did not meet the long term strategic objectives of the segment and we recorded a write-down of $87 million
to value these assets and liabilities at the respective estimated fair value. We adjusted this amount to $93 million in the December 2007 quarter. On January 10, 2008 we signed an agreement to sell these assets. During the December 2007 quarter, we also recorded a $1 million write-down on
a facility classified as held for sale. On January 10, 2008 we signed an agreement to sell these assets.

(8) Income tax effect on above items. This amount adjusts the provision for income taxes to reflect the effect of the non-GAAP adjustments on non-GAAP operating income.

(9) Gain on sale of assets. We exclude these gains because each is a unique one-time occurrence that is not closely related to or a function of our ongoing operations.

(10) We adopted Staff Accounting Bulletin No. 108, “Considering the Effects of Prior Year Misstatements when Quantifying Misstatements in Current Year Financial Statements,” or SAB 108, in fiscal year ended March 2007, and our results for the three and nine months ended December
2006 include the adoption of SAB 108. See item 15, quot;Summary of Significant Accounting Policiesquot; in our March 2007 10-K for a detailed explanation of the impact of our adoption of SAB 108.


                                                                                                                                                                                                                                                                                                    7
SYMANTEC CORPORATION
 Condensed Consolidated Balance Sheets
 (In thousands)
 (Unaudited)

                                                                 December 31,              September 30,               June 30,                March 31,                December 31,             September 30,             June 30,
                                                                                                                                                       (3)                       (3)                       (3)                    (3)
                                                                                                                                                2007                      2006                      2006                   2006
                                                                    2007                       2007                     2007
ASSETS
Current assets:
 Cash and cash equivalents                                   $             1,484,489   $              1,388,364    $           1,374,049   $            2,559,034   $            2,592,003   $             2,607,786   $          3,685,517
 Short-term investments                                                      500,107                    627,478                  660,543                  428,619                  382,519                   343,489                409,216
 Trade accounts receivable, net                                              901,615                    601,837                  568,721                  666,968                  744,766                   563,608                540,552
 Inventories                                                                  34,591                     32,735                   34,666                   42,183                   43,804                    43,010                 42,830
 Deferred income taxes                                                       171,198                    172,422                  163,146                  165,323                  145,687                   119,490                132,387
  Other current assets (1)(2)                                              282,598                   206,840                   279,828                    208,920                205,205                   189,787                191,836
    Total current assets                                                 3,374,598                 3,029,676                 3,080,953                  4,071,047              4,113,984                 3,867,170              5,002,338
                                                                         1,039,510                 1,125,560                 1,113,315                  1,092,240              1,114,018                 1,062,354              1,098,629
Property and equipment, net
                                                                           733,278                   788,884                   925,595                    909,878                992,638                 1,067,766              1,150,352
Acquired product rights, net
                                                                         1,299,083                 1,315,003                 1,411,713                  1,245,638              1,295,445                 1,339,779              1,390,258
Other intangible assets, net
                                                                        11,208,960                10,948,364                10,969,774                 10,340,348             10,344,055                10,326,629             10,329,888
Goodwill
                                                                            53,661                    59,264                    62,959                     63,987                 65,601                    66,462                 59,272
Other long-term assets
                                                                            58,455                    49,998                    57,300                     27,732                 28,547                    14,868                 11,552
Long-term deferred income tax
       Total assets                                          $          17,767,545     $          17,316,749       $        17,621,609     $           17,750,870   $         17,954,288     $          17,745,028     $       19,042,289

LIABILITIES AND STOCKHOLDERS’ EQUITY
Current liabilities:
 Accounts payable                                            $               162,871   $                169,422    $             165,715   $              149,131   $              198,622   $               166,844   $            161,938
 Accrued compensation and benefits                                           410,171                    324,236                  307,202                  307,824                  298,286                   263,415                258,697
 Current deferred revenue                                                  2,497,697                  2,265,575                2,330,411                2,387,733                2,199,844                 1,990,193              2,021,949
 Income taxes payable                                                         78,997                     40,520                   13,056                  238,486                  338,049                   260,183                360,681
 Short-term borrowing                                                        200,000                          -                        -                        -                        -                         -                      -
  Other current liabilities (1)                                              231,686                    191,500                  224,416                  234,915                  182,760                   169,515                170,572
  Short-term convertible debentures                                                -                           -                       -                        -                        -                         -                518,200
    Total current liabilities                                              3,581,422                  2,991,253                3,040,800                3,318,089                3,217,561                 2,850,150              3,492,037
Convertible senior notes                                                   2,100,000                  2,100,000                2,100,000                2,100,000                2,100,000                 2,100,000              2,100,000
Long-term deferred revenue                                                   379,476                    333,022                  334,364                  366,050                  359,357                   335,162                283,385
Long-term deferred tax liabilities                                           219,778                    277,041                  358,010                  343,848                  226,864                   244,324                233,230
Long-term income taxes payable                                               459,126                    424,595                  414,322                        -
Other long-term obligations                                                   98,662                     85,419                   38,647                   21,370                   22,118                    21,470                 26,320
  Total Liabilities                                                        6,838,464                  6,211,330                6,286,143                6,149,357                5,925,900                 5,551,106              6,134,972
Stockholders’ equity:
  Common stock                                                               8,452                     8,650                     8,813                      8,994                  9,275                     9,413                  9,875
  Capital in excess of par value                                         9,207,367                 9,495,987                 9,740,361                 10,061,144             10,511,659                10,759,857             11,552,839
  Accumulated other comprehensive income                                   199,488                   195,814                   189,725                    182,933                184,479                   174,900                172,651
  Retained earnings                                                      1,513,774                 1,404,968                 1,396,567                  1,348,442              1,322,975                 1,249,752              1,171,952
    Total stockholders’ equity                                          10,929,081                11,105,419                11,335,466                 11,601,513             12,028,388                12,193,922             12,907,317
        Total liabilities and stockholders' equity           $          17,767,545     $          17,316,749       $        17,621,609     $           17,750,870   $         17,954,288     $          17,745,028     $       19,042,289


The above information reflects the financial results of Symantec Corporation. Symantec acquired Altiris Inc. on April 6, 2007. The results of operations of Altiris have been included in the Symantec
results of operations since that date.

(1) During the September 2007 quarter, management determined that certain tangible and intangible assets and liabilities of the Data Center Management segment did not meet the long term strategic
objectives of the segment, and we recorded a write-down of $87 million to value these assets and liabilities at the respective estimated fair value. We adjusted this amount to $93 million in the December
2007 quarter. The fair value of these assets, totaling $7 million, is included in Other current assets and liabilities of $3 million are included in Other current liabilities. On January 10, 2008 we signed an
agreement to sell these assets.

(2) During the December 2007 quarter, following a review of our real estate holdings, we classified certain long-term assets as held for sale. We reclassed the assets, totaling $109 million, to Other
current assets, and expect to complete the sale of these assets by the end of the first quarter of fiscal 2009.

(3) We adopted Staff Accounting Bulletin No. 108, “Considering the Effects of Prior Year Misstatements when Quantifying Misstatements in Current Year Financial Statements,” or SAB 108, in fiscal
year ended March 2007, and our results for the three and nine months ended December 2006 include the adoption of SAB 108. See item 15, quot;Summary of Significant Accounting Policiesquot; in our March
2007 10-K for a detailed explanation of the impact of our adoption of SAB 108.


                                                                                                                                                                                                                                        8
Symantec Corporation
Trended Cash Flow Statements
(In thousands)
(Unaudited)

                                                                                                                                                                                         Fiscal (1)        Quarter Ended (1)        Quarter Ended (1)     Quarter Ended (1)    Quarter Ended (1)
                                                                                       Fiscal YTD              Quarter Ended           Quarter Ended            Quarter Ended
                                                                                          2008                   31-Dec-07               30-Sep-07                30-Jun-07                2007              31-Mar-07                 31-Dec-06             30-Sep-06            30-Jun-06
OPERATING ACTIVITIES:
Net income                                                                         $           277,464     $            131,890    $             50,368     $             95,206     $          404,381    $         60,895     $             116,770     $         126,182    $         100,534
Adjustments to reconcile net income to net cash provided by operating activities
 Depreciation and amortization of property and equipment                                       191,170                   63,481                  61,034                   66,655                255,129              64,014                    64,734                62,859               63,522
 Amortization                                                                                  427,234                  137,430                 143,014                  146,790                556,314             137,953                   136,248               138,759              143,354
 Stock−based compensation expense                                                              121,151                   39,417                  40,991                   40,743                153,880              35,134                    36,117                45,770               36,859
 Impairment of equity investments                                                                    -                        -                       -                        -                  2,841                   -                         -                     -                2,841
  Write-down of assets(2)                                                                       93,888                    7,342                   86,546                       -                      -                   -                          -                    -                    -
  Fixed Assets & Intangibles Write-off                                                               -                        -                        -                       -                    912                (302)                     1,358                 (144)                   -
  Deferred income taxes                                                                       (178,647)                 (74,747)                 (78,781)                (25,119)                11,173              90,240                    (61,945)              20,211              (37,333)
  Income tax benefit from stock options                                                         27,730                   10,462                    7,405                   9,863                 43,118              17,477                     14,798                5,705                5,138
  Excess income tax benefit from stock options                                                 (18,307)                  (4,778)                  (4,485)                 (9,044)               (25,539)             (5,951)                   (13,694)              (4,001)              (1,893)
  (Gain) loss on sale of property and equipment                                                  3,253                      177                    3,076                       -                (19,937)             (3,221)                         -              (16,716)                   -
  Other                                                                                              -                        -                      260                    (260)                     -                   -                          -                  500                 (500)
  Net change in assets and liabilities, excluding effects of acquisitions:
    Trade accounts receivable, net                                                            (165,392)                (284,378)                (22,405)                 141,391                33,714               81,169                   (167,072)             (24,449)             144,066
    Inventories                                                                                  9,224                   (1,273)                  2,791                    7,706                10,324                1,982                        185                 (313)               8,470
    Accounts payable                                                                           (13,249)                 (20,896)                 (5,035)                  12,682               (25,624)             (50,697)                    39,087                2,737              (16,751)
    Accrued compensation and benefits                                                           83,794                   84,212                  16,062                  (16,480)               23,169               11,091                     28,821                6,097              (22,840)
    Deferred revenue                                                                             9,466                  238,479                (119,009)                (110,004)              399,517              177,989                    198,900               26,634               (4,006)
    Income taxes payable                                                                       215,462                   84,026                 112,044                   19,392              (181,926)             (94,702)                    70,223              (97,362)             (60,085)
    Other operating assets and liabilities                                                      60,042                   51,161                  37,093                  (28,212)               24,789               43,913                    (10,159)             (15,829)               6,864
Net cash provided by operating activities                                                    1,144,283                  462,005                 330,969                  351,309             1,666,235              566,984                    454,371              276,640              368,240
INVESTING ACTIVITIES:
  Capital expenditures                                                                         (209,129)                (71,100)                 (63,341)                 (74,688)             (419,749)             (70,154)                 (113,108)             (89,413)            (147,074)
  Proceeds from sale of property and equipment                                                        -                       -                     (903)                     903               121,464               34,560                         -               86,904                     -
  Proceeds from sale of Intangible assets                                                             -                       -                        -                        -                     -                    -                         -                    -                     -
  Purchase of intangible assets                                                                       -                       -                                                 -               (13,300)                   -                   (13,300)                   -                     -
  Payments for business acquisitions, net of cash and cash equivalents acquired              (1,150,683)               (298,397)                (11,718)                 (840,568)              (33,373)              (8,358)                  (20,425)              (2,944)               (1,646)
  Purchase of equity investments                                                                      -                       -                       -                         -                     -                    -                         -                    -                     -
  Proceeds from sale of equity investments                                                            -                       -                       -                         -                     -                    -                         -                    -                     -
  Purchases of available-for-sale securities                                                   (825,104)               (184,534)               (340,039)                 (300,531)             (226,905)             (97,339)                  (87,074)             (29,809)             (12,683)
  Proceeds from sales of available-for-sale securities                                          830,903                 332,517                 394,775                   103,611               349,408               53,950                    49,490               98,703              147,265
Net cash (used in) provided by investing activities                                          (1,354,013)                                                               (1,111,273)             (222,455)             (87,341)                 (184,417)               63,441              (14,138)
                                                                                                                       (221,514)                (21,226)
FINANCING ACTIVITIES:
  Sale of common stock warrants                                                                       -                       -                        -                        -              326,102                     -                         -                    -              326,102
  Repurchase of common stock                                                                 (1,299,976)               (399,992)                (399,989)                (499,995)          (2,846,312)             (594,998)                 (384,996)            (974,958)            (891,360)
  Net proceeds from sales of common stock under employee stock benefit plans                    164,162                  33,942                   68,057                   62,163              230,295                61,039                    51,274               77,501               40,481
  Proceeds from debt issuance                                                                         -                       -                        -                        -            2,067,299                  (463)                        -                    -            2,067,762
  Purchase of bond hedge                                                                              -                       -                        -                        -             (592,490)                    -                         -                    -             (592,490)
  Proceeds from short-term borrowing                                                            200,000                 200,000                        -                        -                    -                     -                         -                    -                    -
  Income tax benefit reclassed from operations                                                   18,307                   4,778                    4,485                    9,044               25,539                 5,951                    13,694                4,001                1,893
  Repayment of long term liability                                                               (9,913)                 (2,309)                  (2,271)                  (5,333)            (520,000)                    -                         -             (520,000)                   -
  Restricted stock issuance                                                                      (3,742)                   (692)                    (111)                  (2,939)                   -                     -                         -                    -                    -
Net cash (used in) provided by financing activities                                            (931,162)                                                                 (437,060)          (1,309,567)             (528,471)                 (320,028)          (1,413,456)              952,388
                                                                                                                       (164,273)                (329,829)
Effect of exchange rate fluctuations on cash and cash equivalents                                66,347                  19,907                   34,401                   12,039              109,199                15,859                    34,291               (4,356)              63,405
(Decrease) increase in cash and cash equivalents                                             (1,074,545)                 96,125                   14,315               (1,184,985)             243,412               (32,969)                  (15,783)          (1,077,731)           1,369,895
Beginning cash and cash equivalents                                                           2,559,034               1,388,364                1,374,049                2,559,034            2,315,622             2,592,003                 2,607,786            3,685,517            2,315,622
Ending cash and cash equivalents                                                               1,484,489               1,484,489                1,388,364                1,374,049            2,559,034             2,559,034                 2,592,003            2,607,786            3,685,517


The above information reflects the financial results of Symantec Corporation. Symantec acquired Altiris Inc. on April 6, 2007. The results of operations of Altiris have been included in the Symantec results of operations since that
date.

(1) We adopted Staff Accounting Bulletin No. 108, “Considering the Effects of Prior Year Misstatements when Quantifying Misstatements in Current Year Financial Statements,” or SAB 108, in fiscal year ended March 2007, and
our results for the three and nine months ended December 2006 include the adoption of SAB 108. See item 15, quot;Summary of Significant Accounting Policiesquot; in our March 2007 10-K for a detailed explanation of the impact of our
adoption of SAB 108.

(2) During the September 2007 quarter, management determined that certain tangible and intangible assets and liabilities of the Data Center Management segment did not meet the long term strategic objectives of the segment, and
we recorded a write-down of $87 million to value these assets and liabilities at the respective estimated fair value. We adjusted this amount to $93 million in the December 2007 quarter. On January 10, 2008 we signed an
agreement to sell these assets. During the December 2007 quarter we also recorded a $1 million write-down on a facility classified as held for sale.


                                                                                                                                                                                                                                                                                               9
SYMANTEC CORPORATION
                          Reconciliation of GAAP Deferred Revenue to Non-GAAP Deferred Revenue
                                                        (Unaudited)
                                                       (In thousands)

                                                                                        As of:
                                                                                   December 31, 2007
Deferred revenue reconciliation
GAAP deferred revenue                                                          $            2,877,173
 Add back:
 Deferred revenue related to acquisitions (1)                                                  19,856
Non-GAAP deferred revenue                                                      $            2,897,029


We include certain non-GAAP revenue and deferred revenue components in the tracking and forecasting of our revenue and
management of our business. This includes non-GAAP revenue associated with deferred revenue that was excluded as a result
of purchase accounting adjustments related to acquisitions. We believe the non-GAAP deferred revenue measures set forth
above are useful to investors, and such items are used by our management, because this revenue is reflective of our ongoing
operating results.

 (1) We have completed numerous business combinations and acquisitions for a variety of strategic purposes over the past
several years. As is the case with our existing business, at the time of acquisition, these acquired businesses had recorded
deferred revenue related to past transactions for which revenue would be recognized in future periods as revenue recognition
criteria are satisfied. The purchase accounting entries for these acquisitions require us to write down a portion of this deferred
revenue to its then current fair value. Consequently, in post acquisition periods, we do not recognize the full amount of this
deferred revenue. When measuring the performance of our business, however, we add back non-GAAP revenue associated
with certain types of deferred revenue that were excluded as a result of these purchase accounting adjustments, as we believe
that this provides information about the operating impact of the acquired businesses in a manner consistent with the revenue
recognition for our pre-existing products and services. We believe that the inclusion of this deferred revenue provides useful
information to our management as well as to investors.


                                                                                                                              10
SYMCWebsiteMaster

More Related Content

What's hot

Yahoo 2q08 Earnings Presentation
Yahoo 2q08 Earnings PresentationYahoo 2q08 Earnings Presentation
Yahoo 2q08 Earnings Presentation
guestdb9b4
 
yahoo =2Q08_Earnings_Presentation
yahoo =2Q08_Earnings_Presentationyahoo =2Q08_Earnings_Presentation
yahoo =2Q08_Earnings_Presentation
finance32
 
alcoa 1Q08 Analyst Presentation
alcoa 1Q08 Analyst Presentation alcoa 1Q08 Analyst Presentation
alcoa 1Q08 Analyst Presentation
finance8
 
alcoa 3Q08 Analyst Presentation
alcoa 3Q08 Analyst Presentation alcoa 3Q08 Analyst Presentation
alcoa 3Q08 Analyst Presentation
finance8
 
alcoa 4Q08 Analyst Presentation
alcoa  	4Q08 Analyst Presentation alcoa  	4Q08 Analyst Presentation
alcoa 4Q08 Analyst Presentation
finance8
 
Q4 2002 Earnings Release Presentation
Q4 2002 Earnings Release PresentationQ4 2002 Earnings Release Presentation
Q4 2002 Earnings Release Presentation
finance7
 
Q3 2008 Comcast Corporation Earnings Conference Call
Q3 2008 Comcast Corporation Earnings Conference CallQ3 2008 Comcast Corporation Earnings Conference Call
Q3 2008 Comcast Corporation Earnings Conference Call
finance8
 
alcoa 2Q08 Analyst Presentation
alcoa  	2Q08 Analyst Presentationalcoa  	2Q08 Analyst Presentation
alcoa 2Q08 Analyst Presentation
finance8
 
Q2 2008 Comcast Corporation Earnings Conference Call
Q2 2008 Comcast Corporation Earnings Conference CallQ2 2008 Comcast Corporation Earnings Conference Call
Q2 2008 Comcast Corporation Earnings Conference Call
finance8
 
danaher 07_3Q_Preso
danaher 07_3Q_Presodanaher 07_3Q_Preso
danaher 07_3Q_Preso
finance24
 
walt disney Quarter 2008 4th
walt disney   Quarter 2008 4thwalt disney   Quarter 2008 4th
walt disney Quarter 2008 4th
finance7
 

What's hot (12)

Yahoo 2q08 Earnings Presentation
Yahoo 2q08 Earnings PresentationYahoo 2q08 Earnings Presentation
Yahoo 2q08 Earnings Presentation
 
Slides from Conference Call
Slides from Conference CallSlides from Conference Call
Slides from Conference Call
 
yahoo =2Q08_Earnings_Presentation
yahoo =2Q08_Earnings_Presentationyahoo =2Q08_Earnings_Presentation
yahoo =2Q08_Earnings_Presentation
 
alcoa 1Q08 Analyst Presentation
alcoa 1Q08 Analyst Presentation alcoa 1Q08 Analyst Presentation
alcoa 1Q08 Analyst Presentation
 
alcoa 3Q08 Analyst Presentation
alcoa 3Q08 Analyst Presentation alcoa 3Q08 Analyst Presentation
alcoa 3Q08 Analyst Presentation
 
alcoa 4Q08 Analyst Presentation
alcoa  	4Q08 Analyst Presentation alcoa  	4Q08 Analyst Presentation
alcoa 4Q08 Analyst Presentation
 
Q4 2002 Earnings Release Presentation
Q4 2002 Earnings Release PresentationQ4 2002 Earnings Release Presentation
Q4 2002 Earnings Release Presentation
 
Q3 2008 Comcast Corporation Earnings Conference Call
Q3 2008 Comcast Corporation Earnings Conference CallQ3 2008 Comcast Corporation Earnings Conference Call
Q3 2008 Comcast Corporation Earnings Conference Call
 
alcoa 2Q08 Analyst Presentation
alcoa  	2Q08 Analyst Presentationalcoa  	2Q08 Analyst Presentation
alcoa 2Q08 Analyst Presentation
 
Q2 2008 Comcast Corporation Earnings Conference Call
Q2 2008 Comcast Corporation Earnings Conference CallQ2 2008 Comcast Corporation Earnings Conference Call
Q2 2008 Comcast Corporation Earnings Conference Call
 
danaher 07_3Q_Preso
danaher 07_3Q_Presodanaher 07_3Q_Preso
danaher 07_3Q_Preso
 
walt disney Quarter 2008 4th
walt disney   Quarter 2008 4thwalt disney   Quarter 2008 4th
walt disney Quarter 2008 4th
 

Viewers also liked

symantec 10K32808
symantec 10K32808symantec 10K32808
symantec 10K32808
finance40
 
Symantec_2003AR_Print_Version
Symantec_2003AR_Print_VersionSymantec_2003AR_Print_Version
Symantec_2003AR_Print_Version
finance40
 
energy east EE_AR_2004
energy east EE_AR_2004energy east EE_AR_2004
energy east EE_AR_2004
finance40
 
2008AnnualShareholderMeetingTranscript
2008AnnualShareholderMeetingTranscript2008AnnualShareholderMeetingTranscript
2008AnnualShareholderMeetingTranscript
finance40
 
SYMC1QFY2009EarningsTranscript
SYMC1QFY2009EarningsTranscriptSYMC1QFY2009EarningsTranscript
SYMC1QFY2009EarningsTranscript
finance40
 

Viewers also liked (6)

symantec 10K32808
symantec 10K32808symantec 10K32808
symantec 10K32808
 
SYMC10Q3509
SYMC10Q3509SYMC10Q3509
SYMC10Q3509
 
Symantec_2003AR_Print_Version
Symantec_2003AR_Print_VersionSymantec_2003AR_Print_Version
Symantec_2003AR_Print_Version
 
energy east EE_AR_2004
energy east EE_AR_2004energy east EE_AR_2004
energy east EE_AR_2004
 
2008AnnualShareholderMeetingTranscript
2008AnnualShareholderMeetingTranscript2008AnnualShareholderMeetingTranscript
2008AnnualShareholderMeetingTranscript
 
SYMC1QFY2009EarningsTranscript
SYMC1QFY2009EarningsTranscriptSYMC1QFY2009EarningsTranscript
SYMC1QFY2009EarningsTranscript
 

Similar to SYMCWebsiteMaster

Q309EarningsSupplementalFINALII
Q309EarningsSupplementalFINALIIQ309EarningsSupplementalFINALII
Q309EarningsSupplementalFINALII
finance40
 
SYMC Q309EarningsSupplementalFINALII
SYMC Q309EarningsSupplementalFINALIISYMC Q309EarningsSupplementalFINALII
SYMC Q309EarningsSupplementalFINALII
finance40
 
Q209EarningsSupplementalData
Q209EarningsSupplementalDataQ209EarningsSupplementalData
Q209EarningsSupplementalData
finance40
 
yahoo 3Q08EarningsPreso
yahoo 3Q08EarningsPresoyahoo 3Q08EarningsPreso
yahoo 3Q08EarningsPreso
finance32
 
yahoo 4Q08EarningsPresentation
yahoo 4Q08EarningsPresentationyahoo 4Q08EarningsPresentation
yahoo 4Q08EarningsPresentation
finance32
 
walt disney Quarter 2007 3rd
walt disney  Quarter 2007 3rdwalt disney  Quarter 2007 3rd
walt disney Quarter 2007 3rd
finance7
 
citigroup October 16, 2008 - Third Quarter Press Release
citigroup October 16, 2008 - Third Quarter Press Releasecitigroup October 16, 2008 - Third Quarter Press Release
citigroup October 16, 2008 - Third Quarter Press Release
QuarterlyEarningsReports
 
Presentation on Q1 2009 Earning Report of Yahoo Inc.
Presentation on Q1 2009 Earning Report of Yahoo Inc.Presentation on Q1 2009 Earning Report of Yahoo Inc.
Presentation on Q1 2009 Earning Report of Yahoo Inc.
earningreport earningreport
 
citigroup Financial Supplement July 18, 2008 - Second Quarter
citigroup Financial Supplement July 18, 2008 - Second Quartercitigroup Financial Supplement July 18, 2008 - Second Quarter
citigroup Financial Supplement July 18, 2008 - Second Quarter
QuarterlyEarningsReports
 
Owens_Minor_2Q2008_webcast_slides_v_final
Owens_Minor_2Q2008_webcast_slides_v_finalOwens_Minor_2Q2008_webcast_slides_v_final
Owens_Minor_2Q2008_webcast_slides_v_final
finance33
 
Yahoo! 2 Q 2007 Earnings Presentation
Yahoo! 2 Q 2007 Earnings PresentationYahoo! 2 Q 2007 Earnings Presentation
Yahoo! 2 Q 2007 Earnings Presentation
eraz
 
viacom 20081103%20Q308%20Web%20Deck
viacom 20081103%20Q308%20Web%20Deckviacom 20081103%20Q308%20Web%20Deck
viacom 20081103%20Q308%20Web%20Deck
finance20
 

Similar to SYMCWebsiteMaster (20)

Q309EarningsSupplementalFINALII
Q309EarningsSupplementalFINALIIQ309EarningsSupplementalFINALII
Q309EarningsSupplementalFINALII
 
SYMC Q309EarningsSupplementalFINALII
SYMC Q309EarningsSupplementalFINALIISYMC Q309EarningsSupplementalFINALII
SYMC Q309EarningsSupplementalFINALII
 
Q209EarningsSupplementalData
Q209EarningsSupplementalDataQ209EarningsSupplementalData
Q209EarningsSupplementalData
 
SYMCQ109
SYMCQ109SYMCQ109
SYMCQ109
 
Slides from Conference Call
Slides from Conference CallSlides from Conference Call
Slides from Conference Call
 
Slides from Conference Call
Slides from Conference CallSlides from Conference Call
Slides from Conference Call
 
Read the Earnings Release
Read the Earnings ReleaseRead the Earnings Release
Read the Earnings Release
 
yahoo 3Q08EarningsPreso
yahoo 3Q08EarningsPresoyahoo 3Q08EarningsPreso
yahoo 3Q08EarningsPreso
 
citigroup Qer084s
citigroup Qer084scitigroup Qer084s
citigroup Qer084s
 
yahoo 4Q08EarningsPresentation
yahoo 4Q08EarningsPresentationyahoo 4Q08EarningsPresentation
yahoo 4Q08EarningsPresentation
 
walt disney Quarter 2007 3rd
walt disney  Quarter 2007 3rdwalt disney  Quarter 2007 3rd
walt disney Quarter 2007 3rd
 
citigroup Qer084s
citigroup Qer084scitigroup Qer084s
citigroup Qer084s
 
citigroup October 16, 2008 - Third Quarter Press Release
citigroup October 16, 2008 - Third Quarter Press Releasecitigroup October 16, 2008 - Third Quarter Press Release
citigroup October 16, 2008 - Third Quarter Press Release
 
Presentation on Q1 2009 Earning Report of Yahoo Inc.
Presentation on Q1 2009 Earning Report of Yahoo Inc.Presentation on Q1 2009 Earning Report of Yahoo Inc.
Presentation on Q1 2009 Earning Report of Yahoo Inc.
 
Yhoo 1 Q09 Earnings Presentation Final
Yhoo 1 Q09 Earnings Presentation FinalYhoo 1 Q09 Earnings Presentation Final
Yhoo 1 Q09 Earnings Presentation Final
 
citigroup October 15, 2007 - Third Quarte
citigroup October 15, 2007 - Third Quartecitigroup October 15, 2007 - Third Quarte
citigroup October 15, 2007 - Third Quarte
 
citigroup Financial Supplement July 18, 2008 - Second Quarter
citigroup Financial Supplement July 18, 2008 - Second Quartercitigroup Financial Supplement July 18, 2008 - Second Quarter
citigroup Financial Supplement July 18, 2008 - Second Quarter
 
Owens_Minor_2Q2008_webcast_slides_v_final
Owens_Minor_2Q2008_webcast_slides_v_finalOwens_Minor_2Q2008_webcast_slides_v_final
Owens_Minor_2Q2008_webcast_slides_v_final
 
Yahoo! 2 Q 2007 Earnings Presentation
Yahoo! 2 Q 2007 Earnings PresentationYahoo! 2 Q 2007 Earnings Presentation
Yahoo! 2 Q 2007 Earnings Presentation
 
viacom 20081103%20Q308%20Web%20Deck
viacom 20081103%20Q308%20Web%20Deckviacom 20081103%20Q308%20Web%20Deck
viacom 20081103%20Q308%20Web%20Deck
 

More from finance40

thermo fisher ED886123-7163-46F5-8387-5F57485F786B_FINAL09SHOW_III
thermo fisher ED886123-7163-46F5-8387-5F57485F786B_FINAL09SHOW_IIIthermo fisher ED886123-7163-46F5-8387-5F57485F786B_FINAL09SHOW_III
thermo fisher ED886123-7163-46F5-8387-5F57485F786B_FINAL09SHOW_III
finance40
 
thermo fisher 04/01/06_10Q
thermo fisher 04/01/06_10Qthermo fisher 04/01/06_10Q
thermo fisher 04/01/06_10Q
finance40
 
thermo fisher 04/01/06_10Q
thermo fisher 04/01/06_10Qthermo fisher 04/01/06_10Q
thermo fisher 04/01/06_10Q
finance40
 
thermo fisher 07/01/06_10Q
thermo fisher 07/01/06_10Qthermo fisher 07/01/06_10Q
thermo fisher 07/01/06_10Q
finance40
 
thermo fisher 07/01/06_10Q
thermo fisher 07/01/06_10Qthermo fisher 07/01/06_10Q
thermo fisher 07/01/06_10Q
finance40
 
thermo fisher 09/30/06_10Q
thermo fisher 09/30/06_10Qthermo fisher 09/30/06_10Q
thermo fisher 09/30/06_10Q
finance40
 
thermo fisher 09/30/06_10Q
thermo fisher 09/30/06_10Qthermo fisher 09/30/06_10Q
thermo fisher 09/30/06_10Q
finance40
 
thermo fisher 12/30/0610K
thermo fisher 12/30/0610Kthermo fisher 12/30/0610K
thermo fisher 12/30/0610K
finance40
 
thermo fisher 12/30/0610K
thermo fisher 12/30/0610Kthermo fisher 12/30/0610K
thermo fisher 12/30/0610K
finance40
 
thermo fisher Q107_10Q
thermo fisher Q107_10Qthermo fisher Q107_10Q
thermo fisher Q107_10Q
finance40
 
thermo fisher Q107_10Q
thermo fisher Q107_10Qthermo fisher Q107_10Q
thermo fisher Q107_10Q
finance40
 
thermo fisher Q207_10Q
thermo fisher Q207_10Qthermo fisher Q207_10Q
thermo fisher Q207_10Q
finance40
 
thermo fisher Q207_10Q
thermo fisher Q207_10Qthermo fisher Q207_10Q
thermo fisher Q207_10Q
finance40
 
thermo fisher Q307_10Q
thermo fisher Q307_10Qthermo fisher Q307_10Q
thermo fisher Q307_10Q
finance40
 
thermo fisher Q307_10Q
thermo fisher Q307_10Qthermo fisher Q307_10Q
thermo fisher Q307_10Q
finance40
 
tmo_2007_10K
tmo_2007_10Ktmo_2007_10K
tmo_2007_10K
finance40
 
tmo_2007_10K
tmo_2007_10Ktmo_2007_10K
tmo_2007_10K
finance40
 
thermo fisher Q10810q
thermo fisher Q10810qthermo fisher Q10810q
thermo fisher Q10810q
finance40
 
thermo fisher Q10810q
thermo fisher Q10810qthermo fisher Q10810q
thermo fisher Q10810q
finance40
 
thermo fisher tmoq310q
thermo fisher tmoq310qthermo fisher tmoq310q
thermo fisher tmoq310q
finance40
 

More from finance40 (20)

thermo fisher ED886123-7163-46F5-8387-5F57485F786B_FINAL09SHOW_III
thermo fisher ED886123-7163-46F5-8387-5F57485F786B_FINAL09SHOW_IIIthermo fisher ED886123-7163-46F5-8387-5F57485F786B_FINAL09SHOW_III
thermo fisher ED886123-7163-46F5-8387-5F57485F786B_FINAL09SHOW_III
 
thermo fisher 04/01/06_10Q
thermo fisher 04/01/06_10Qthermo fisher 04/01/06_10Q
thermo fisher 04/01/06_10Q
 
thermo fisher 04/01/06_10Q
thermo fisher 04/01/06_10Qthermo fisher 04/01/06_10Q
thermo fisher 04/01/06_10Q
 
thermo fisher 07/01/06_10Q
thermo fisher 07/01/06_10Qthermo fisher 07/01/06_10Q
thermo fisher 07/01/06_10Q
 
thermo fisher 07/01/06_10Q
thermo fisher 07/01/06_10Qthermo fisher 07/01/06_10Q
thermo fisher 07/01/06_10Q
 
thermo fisher 09/30/06_10Q
thermo fisher 09/30/06_10Qthermo fisher 09/30/06_10Q
thermo fisher 09/30/06_10Q
 
thermo fisher 09/30/06_10Q
thermo fisher 09/30/06_10Qthermo fisher 09/30/06_10Q
thermo fisher 09/30/06_10Q
 
thermo fisher 12/30/0610K
thermo fisher 12/30/0610Kthermo fisher 12/30/0610K
thermo fisher 12/30/0610K
 
thermo fisher 12/30/0610K
thermo fisher 12/30/0610Kthermo fisher 12/30/0610K
thermo fisher 12/30/0610K
 
thermo fisher Q107_10Q
thermo fisher Q107_10Qthermo fisher Q107_10Q
thermo fisher Q107_10Q
 
thermo fisher Q107_10Q
thermo fisher Q107_10Qthermo fisher Q107_10Q
thermo fisher Q107_10Q
 
thermo fisher Q207_10Q
thermo fisher Q207_10Qthermo fisher Q207_10Q
thermo fisher Q207_10Q
 
thermo fisher Q207_10Q
thermo fisher Q207_10Qthermo fisher Q207_10Q
thermo fisher Q207_10Q
 
thermo fisher Q307_10Q
thermo fisher Q307_10Qthermo fisher Q307_10Q
thermo fisher Q307_10Q
 
thermo fisher Q307_10Q
thermo fisher Q307_10Qthermo fisher Q307_10Q
thermo fisher Q307_10Q
 
tmo_2007_10K
tmo_2007_10Ktmo_2007_10K
tmo_2007_10K
 
tmo_2007_10K
tmo_2007_10Ktmo_2007_10K
tmo_2007_10K
 
thermo fisher Q10810q
thermo fisher Q10810qthermo fisher Q10810q
thermo fisher Q10810q
 
thermo fisher Q10810q
thermo fisher Q10810qthermo fisher Q10810q
thermo fisher Q10810q
 
thermo fisher tmoq310q
thermo fisher tmoq310qthermo fisher tmoq310q
thermo fisher tmoq310q
 

Recently uploaded

( Jasmin ) Top VIP Escorts Service Dindigul 💧 7737669865 💧 by Dindigul Call G...
( Jasmin ) Top VIP Escorts Service Dindigul 💧 7737669865 💧 by Dindigul Call G...( Jasmin ) Top VIP Escorts Service Dindigul 💧 7737669865 💧 by Dindigul Call G...
( Jasmin ) Top VIP Escorts Service Dindigul 💧 7737669865 💧 by Dindigul Call G...
dipikadinghjn ( Why You Choose Us? ) Escorts
 
VIP Call Girl in Mumbai Central 💧 9920725232 ( Call Me ) Get A New Crush Ever...
VIP Call Girl in Mumbai Central 💧 9920725232 ( Call Me ) Get A New Crush Ever...VIP Call Girl in Mumbai Central 💧 9920725232 ( Call Me ) Get A New Crush Ever...
VIP Call Girl in Mumbai Central 💧 9920725232 ( Call Me ) Get A New Crush Ever...
dipikadinghjn ( Why You Choose Us? ) Escorts
 
VIP Independent Call Girls in Mumbai 🌹 9920725232 ( Call Me ) Mumbai Escorts ...
VIP Independent Call Girls in Mumbai 🌹 9920725232 ( Call Me ) Mumbai Escorts ...VIP Independent Call Girls in Mumbai 🌹 9920725232 ( Call Me ) Mumbai Escorts ...
VIP Independent Call Girls in Mumbai 🌹 9920725232 ( Call Me ) Mumbai Escorts ...
dipikadinghjn ( Why You Choose Us? ) Escorts
 
VIP Independent Call Girls in Andheri 🌹 9920725232 ( Call Me ) Mumbai Escorts...
VIP Independent Call Girls in Andheri 🌹 9920725232 ( Call Me ) Mumbai Escorts...VIP Independent Call Girls in Andheri 🌹 9920725232 ( Call Me ) Mumbai Escorts...
VIP Independent Call Girls in Andheri 🌹 9920725232 ( Call Me ) Mumbai Escorts...
dipikadinghjn ( Why You Choose Us? ) Escorts
 
VIP Call Girl in Mira Road 💧 9920725232 ( Call Me ) Get A New Crush Everyday ...
VIP Call Girl in Mira Road 💧 9920725232 ( Call Me ) Get A New Crush Everyday ...VIP Call Girl in Mira Road 💧 9920725232 ( Call Me ) Get A New Crush Everyday ...
VIP Call Girl in Mira Road 💧 9920725232 ( Call Me ) Get A New Crush Everyday ...
dipikadinghjn ( Why You Choose Us? ) Escorts
 

Recently uploaded (20)

Booking open Available Pune Call Girls Wadgaon Sheri 6297143586 Call Hot Ind...
Booking open Available Pune Call Girls Wadgaon Sheri  6297143586 Call Hot Ind...Booking open Available Pune Call Girls Wadgaon Sheri  6297143586 Call Hot Ind...
Booking open Available Pune Call Girls Wadgaon Sheri 6297143586 Call Hot Ind...
 
Call Girls in New Friends Colony Delhi 💯 Call Us 🔝9205541914 🔝( Delhi) Escort...
Call Girls in New Friends Colony Delhi 💯 Call Us 🔝9205541914 🔝( Delhi) Escort...Call Girls in New Friends Colony Delhi 💯 Call Us 🔝9205541914 🔝( Delhi) Escort...
Call Girls in New Friends Colony Delhi 💯 Call Us 🔝9205541914 🔝( Delhi) Escort...
 
( Jasmin ) Top VIP Escorts Service Dindigul 💧 7737669865 💧 by Dindigul Call G...
( Jasmin ) Top VIP Escorts Service Dindigul 💧 7737669865 💧 by Dindigul Call G...( Jasmin ) Top VIP Escorts Service Dindigul 💧 7737669865 💧 by Dindigul Call G...
( Jasmin ) Top VIP Escorts Service Dindigul 💧 7737669865 💧 by Dindigul Call G...
 
Webinar on E-Invoicing for Fintech Belgium
Webinar on E-Invoicing for Fintech BelgiumWebinar on E-Invoicing for Fintech Belgium
Webinar on E-Invoicing for Fintech Belgium
 
Diva-Thane European Call Girls Number-9833754194-Diva Busty Professional Call...
Diva-Thane European Call Girls Number-9833754194-Diva Busty Professional Call...Diva-Thane European Call Girls Number-9833754194-Diva Busty Professional Call...
Diva-Thane European Call Girls Number-9833754194-Diva Busty Professional Call...
 
VIP Call Girl in Mumbai Central 💧 9920725232 ( Call Me ) Get A New Crush Ever...
VIP Call Girl in Mumbai Central 💧 9920725232 ( Call Me ) Get A New Crush Ever...VIP Call Girl in Mumbai Central 💧 9920725232 ( Call Me ) Get A New Crush Ever...
VIP Call Girl in Mumbai Central 💧 9920725232 ( Call Me ) Get A New Crush Ever...
 
Booking open Available Pune Call Girls Shivane 6297143586 Call Hot Indian Gi...
Booking open Available Pune Call Girls Shivane  6297143586 Call Hot Indian Gi...Booking open Available Pune Call Girls Shivane  6297143586 Call Hot Indian Gi...
Booking open Available Pune Call Girls Shivane 6297143586 Call Hot Indian Gi...
 
Top Rated Pune Call Girls Shikrapur ⟟ 6297143586 ⟟ Call Me For Genuine Sex S...
Top Rated  Pune Call Girls Shikrapur ⟟ 6297143586 ⟟ Call Me For Genuine Sex S...Top Rated  Pune Call Girls Shikrapur ⟟ 6297143586 ⟟ Call Me For Genuine Sex S...
Top Rated Pune Call Girls Shikrapur ⟟ 6297143586 ⟟ Call Me For Genuine Sex S...
 
Stock Market Brief Deck (Under Pressure).pdf
Stock Market Brief Deck (Under Pressure).pdfStock Market Brief Deck (Under Pressure).pdf
Stock Market Brief Deck (Under Pressure).pdf
 
Indore Real Estate Market Trends Report.pdf
Indore Real Estate Market Trends Report.pdfIndore Real Estate Market Trends Report.pdf
Indore Real Estate Market Trends Report.pdf
 
Top Rated Pune Call Girls Lohegaon ⟟ 6297143586 ⟟ Call Me For Genuine Sex Se...
Top Rated  Pune Call Girls Lohegaon ⟟ 6297143586 ⟟ Call Me For Genuine Sex Se...Top Rated  Pune Call Girls Lohegaon ⟟ 6297143586 ⟟ Call Me For Genuine Sex Se...
Top Rated Pune Call Girls Lohegaon ⟟ 6297143586 ⟟ Call Me For Genuine Sex Se...
 
Solution Manual for Principles of Corporate Finance 14th Edition by Richard B...
Solution Manual for Principles of Corporate Finance 14th Edition by Richard B...Solution Manual for Principles of Corporate Finance 14th Edition by Richard B...
Solution Manual for Principles of Corporate Finance 14th Edition by Richard B...
 
Top Rated Pune Call Girls Dighi ⟟ 6297143586 ⟟ Call Me For Genuine Sex Servi...
Top Rated  Pune Call Girls Dighi ⟟ 6297143586 ⟟ Call Me For Genuine Sex Servi...Top Rated  Pune Call Girls Dighi ⟟ 6297143586 ⟟ Call Me For Genuine Sex Servi...
Top Rated Pune Call Girls Dighi ⟟ 6297143586 ⟟ Call Me For Genuine Sex Servi...
 
(INDIRA) Call Girl Srinagar Call Now 8617697112 Srinagar Escorts 24x7
(INDIRA) Call Girl Srinagar Call Now 8617697112 Srinagar Escorts 24x7(INDIRA) Call Girl Srinagar Call Now 8617697112 Srinagar Escorts 24x7
(INDIRA) Call Girl Srinagar Call Now 8617697112 Srinagar Escorts 24x7
 
VIP Independent Call Girls in Mumbai 🌹 9920725232 ( Call Me ) Mumbai Escorts ...
VIP Independent Call Girls in Mumbai 🌹 9920725232 ( Call Me ) Mumbai Escorts ...VIP Independent Call Girls in Mumbai 🌹 9920725232 ( Call Me ) Mumbai Escorts ...
VIP Independent Call Girls in Mumbai 🌹 9920725232 ( Call Me ) Mumbai Escorts ...
 
Enjoy Night⚡Call Girls Patel Nagar Delhi >༒8448380779 Escort Service
Enjoy Night⚡Call Girls Patel Nagar Delhi >༒8448380779 Escort ServiceEnjoy Night⚡Call Girls Patel Nagar Delhi >༒8448380779 Escort Service
Enjoy Night⚡Call Girls Patel Nagar Delhi >༒8448380779 Escort Service
 
Call Girls Service Pune ₹7.5k Pick Up & Drop With Cash Payment 9352852248 Cal...
Call Girls Service Pune ₹7.5k Pick Up & Drop With Cash Payment 9352852248 Cal...Call Girls Service Pune ₹7.5k Pick Up & Drop With Cash Payment 9352852248 Cal...
Call Girls Service Pune ₹7.5k Pick Up & Drop With Cash Payment 9352852248 Cal...
 
VIP Independent Call Girls in Andheri 🌹 9920725232 ( Call Me ) Mumbai Escorts...
VIP Independent Call Girls in Andheri 🌹 9920725232 ( Call Me ) Mumbai Escorts...VIP Independent Call Girls in Andheri 🌹 9920725232 ( Call Me ) Mumbai Escorts...
VIP Independent Call Girls in Andheri 🌹 9920725232 ( Call Me ) Mumbai Escorts...
 
Gurley shaw Theory of Monetary Economics.
Gurley shaw Theory of Monetary Economics.Gurley shaw Theory of Monetary Economics.
Gurley shaw Theory of Monetary Economics.
 
VIP Call Girl in Mira Road 💧 9920725232 ( Call Me ) Get A New Crush Everyday ...
VIP Call Girl in Mira Road 💧 9920725232 ( Call Me ) Get A New Crush Everyday ...VIP Call Girl in Mira Road 💧 9920725232 ( Call Me ) Get A New Crush Everyday ...
VIP Call Girl in Mira Road 💧 9920725232 ( Call Me ) Get A New Crush Everyday ...
 

SYMCWebsiteMaster

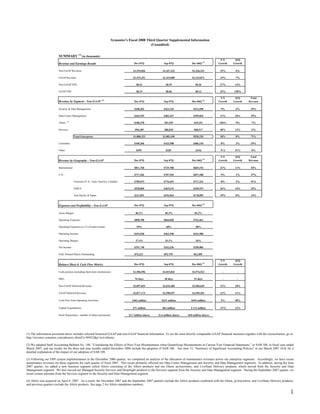
  • 1. Symantec's Fiscal 2008 Third Quarter Supplemental Information (Unaudited) SUMMARY (1) (in thousands) Y/Y Q/Q (2) Dec-07Q Sep-07Q Dec-06Q Growth Growth Revenue and Earnings Results Non-GAAP Revenue: $1,529,026 $1,437,332 $1,326,341 15% 6% GAAP Revenue: $1,515,251 $1,419,089 $1,315,873 15% 7% Non-GAAP EPS: $0.33 $0.29 $0.26 27% 14% GAAP EPS: $0.15 $0.06 $0.12 25% 150% Y/Y Q/Q Total (3) (2) Revenue by Segment - Non-GAAP Dec-07Q Sep-07Q Dec-06Q Growth Growth Revenue Security & Data Management: $448,203 $423,210 $412,698 9% 6% 29% Data Center Management: $443,555 $402,347 $399,844 11% 10% 29% (4) Altiris: $100,378 $91,929 $39,151 156% 9% 7% Services: $96,189 $86,010 $68,517 40% 12% 6% Total Enterprise: $1,088,325 $1,003,496 $920,210 18% 8% 71% Consumer: $440,206 $433,508 $406,145 8% 2% 29% Other: $495 $328 ($14) N/A 51% 0% Y/Y Q/Q Total (2) Dec-07Q Sep-07Q Dec-06Q Growth Growth Revenue Revenue by Geography - Non-GAAP International: $811,760 $729,788 $669,153 21% 11% 53% U.S.: $717,266 $707,544 $657,188 9% 1% 47% Americas (U.S., Latin America, Canada): $789,075 $776,692 $727,323 8% 2% 51% EMEA: $528,860 $465,676 $420,919 26% 14% 35% Asia Pacific & Japan: $211,091 $194,964 $178,099 19% 8% 14% (2) Dec-07Q Sep-07Q Dec-06Q Expenses and Profitability - Non-GAAP Gross Margin: 86.2% 85.3% 83.2% Operating Expenses: $898,708 $864,820 $762,661 Operating Expenses as a % of total revenue: 59% 60% 58% Operating Income: $419,538 $361,548 $341,508 Operating Margin: 27.4% 25.2% 26% Net Income: $291,748 $262,636 $250,806 Fully Diluted Shares Outstanding: 876,221 892,759 963,309 Y/Y Q/Q (2) Dec-07Q Sep-07Q Dec-06Q Growth Growth Balance Sheet & Cash Flow Metrics Cash position (including short-term investments): $1,984,596 $2,015,842 $2,974,522 - - DSO: 54 days 38 days 51 days - - Non-GAAP Deferred Revenue: $2,897,029 $2,624,485 $2,584,649 12% 10% GAAP Deferred Revenue: $2,877,173 $2,598,597 $2,559,201 12% 11% Cash Flow from Operating Activities: $462 million $331 million $454 million 2% 40% Capital Expenditures: $71 million $63 million $ 113 million -37% 12% Stock Repurchase - number of shares purchased: 22.7 million shares 21.6 million shares 18.8 million shares (1) The information presented above includes selected historical GAAP and non-GAAP financial information. To see the most directly comparable GAAP financial measures together with the reconciliation, go to: http://investor.symantec.com/phoenix.zhtml?c=89422&p=irol-irhome (2) We adopted Staff Accounting Bulletin No. 108, “Considering the Effects of Prior Year Misstatements when Quantifying Misstatements in Current Year Financial Statements,” or SAB 108, in fiscal year ended March 2007, and our results for the three and nine months ended December 2006 include the adoption of SAB 108. See item 15, quot;Summary of Significant Accounting Policiesquot; in our March 2007 10-K for a detailed explanation of the impact of our adoption of SAB 108. (3) Following our ERP system implementation in the December 2006 quarter, we completed an analysis of the allocation of maintenance revenues across our enterprise segments. Accordingly, we have recast maintenance revenues for these segments for each quarter of fiscal 2007. This recast primarily affected our Data Center Management and Security and Data Management segments. In addition, during the June 2007 quarter, we added a new business segment called Altiris consisting of the Altiris products and our Ghost, pcAnywhere, and LiveState Delivery products, which moved from the Security and Data Management segment. We also moved our Managed Security Services and DeepSight products to the Services segment from the Security and Data Management segment. During the September 2007 quarter, we recast certain amounts from the Services segment to the Security and Data Management segment. (4) Altiris was acquired on April 6, 2007. As a result, the December 2007 and the September 2007 quarters include the Altiris products combined with the Ghost, pcAnywhere, and LiveState Delivery products, and previous quarters exclude the Altiris products. See page 2 for Altiris standalone numbers. 1
  • 2. Symantec Big Deal Summary (1) Symantec Headcount Greater than Greater than $300k $1m Employees 554 127 17,906 Dec-07 Dec-07 302 64 18,059 Sep-07 Sep-07 249 48 17,705 Jun-07 Jun-07 391 101 17,131 Mar-07 Mar-07 409 115 17,396 Dec-06 Dec-06 293 67 16,598 Sep-06 Sep-06 299 64 16,161 Jun-06 Jun-06 (1) Includes Altiris products for all periods shown. Altiris Standalone - Non-GAAP (2) Altiris Standalone - GAAP (2) Quarterly Revenue for Altiris Standalone for Fiscal Year 2008: Quarterly Revenue for Altiris Standalone for Fiscal Year 2007: (Unaudited) (Unaudited) (in thousands) Altiris (in thousands) Altiris Jun-07 $ 53,257 Jun-06 $ 57,404 Sep-07 55,687 Sep-06 55,620 Dec-07 65,121 Dec-06 55,969 Mar-07 60,441 $ 174,065 $ 229,434 YTD FY-08 FY-07 (2) The historical Altiris standalone amounts are shown using Symantec’s fiscal periods. Symantec's fiscal years end March 31st whereas Altiris’ fiscal years ended December 31st. 2
  • 3. SYMANTEC CORPORATION Reconciliation of GAAP Revenue Components to Non-GAAP Revenue Components (In thousands) (Unaudited) YTD FY 2008 Three Months Ended Dec 31, 2007 Three Months Ended Sep 30, 2007 Three Months Ended Jun 30, 2007 Non-GAAP Non-GAAP Non-GAAP Non-GAAP (1) (1) (1) (1) Adjustments Adjustments Adjustments Adjustments GAAP Non-GAAP GAAP Non-GAAP GAAP Non-GAAP GAAP Non-GAAP $ 4,334,678 $ 54,524 $ 4,389,202 $ 1,515,251 $ 13,775 $ 1,529,026 $ 1,419,089 $ 18,243 $ 1,437,332 $ 1,400,338 $ 22,506 $ 1,422,844 Net Revenues Revenue By Segment: $ 1,292,564 $ 3,107 $ 1,295,671 $ 446,839 $ 1,364 $ 448,203 $ 422,464 $ 746 $ 423,210 $ 423,261 $ 997 $ 424,258 Security & Data Management Data Center Management 1,237,996 12,284 1,250,280 440,416 3,139 443,555 398,355 3,992 402,347 399,225 5,153 404,378 - - - - Consumer 1,297,464 1,297,464 440,206 440,206 433,508 433,508 423,750 423,750 (2) Altiris 242,245 39,133 281,378 91,106 9,272 100,378 78,424 13,505 91,929 72,715 16,356 89,071 - - - - Services 263,345 263,345 96,189 96,189 86,010 86,010 81,146 81,146 (3) Other $ 1,064 $ - $ 1,064 $ 495 $ - $ 495 $ 328 $ - $ 328 $ 241 $ - $ 241 Revenue by Geography: (4) Americas $ 2,295,736 $ 36,431 $ 2,332,167 $ 779,817 $ 9,258 $ 789,075 $ 764,470 $ 12,222 $ 776,692 $ 751,449 $ 14,951 $ 766,400 EMEA 1,443,270 15,555 1,458,825 524,981 3,879 528,860 460,485 5,191 465,676 457,804 6,485 464,289 $ 595,672 $ 2,538 $ 598,210 $ 210,453 $ 638 $ 211,091 $ 194,134 $ 830 $ 194,964 $ 191,085 $ 1,070 $ 192,155 Asia Pacific/Japan $ 2,085,349 $ 35,803 $ 2,121,152 $ 708,186 $ 9,080 $ 717,266 $ 695,517 $ 12,027 $ 707,544 $ 681,646 $ 14,696 $ 696,342 Total U.S. Revenue $ 2,249,329 $ 18,721 $ 2,268,050 $ 807,065 $ 4,695 $ 811,760 $ 723,572 $ 6,216 $ 729,788 $ 718,692 $ 7,810 $ 726,502 Total International Revenue (5) $ 134,933 $ 39,132 $ 174,065 $ 55,850 $ 9,271 $ 65,121 $ 42,182 $ 13,505 $ 55,687 $ 36,901 $ 16,356 $ 53,257 Altiris Standalone Net Revenues We include certain non-GAAP revenue and deferred revenue components in the tracking and forecasting of our revenue and management of our business. This includes non-GAAP revenue associated with deferred revenue that was excluded as a result of purchase accounting adjustments related to acquisitions. We believe the non-GAAP revenue measures set forth above are useful to investors, and such items are used by our management, because this revenue is reflective of our ongoing operating results. (1) We have completed numerous business combinations and acquisitions for a variety of strategic purposes over the past several years. As is the case with our existing business, at the time of acquisition, acquired business had recorded deferred revenue related to past transactions for which revenue would be recognized in future periods as revenue recognition criteria are satisfied. The purchase accounting entries for these acquisitions require us to write down a portion of this deferred revenue to its then current fair value. Consequently, in post acquisition periods, we do not recognize the full amount of this deferred revenue. When measuring the performance of our business, however, we add back non-GAAP revenue associated with certain types of deferred revenue that were excluded as a result of these purchase accounting adjustments, as we believe that this provides information about the operating impact of the acquired businesses in a manner consistent with the revenue recognition for our for our pre-existing products and services. We believe that the inclusion of this revenue provides useful information to our management as well as to investors. (2) During the June 2007 quarter, we added a new business segment called Altiris consisting of the Altiris products and our Ghost, pcAnywhere, and LiveState Delivery products, which moved from the Security and Data Management segment. We also moved our Managed Security Services and DeepSight products to the Services segment from the Security and Data Management segment. During the September 2007 quarter, we recast certain amounts from the Services segment to the Security and Data Management segment. (3) Other includes divested product lines and/or product lines nearing the end of their life cycle. See item 15, Footnote 15 in our March 2007 10-K. (4) The Americas includes the United States, Latin America, and Canada. (5) Excludes legacy Symantec products included in the Altiris segment. See note (2) above. 3
  • 4. SYMANTEC CORPORATION Reconciliation of GAAP Revenue Components to Non-GAAP Revenue Components (In thousands) (Unaudited) FY 2007 (1) Three Months Ended Dec 31, 2006 (1) Three Months Ended Sep 30, 2006 (1) Three Months Ended Jun 30, 2006 (1) Three Months Ended Mar 31, 2007 (1) Non-GAAP Non-GAAP Non-GAAP Non-GAAP Non-GAAP Adjustments (2) Adjustments (2) Adjustments (2) Adjustments (5) Adjustments (2) GAAP Non-GAAP GAAP Non-GAAP GAAP Non-GAAP GAAP Non-GAAP GAAP Non-GAAP $ 5,199,366 $ 53,298 $ 5,252,664 $ 1,357,217 $ 7,565 $ 1,364,782 $ 1,315,873 $ 10,468 $ 1,326,341 $ 1,260,408 $ 12,984 $ 1,273,392 $ 1,265,868 $ 22,281 $ 1,288,149 Net Revenues Revenue By Segment: (3) Security & Data Management $ 1,621,190 $ 9,455 $ 1,630,645 $ 410,869 $ 1,234 $ 412,103 $ 411,140 $ 1,558 $ 412,698 $ 394,892 $ 2,232 $ 397,124 $ 404,289 $ 4,431 $ 408,720 Data Center Management 1,533,848 43,641 1,577,489 411,081 6,331 417,412 390,934 8,910 399,844 363,778 10,752 374,530 368,055 17,648 385,703 Consumer 1,590,505 - 1,590,505 408,200 - 408,200 406,145 - 406,145 394,382 - 394,382 381,778 - 381,778 Altiris (3) - - - - - 160,475 160,475 40,562 40,562 39,151 39,151 40,933 40,933 39,829 39,829 - - - Services 293,226 202 293,428 86,439 86,439 68,517 68,517 66,356 66,356 71,914 202 72,116 Other (4) $ 122 $ - $ 122 $ 66 $ - $ 66 $ (14) $ - $ (14) $ 67 $ - $ 67 $ 3$ - $ 3 Revenue by Geography: Americas (5) $ 2,840,450 $ 35,496 $ 2,875,946 $ 729,747 $ 4,711 $ 734,458 $ 720,492 $ 6,831 $ 727,323 $ 696,367 $ 9,071 $ 705,438 $ 693,844 $ 14,883 $ 708,727 EMEA 1,644,295 13,245 1,657,540 442,394 2,340 444,734 417,931 2,988 420,919 386,422 3,166 389,588 397,548 4,751 402,299 $ 714,621 $ 4,557 $ 719,178 $ 185,076 $ 514 $ 185,590 $ 177,450 $ 649 $ 178,099 $ 177,619 $ 747 $ 178,366 $ 174,476 $ 2,647 $ 177,123 Asia Pacific/Japan $ 2,560,194 $ 33,403 $ 2,593,597 $ 654,748 $ 4,401 $ 659,149 $ 650,721 $ 6,467 $ 657,188 $ 628,614 $ 8,659 $ 637,273 $ 626,111 $ 13,876 $ 639,987 Total U.S. Revenue $ 2,639,172 $ 19,895 $ 2,659,067 $ 702,469 $ 3,164 $ 705,633 $ 665,152 $ 4,001 $ 669,153 $ 631,794 $ 4,325 $ 636,119 $ 639,757 $ 8,405 $ 648,162 Total International Revenue We include certain non-GAAP revenue and deferred revenue components in the tracking and forecasting of our revenue and management of our business. This includes non-GAAP revenue associated with deferred revenue that was excluded as a result of purchase accounting adjustments related to acquisitions. We believe the non-GAAP revenue measures set forth above are useful to investors, and such items are used by our management, because this revenue is reflective of our ongoing operating results. (1) We adopted Staff Accounting Bulletin No. 108, “Considering the Effects of Prior Year Misstatements when Quantifying Misstatements in Current Year Financial Statements,” or SAB 108, in fiscal year ended March 2007, and our results for the three and nine months ended December 2006 include the adoption of SAB 108. See item 15, quot;Summary of Significant Accounting Policiesquot; in our March 2007 10-K for a detailed explanation of the impact of our adoption of SAB 108. (2) We have completed numerous business combinations and acquisitions for a variety of strategic purposes over the past several years. As is the case with our existing business, at the time of acquisition, acquired business had recorded deferred revenue related to past transactions for which revenue would be recognized in future periods as revenue recognition criteria are satisfied. The purchase accounting entries for these acquisitions require us to write down a portion of this deferred revenue to its then current fair value. Consequently, in post acquisition periods, we do not recognize the full amount of this deferred revenue. When measuring the performance of our business, however, we add back non-GAAP revenue associated with certain types of deferred revenue that were excluded as a result of these purchase accounting adjustments, as we believe that this provides information about the operating impact of the acquired businesses in a manner consistent with the revenue recognition for our for our pre-existing products and services. We believe that the inclusion of this revenue provides useful information to our management as well as to investors. (3) Following our ERP system implementation in the December 2006 quarter, we completed an analysis of the allocation of maintenance revenues across our enterprise segments. Accordingly, we have recast maintenance revenues for these segments for each quarter of fiscal 2007. This recast primarily affected our Data Center Management and Security and Data Management segments. In addition, during the June 2007 quarter, we added a new business segment called Altiris consisting of the Altiris products and our Ghost, pcAnywhere, and LiveState Delivery products, which moved from the Security and Data Management segment. We also moved our Managed Security Services and DeepSight products to the Services segment from the Security and Data Management segment. During the September 2007 quarter, we recast certain amounts from the Services segment to the Security and Data Management segment. (4) Other includes divested product lines and/or product lines nearing the end of their life cycle. See item 15, Footnote 15 in our March 2007 10-K. (5) The Americas includes the United States, Latin America, and Canada. 4
  • 5. Symantec Corporation GAAP Statements of Operations (In thousands, except per share data) (Unaudited) Fiscal (4) Quarter Ended (4) Quarter Ended (4) Quarter Ended (4) Quarter Ended (4) Fiscal YTD Quarter Ended Quarter Ended Quarter Ended 2008 31-Dec-07 30-Sep-07 30-Jun-07 2007 31-Mar-07 31-Dec-06 30-Sep-06 30-Jun-06 Net revenues: Content, subscriptions, and maintenance $ 3,371,126 $ 1,167,443 $ 1,117,165 $ 1,086,518 $ 3,917,796 $ 1,051,336 $ 993,889 $ 955,025 $ 917,546 Licenses 963,552 347,808 301,924 313,820 1,281,570 305,881 321,984 305,383 348,322 Total net revenues 4,334,678 1,515,251 1,419,089 1,400,338 5,199,366 1,357,217 1,315,873 1,260,408 1,265,868 Cost of revenues: Content, subscriptions, and maintenance 619,593 204,355 205,572 209,666 823,525 210,888 213,977 203,524 195,136 Licenses 31,434 10,304 9,892 11,238 49,968 10,502 12,015 11,539 15,912 Amortization of acquired product rights 262,924 84,502 89,062 89,360 342,333 84,873 84,511 85,338 87,611 Total cost of revenues 913,951 299,161 304,526 310,264 1,215,826 306,263 310,503 300,401 298,659 Gross Profit 3,420,727 1,216,090 1,114,563 1,090,074 3,983,540 1,050,954 1,005,370 960,007 967,209 Operating expenses: Sales and marketing 1,791,672 627,980 595,162 568,530 2,007,649 575,544 500,067 464,589 467,449 Research and development (1) 671,928 225,293 221,057 225,578 866,884 218,470 216,969 218,250 213,195 General and administrative 254,850 82,600 86,405 85,845 316,783 79,266 78,820 80,076 78,621 Amortization of other purchased intangible assets 168,847 54,996 56,926 56,925 201,502 49,932 50,476 50,480 50,614 Restructuring 51,883 23,305 9,578 19,000 70,236 50,758 - 6,220 13,258 Integration - - - - 744 744 - - - Write-down of assets (2) 92,688 6,142 86,546 - - - - - - Total operating expenses 3,031,868 1,020,316 1,055,674 955,878 3,463,798 974,714 846,332 819,615 823,137 Operating income (loss) 388,859 195,774 58,889 134,196 519,742 76,240 159,038 140,392 144,072 Interest income 59,997 19,997 19,179 20,821 122,041 30,501 28,741 34,983 27,816 Interest expense (20,385) (7,477) (6,617) (6,291) (27,232) (6,245) (6,257) (8,052) (6,678) Other income (expense), net 883 (2,348) 1,965 1,266 17,069 5,567 (3,897) 15,581 (182) Income (loss) before income taxes 429,354 205,946 73,416 149,992 631,620 106,063 177,625 182,904 165,028 Provision for income taxes 151,890 74,056 23,048 54,786 227,239 45,168 60,855 56,722 64,494 Net income (loss) $ 277,464 $ 131,890 $ 50,368 $ 95,206 $ 404,381 $ 60,895 $ 116,770 $ 126,182 $ 100,534 Net income (loss) per share - diluted $ 0.31 $ 0.15 $ 0.06 $ 0.10 $ 0.41 $ 0.07 $ 0.12 $ 0.13 $ 0.10 876,221 892,759 Shares used to compute net income (loss) per share - diluted 893,794 910,302 983,261 932,985 963,309 987,916 1,048,833 Symantec Corporation Non-GAAP Statements of Operations (3) (In thousands, except per share data) (Unaudited) Fiscal (4) Quarter Ended (4) Quarter Ended (4) Quarter Ended (4) Quarter Ended (4) Fiscal YTD Quarter Ended Quarter Ended Quarter Ended 2008 31-Dec-07 30-Sep-07 30-Jun-07 2007 31-Mar-07 31-Dec-06 30-Sep-06 30-Jun-06 Net revenues $ 4,389,202 $ 1,529,026 $ 1,437,332 $ 1,422,844 $ 5,252,664 $ 1,364,782 $ 1,326,341 $ 1,273,392 $ 1,288,149 Cost of revenues 638,252 210,780 210,964 216,508 857,053 217,936 222,172 209,879 207,066 Gross profit 3,750,950 1,318,246 1,226,368 1,206,336 4,395,611 1,146,846 1,104,169 1,063,513 1,081,083 Operating expenses: Sales and marketing 1,747,781 613,857 580,736 553,188 1,950,204 563,459 487,210 446,947 452,588 Research and development 626,898 209,579 206,056 211,263 807,950 206,148 202,607 200,963 198,232 General and administrative 230,211 75,272 78,028 76,911 291,767 72,036 72,844 73,293 73,594 Total operating expenses 2,604,890 898,708 864,820 841,362 3,049,921 841,643 762,661 721,203 724,414 Operating income 1,146,060 419,538 361,548 364,974 1,345,690 305,203 341,508 342,310 356,669 Interest income 59,997 19,997 19,179 20,821 122,041 30,501 28,741 34,983 27,816 Interest expense (20,385) (7,477) (6,617) (6,291) (27,232) (6,245) (6,257) (8,052) (6,678) Other income (expense), net (2,394) (5,626) 1,966 1,266 (2,919) 2,347 (3,897) (1,187) (182) Income before income taxes 1,183,278 426,432 376,076 380,770 1,437,580 331,806 360,095 368,054 377,625 Provision for income taxes 366,196 134,684 113,440 118,072 445,102 105,038 109,289 106,592 124,183 Net income $ 817,082 $ 291,748 $ 262,636 $ 262,698 $ 992,478 $ 226,768 $ 250,806 $ 261,462 $ 253,442 Net income per share - diluted $ 0.91 $ 0.33 $ 0.29 $ 0.29 $ 1.01 $ 0.24 $ 0.26 $ 0.26 $ 0.24 876,221 Shares used to compute net income per share - diluted 893,794 892,759 910,302 983,261 932,985 963,309 987,916 1,048,833 The above information reflects the financial results of Symantec Corporation. Symantec acquired Altiris Inc. on April 6, 2007. The results of operations of Altiris have been included in the Symantec results of operations since that date. (1) During the December 2007 quarter, we recorded a $1 million write-down to a research and development facility classified as held for sale. (2) Write-down of assets. During the September 2007 quarter, management determined that certain tangible and intangible assets and liabilities of the Data Center Management segment did not meet the long term strategic objectives of the segment, and we recorded a write-down of $87 million to value these assets and liabilities at the respective estimated fair value. We adjusted this amount to $93 million in the December 2007 quarter. On January 10, 2008 we signed an agreement to sell these assets. 3) The method we use to produce non-GAAP results is not computed according to GAAP and may differ from the methods used by other companies. Our non-GAAP results are not meant to be considered in isolation or as a substitute for comparable GAAP measures and should be read only in conjunction with our condensed consolidated financial statements prepared in accordance with GAAP. (4) We adopted Staff Accounting Bulletin No. 108, “Considering the Effects of Prior Year Misstatements when Quantifying Misstatements in Current Year Financial Statements,” or SAB 108, in fiscal year ended March 2007, and our results for the three and nine months ended December 2006 include the adoption of SAB 108. See item 15, quot;Summary of Significant Accounting Policiesquot; in our March 2007 10-K for a detailed explanation of the impact of our adoption of SAB 108. 5
  • 6. Symantec Corporation Reconciliation of Non-GAAP Adjustments Statements of Operations (In thousands, except per share data) (Unaudited) Fiscal (10) Quarter Ended (10) Quarter Ended (10) Quarter Ended (10) Quarter Ended (10) Fiscal YTD Quarter Ended Quarter Ended Quarter Ended 2008 31-Dec-07 30-Sep-07 30-Jun-07 2007 31-Mar-07 31-Dec-06 30-Sep-06 30-Jun-06 NET REVENUES: GAAP net revenues $ 4,334,678 $ 1,515,251 $ 1,419,089 $ 1,400,338 $ 5,199,366 $ 1,357,217 $ 1,315,873 $ 1,260,408 $ 1,265,868 Deferred revenue related to acquisitions(1) 54,524 13,775 18,243 22,506 53,298 7,565 10,468 12,984 22,281 Non-GAAP net revenues $ 4,389,202 $ 1,529,026 $ 1,437,332 $ 1,422,844 $ 5,252,664 $ 1,364,782 $ 1,326,341 $ 1,273,392 $ 1,288,149 GROSS PROFIT: GAAP gross profit $ 3,420,727 $ 1,216,090 $ 1,114,563 $ 1,090,074 $ 3,983,540 $ 1,050,954 $ 1,005,370 $ 960,007 $ 967,209 Deferred revenue related to acquisitions(1) 54,524 13,775 18,243 22,506 53,298 7,565 10,468 12,984 22,281 (2) Amortization of acquired product rights 262,925 84,502 89,063 89,360 342,335 84,873 84,512 85,339 87,611 (4) Stock-based compensation 12,774 3,879 4,499 4,396 16,438 3,454 3,819 5,183 3,982 Gross profit adjustment 330,223 102,156 111,805 116,262 412,071 95,892 98,799 103,506 113,874 Non-GAAP gross profit $ 3,750,950 $ 1,318,246 $ 1,226,368 $ 1,206,336 $ 4,395,611 $ 1,146,846 $ 1,104,169 $ 1,063,513 $ 1,081,083 OPERATING EXPENSES: GAAP operating expenses $ 3,031,868 $ 1,020,316 $ 1,055,674 $ 955,878 $ 3,463,798 $ 974,714 $ 846,332 $ 819,615 $ 823,137 Executive incentive bonuses (3) (3,540) (424) (1,314) (1,802) (3,951) 3 (897) (1,083) (1,974) Stock-based compensation (4) (108,379) (35,541) (36,490) (36,348) (137,443) (31,640) (32,298) (40,628) (32,877) Restructuring (5) (51,883) (23,305) (9,578) (19,000) (70,236) (50,758) - (6,220) (13,258) Integration (6) (441) - - (441) (744) (744) - - - (7) Write-down of assets (93,888) (7,342) (86,546) - - - - - - (2) Amortization of other intangible assets (168,847) (54,996) (56,926) (56,925) (201,503) (49,932) (50,476) (50,481) (50,614) Operating expense adjustment (426,978) (121,608) (190,854) (114,516) (413,877) (133,071) (83,671) (98,412) (98,723) Non-GAAP operating expenses $ 2,604,890 $ 898,708 $ 864,820 $ 841,362 $ 3,049,921 $ 841,643 $ 762,661 $ 721,203 $ 724,414 OPERATING INCOME: GAAP operating income (loss) $ 388,859 $ 195,774 $ 58,889 $ 134,196 $ 519,742 $ 76,240 $ 159,038 $ 140,392 $ 144,072 Gross profit adjustment 330,223 102,156 111,805 116,262 412,071 95,892 98,799 103,506 113,874 Operating expense adjustment 426,978 121,608 190,854 114,516 413,877 133,071 83,671 98,412 98,723 Non-GAAP operating income $ 1,146,060 $ 419,538 $ 361,548 $ 364,974 $ 1,345,690 $ 305,203 $ 341,508 $ 342,310 $ 356,669 NET INCOME (LOSS): GAAP net income (loss) $ 277,464 $ 131,890 $ 50,368 $ 95,206 $ 404,381 $ 60,895 $ 116,770 $ 126,182 $ 100,534 Gross profit adjustment 330,223 102,156 111,805 116,262 412,071 95,892 98,799 103,506 113,874 Operating expense adjustment 426,978 121,608 190,854 114,516 413,877 133,071 83,671 98,412 98,723 Income tax effect on above items (8) (214,306) (60,629) (90,391) (63,286) (217,863) (59,870) (48,434) (49,870) (59,689) Gain on sale of assets (9) (3,277) (3,277) - - (19,988) (3,220) - (16,768) - Non-GAAP net income $ 817,082 $ 291,748 $ 262,636 $ 262,698 $ 992,478 $ 226,768 $ 250,806 $ 261,462 $ 253,442 NET INCOME (LOSS) PER SHARE - DILUTED: GAAP net income (loss) per share $ 0.31 $ 0.15 $ 0.06 $ 0.10 $ 0.41 $ 0.07 $ 0.12 $ 0.13 $ 0.10 Stock-based compensation adjustment per share, net of tax (4) 0.11 0.04 0.04 0.04 0.12 0.03 0.03 0.04 0.03 (1-3, 5-6) Other non-GAAP adjustments per share, net of tax 0.49 0.14 0.19 0.15 0.48 0.14 0.11 0.09 0.11 Non-GAAP net income per share $ 0.91 $ 0.33 $ 0.29 $ 0.29 $ 1.01 $ 0.24 $ 0.26 $ 0.26 $ 0.24 SHARES USED TO COMPUTE NET INCOME (LOSS) PER SHARE - DILUTED: GAAP shares used to compute net income (loss) per share 893,794 876,221 892,759 910,302 983,261 932,985 963,309 987,916 1,048,833 (see notes on following page) 6
  • 7. The information included in the Reconciliation of Non-GAAP Adjustments table reflects the financial results of Symantec Corporation. Symantec acquired Altiris Inc. on April 6, 2007. The results of operations of Altiris have been included in the Symantec results of operations since that date. The method we use to produce non-GAAP results is not computed according to GAAP and may differ from the methods used by other companies. Our non-GAAP results are not meant to be considered in isolation or as a substitute for comparable GAAP measures and should be read only in conjunction with our consolidated condensed financial statements prepared in accordance with GAAP. The non-GAAP financial measures included in the tables above are non-GAAP net revenues, non-GAAP net income and non-GAAP net income per share, which adjust for the following items: business combination accounting entries, expenses related to acquisitions, stock-based compensation expense, restructuring charges and charges related to the amortization of intangible assets, write-downs of intangible assets and certain other items. We believe the presentation of these non-GAAP financial measures, when taken together with the corresponding GAAP financial measures, provides meaningful supplemental information regarding the Company's operating performance for the reasons discussed below. Our management uses these non-GAAP financial measures in assessing the Company's operating results, as well as when planning, forecasting and analyzing future periods. We believe that these non-GAAP financial measures also facilitate comparisons of the Company's performance to prior periods and to our peers and that investors benefit from an understanding of these non-GAAP financial measures. (1) Fair value adjustment to deferred revenue. We have completed numerous business combinations and acquisitions for a variety of strategic purposes over the past several years. As is the case with our existing business, at the time of acquisition, acquired businesses recorded deferred revenue related to past transactions for which revenue would be recognized in future periods as revenue recognition criteria are satisfied. The purchase accounting entries for these acquisitions require us to write down a portion of this deferred revenue to its then current fair value. Consequently, in post acquisition periods, we do not recognize the full amount of this deferred revenue. When measuring the performance of our business, however, we add back non-GAAP revenue associated with certain types of deferred revenue that were excluded as a result of these purchase accounting adjustments, as we believe that this provides information about the operating impact of the acquired businesses in a manner consistent with the revenue recognition for our for our pre-existing products and services. We believe that the inclusion of this revenue provides useful information to our management as well as to investors. (2) Amortization of acquired product rights and other intangible assets. When conducting internal development of intangible assets, accounting rules require that we expense the costs as incurred. In the case of acquired businesses, however, we are required to allocate a portion of the purchase price to the accounting value assigned to intangible assets acquired and amortize this amount over the estimated useful lives of the acquired intangibles. The acquired company, in most cases, has itself previously expensed the costs incurred to develop the acquired intangible assets, and the purchase price allocated to these assets is not necessarily reflective of the cost we would incur in developing the intangible asset. We eliminate this amortization charge from our non-GAAP operating results to provide better comparability of pre and post-acquisition operating results and comparability to results of businesses utilizing internally developed intangible assets. (3) Executive incentive bonuses. We have excluded bonuses related to acquisitions and executive sign-on bonuses for newly hired executives. We expect the benefit from these hires and retentions to extend over an indeterminate future period, but under GAAP we are required to expense the entire cost of the bonus in the period paid. We exclude these amounts to provide better comparability of the periods that include and do not include these charges. We believe that investors benefit from an understanding of our operating results for the periods presented without giving effect to these charges. (4) Stock-based compensation. Consists of expenses for employee stock options, restricted stock units, restricted stock awards and our employee stock purchase plan determined in accordance with Statement of Financial Accounting Standards Number 123(R), or SFAS 123(R). When evaluating the performance of our individual business units and developing short and long term plans, we do not consider stock-based compensation charges. Our management team is held accountable for cash-based compensation, but we believe that management is limited in its ability to project the impact of stock-based compensation, and accordingly, is not held accountable for its impact on our operating results. Although stock-based compensation is necessary to attract and retain quality employees, our consideration of stock based compensation places its primary emphasis on overall shareholder dilution rather than the accounting charges associated with such grants. In addition, for comparability purposes, we believe it is useful to provide a non-GAAP financial measure that excludes stock-based compensation in order to better understand the long-term performance of our core business and to facilitate the comparison of our results to the results of our peer companies. Furthermore, unlike cash compensation, the value of stock-based compensation is determined using a complex formula that incorporates factors, such as market volatility, that are beyond our control. Further, we believe it is useful to investors to understand the impact of SFAS 123(R) to our results of operations. For the three months and nine months ended December 31, 2007 and December 31, 2006, stock-based compensation was allocated as follows: Three Months Ended Nine Months Ended December 31, December 31, 2007 2007 2006 2006 Cost of revenues $ 3,879 $ 3,819 $ 12,774 $ 12,984 Sales and marketing 14,013 12,520 42,433 43,771 Research and development 14,431 13,803 43,439 44,847 General and administrative 7,097 5,975 22,507 17,185 Total stock-based compensation $ 39,420 $ 36,117 $ 121,153 $ 118,787 (5) Restructuring. We have engaged in various restructuring activities over the past several years that have resulted in costs associated with severance, benefits, outplacement services, and excess facilities. Each restructuring has been a discrete event based on a unique set of business objectives or circumstances, and each has differed from the others in terms of its operational implementation, business impact and scope. We do not engage in restructuring activities in the ordinary course of business. While our operations previously benefited from the employees and facilities covered by our various restructuring charges, these charges have benefited different parts of our business in different ways and the amount of these charges has varied significantly from period to period. We believe that it is important to understand these charges; however, we do not believe that these charges are indicative of future operating results and that investors benefit from an understanding of our operating results without giving effect to them. (6) Integration. These charges consist of expenses incurred for consulting services and other professional fees associated with integration activities of acquisitions. Because these expenses are non-recurring and unique to specific acquisitions, we believe they are not indicative of future operating results and that investors benefit from an understanding of our operating results without giving effect to them. (7) Write-down of assets. During the September 2007 quarter, management determined that certain tangible and intangible assets and liabilities of the Data Center Management segment did not meet the long term strategic objectives of the segment and we recorded a write-down of $87 million to value these assets and liabilities at the respective estimated fair value. We adjusted this amount to $93 million in the December 2007 quarter. On January 10, 2008 we signed an agreement to sell these assets. During the December 2007 quarter, we also recorded a $1 million write-down on a facility classified as held for sale. On January 10, 2008 we signed an agreement to sell these assets. (8) Income tax effect on above items. This amount adjusts the provision for income taxes to reflect the effect of the non-GAAP adjustments on non-GAAP operating income. (9) Gain on sale of assets. We exclude these gains because each is a unique one-time occurrence that is not closely related to or a function of our ongoing operations. (10) We adopted Staff Accounting Bulletin No. 108, “Considering the Effects of Prior Year Misstatements when Quantifying Misstatements in Current Year Financial Statements,” or SAB 108, in fiscal year ended March 2007, and our results for the three and nine months ended December 2006 include the adoption of SAB 108. See item 15, quot;Summary of Significant Accounting Policiesquot; in our March 2007 10-K for a detailed explanation of the impact of our adoption of SAB 108. 7
  • 8. SYMANTEC CORPORATION Condensed Consolidated Balance Sheets (In thousands) (Unaudited) December 31, September 30, June 30, March 31, December 31, September 30, June 30, (3) (3) (3) (3) 2007 2006 2006 2006 2007 2007 2007 ASSETS Current assets: Cash and cash equivalents $ 1,484,489 $ 1,388,364 $ 1,374,049 $ 2,559,034 $ 2,592,003 $ 2,607,786 $ 3,685,517 Short-term investments 500,107 627,478 660,543 428,619 382,519 343,489 409,216 Trade accounts receivable, net 901,615 601,837 568,721 666,968 744,766 563,608 540,552 Inventories 34,591 32,735 34,666 42,183 43,804 43,010 42,830 Deferred income taxes 171,198 172,422 163,146 165,323 145,687 119,490 132,387 Other current assets (1)(2) 282,598 206,840 279,828 208,920 205,205 189,787 191,836 Total current assets 3,374,598 3,029,676 3,080,953 4,071,047 4,113,984 3,867,170 5,002,338 1,039,510 1,125,560 1,113,315 1,092,240 1,114,018 1,062,354 1,098,629 Property and equipment, net 733,278 788,884 925,595 909,878 992,638 1,067,766 1,150,352 Acquired product rights, net 1,299,083 1,315,003 1,411,713 1,245,638 1,295,445 1,339,779 1,390,258 Other intangible assets, net 11,208,960 10,948,364 10,969,774 10,340,348 10,344,055 10,326,629 10,329,888 Goodwill 53,661 59,264 62,959 63,987 65,601 66,462 59,272 Other long-term assets 58,455 49,998 57,300 27,732 28,547 14,868 11,552 Long-term deferred income tax Total assets $ 17,767,545 $ 17,316,749 $ 17,621,609 $ 17,750,870 $ 17,954,288 $ 17,745,028 $ 19,042,289 LIABILITIES AND STOCKHOLDERS’ EQUITY Current liabilities: Accounts payable $ 162,871 $ 169,422 $ 165,715 $ 149,131 $ 198,622 $ 166,844 $ 161,938 Accrued compensation and benefits 410,171 324,236 307,202 307,824 298,286 263,415 258,697 Current deferred revenue 2,497,697 2,265,575 2,330,411 2,387,733 2,199,844 1,990,193 2,021,949 Income taxes payable 78,997 40,520 13,056 238,486 338,049 260,183 360,681 Short-term borrowing 200,000 - - - - - - Other current liabilities (1) 231,686 191,500 224,416 234,915 182,760 169,515 170,572 Short-term convertible debentures - - - - - - 518,200 Total current liabilities 3,581,422 2,991,253 3,040,800 3,318,089 3,217,561 2,850,150 3,492,037 Convertible senior notes 2,100,000 2,100,000 2,100,000 2,100,000 2,100,000 2,100,000 2,100,000 Long-term deferred revenue 379,476 333,022 334,364 366,050 359,357 335,162 283,385 Long-term deferred tax liabilities 219,778 277,041 358,010 343,848 226,864 244,324 233,230 Long-term income taxes payable 459,126 424,595 414,322 - Other long-term obligations 98,662 85,419 38,647 21,370 22,118 21,470 26,320 Total Liabilities 6,838,464 6,211,330 6,286,143 6,149,357 5,925,900 5,551,106 6,134,972 Stockholders’ equity: Common stock 8,452 8,650 8,813 8,994 9,275 9,413 9,875 Capital in excess of par value 9,207,367 9,495,987 9,740,361 10,061,144 10,511,659 10,759,857 11,552,839 Accumulated other comprehensive income 199,488 195,814 189,725 182,933 184,479 174,900 172,651 Retained earnings 1,513,774 1,404,968 1,396,567 1,348,442 1,322,975 1,249,752 1,171,952 Total stockholders’ equity 10,929,081 11,105,419 11,335,466 11,601,513 12,028,388 12,193,922 12,907,317 Total liabilities and stockholders' equity $ 17,767,545 $ 17,316,749 $ 17,621,609 $ 17,750,870 $ 17,954,288 $ 17,745,028 $ 19,042,289 The above information reflects the financial results of Symantec Corporation. Symantec acquired Altiris Inc. on April 6, 2007. The results of operations of Altiris have been included in the Symantec results of operations since that date. (1) During the September 2007 quarter, management determined that certain tangible and intangible assets and liabilities of the Data Center Management segment did not meet the long term strategic objectives of the segment, and we recorded a write-down of $87 million to value these assets and liabilities at the respective estimated fair value. We adjusted this amount to $93 million in the December 2007 quarter. The fair value of these assets, totaling $7 million, is included in Other current assets and liabilities of $3 million are included in Other current liabilities. On January 10, 2008 we signed an agreement to sell these assets. (2) During the December 2007 quarter, following a review of our real estate holdings, we classified certain long-term assets as held for sale. We reclassed the assets, totaling $109 million, to Other current assets, and expect to complete the sale of these assets by the end of the first quarter of fiscal 2009. (3) We adopted Staff Accounting Bulletin No. 108, “Considering the Effects of Prior Year Misstatements when Quantifying Misstatements in Current Year Financial Statements,” or SAB 108, in fiscal year ended March 2007, and our results for the three and nine months ended December 2006 include the adoption of SAB 108. See item 15, quot;Summary of Significant Accounting Policiesquot; in our March 2007 10-K for a detailed explanation of the impact of our adoption of SAB 108. 8
  • 9. Symantec Corporation Trended Cash Flow Statements (In thousands) (Unaudited) Fiscal (1) Quarter Ended (1) Quarter Ended (1) Quarter Ended (1) Quarter Ended (1) Fiscal YTD Quarter Ended Quarter Ended Quarter Ended 2008 31-Dec-07 30-Sep-07 30-Jun-07 2007 31-Mar-07 31-Dec-06 30-Sep-06 30-Jun-06 OPERATING ACTIVITIES: Net income $ 277,464 $ 131,890 $ 50,368 $ 95,206 $ 404,381 $ 60,895 $ 116,770 $ 126,182 $ 100,534 Adjustments to reconcile net income to net cash provided by operating activities Depreciation and amortization of property and equipment 191,170 63,481 61,034 66,655 255,129 64,014 64,734 62,859 63,522 Amortization 427,234 137,430 143,014 146,790 556,314 137,953 136,248 138,759 143,354 Stock−based compensation expense 121,151 39,417 40,991 40,743 153,880 35,134 36,117 45,770 36,859 Impairment of equity investments - - - - 2,841 - - - 2,841 Write-down of assets(2) 93,888 7,342 86,546 - - - - - - Fixed Assets & Intangibles Write-off - - - - 912 (302) 1,358 (144) - Deferred income taxes (178,647) (74,747) (78,781) (25,119) 11,173 90,240 (61,945) 20,211 (37,333) Income tax benefit from stock options 27,730 10,462 7,405 9,863 43,118 17,477 14,798 5,705 5,138 Excess income tax benefit from stock options (18,307) (4,778) (4,485) (9,044) (25,539) (5,951) (13,694) (4,001) (1,893) (Gain) loss on sale of property and equipment 3,253 177 3,076 - (19,937) (3,221) - (16,716) - Other - - 260 (260) - - - 500 (500) Net change in assets and liabilities, excluding effects of acquisitions: Trade accounts receivable, net (165,392) (284,378) (22,405) 141,391 33,714 81,169 (167,072) (24,449) 144,066 Inventories 9,224 (1,273) 2,791 7,706 10,324 1,982 185 (313) 8,470 Accounts payable (13,249) (20,896) (5,035) 12,682 (25,624) (50,697) 39,087 2,737 (16,751) Accrued compensation and benefits 83,794 84,212 16,062 (16,480) 23,169 11,091 28,821 6,097 (22,840) Deferred revenue 9,466 238,479 (119,009) (110,004) 399,517 177,989 198,900 26,634 (4,006) Income taxes payable 215,462 84,026 112,044 19,392 (181,926) (94,702) 70,223 (97,362) (60,085) Other operating assets and liabilities 60,042 51,161 37,093 (28,212) 24,789 43,913 (10,159) (15,829) 6,864 Net cash provided by operating activities 1,144,283 462,005 330,969 351,309 1,666,235 566,984 454,371 276,640 368,240 INVESTING ACTIVITIES: Capital expenditures (209,129) (71,100) (63,341) (74,688) (419,749) (70,154) (113,108) (89,413) (147,074) Proceeds from sale of property and equipment - - (903) 903 121,464 34,560 - 86,904 - Proceeds from sale of Intangible assets - - - - - - - - - Purchase of intangible assets - - - (13,300) - (13,300) - - Payments for business acquisitions, net of cash and cash equivalents acquired (1,150,683) (298,397) (11,718) (840,568) (33,373) (8,358) (20,425) (2,944) (1,646) Purchase of equity investments - - - - - - - - - Proceeds from sale of equity investments - - - - - - - - - Purchases of available-for-sale securities (825,104) (184,534) (340,039) (300,531) (226,905) (97,339) (87,074) (29,809) (12,683) Proceeds from sales of available-for-sale securities 830,903 332,517 394,775 103,611 349,408 53,950 49,490 98,703 147,265 Net cash (used in) provided by investing activities (1,354,013) (1,111,273) (222,455) (87,341) (184,417) 63,441 (14,138) (221,514) (21,226) FINANCING ACTIVITIES: Sale of common stock warrants - - - - 326,102 - - - 326,102 Repurchase of common stock (1,299,976) (399,992) (399,989) (499,995) (2,846,312) (594,998) (384,996) (974,958) (891,360) Net proceeds from sales of common stock under employee stock benefit plans 164,162 33,942 68,057 62,163 230,295 61,039 51,274 77,501 40,481 Proceeds from debt issuance - - - - 2,067,299 (463) - - 2,067,762 Purchase of bond hedge - - - - (592,490) - - - (592,490) Proceeds from short-term borrowing 200,000 200,000 - - - - - - - Income tax benefit reclassed from operations 18,307 4,778 4,485 9,044 25,539 5,951 13,694 4,001 1,893 Repayment of long term liability (9,913) (2,309) (2,271) (5,333) (520,000) - - (520,000) - Restricted stock issuance (3,742) (692) (111) (2,939) - - - - - Net cash (used in) provided by financing activities (931,162) (437,060) (1,309,567) (528,471) (320,028) (1,413,456) 952,388 (164,273) (329,829) Effect of exchange rate fluctuations on cash and cash equivalents 66,347 19,907 34,401 12,039 109,199 15,859 34,291 (4,356) 63,405 (Decrease) increase in cash and cash equivalents (1,074,545) 96,125 14,315 (1,184,985) 243,412 (32,969) (15,783) (1,077,731) 1,369,895 Beginning cash and cash equivalents 2,559,034 1,388,364 1,374,049 2,559,034 2,315,622 2,592,003 2,607,786 3,685,517 2,315,622 Ending cash and cash equivalents 1,484,489 1,484,489 1,388,364 1,374,049 2,559,034 2,559,034 2,592,003 2,607,786 3,685,517 The above information reflects the financial results of Symantec Corporation. Symantec acquired Altiris Inc. on April 6, 2007. The results of operations of Altiris have been included in the Symantec results of operations since that date. (1) We adopted Staff Accounting Bulletin No. 108, “Considering the Effects of Prior Year Misstatements when Quantifying Misstatements in Current Year Financial Statements,” or SAB 108, in fiscal year ended March 2007, and our results for the three and nine months ended December 2006 include the adoption of SAB 108. See item 15, quot;Summary of Significant Accounting Policiesquot; in our March 2007 10-K for a detailed explanation of the impact of our adoption of SAB 108. (2) During the September 2007 quarter, management determined that certain tangible and intangible assets and liabilities of the Data Center Management segment did not meet the long term strategic objectives of the segment, and we recorded a write-down of $87 million to value these assets and liabilities at the respective estimated fair value. We adjusted this amount to $93 million in the December 2007 quarter. On January 10, 2008 we signed an agreement to sell these assets. During the December 2007 quarter we also recorded a $1 million write-down on a facility classified as held for sale. 9
  • 10. SYMANTEC CORPORATION Reconciliation of GAAP Deferred Revenue to Non-GAAP Deferred Revenue (Unaudited) (In thousands) As of: December 31, 2007 Deferred revenue reconciliation GAAP deferred revenue $ 2,877,173 Add back: Deferred revenue related to acquisitions (1) 19,856 Non-GAAP deferred revenue $ 2,897,029 We include certain non-GAAP revenue and deferred revenue components in the tracking and forecasting of our revenue and management of our business. This includes non-GAAP revenue associated with deferred revenue that was excluded as a result of purchase accounting adjustments related to acquisitions. We believe the non-GAAP deferred revenue measures set forth above are useful to investors, and such items are used by our management, because this revenue is reflective of our ongoing operating results. (1) We have completed numerous business combinations and acquisitions for a variety of strategic purposes over the past several years. As is the case with our existing business, at the time of acquisition, these acquired businesses had recorded deferred revenue related to past transactions for which revenue would be recognized in future periods as revenue recognition criteria are satisfied. The purchase accounting entries for these acquisitions require us to write down a portion of this deferred revenue to its then current fair value. Consequently, in post acquisition periods, we do not recognize the full amount of this deferred revenue. When measuring the performance of our business, however, we add back non-GAAP revenue associated with certain types of deferred revenue that were excluded as a result of these purchase accounting adjustments, as we believe that this provides information about the operating impact of the acquired businesses in a manner consistent with the revenue recognition for our pre-existing products and services. We believe that the inclusion of this deferred revenue provides useful information to our management as well as to investors. 10