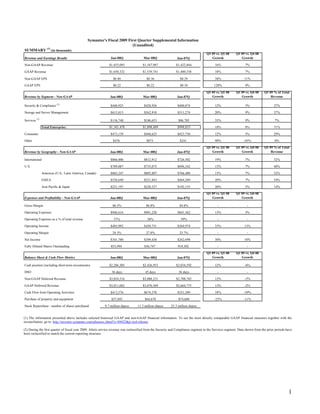
5. The non-GAAP financial measures included in the tables above are non-GAAP net revenues, non-GAAP net income and non-GAAP earnings per share, which adjust for the following items: business
combination accounting entries, stock-based compensation expense, restructuring charges, charges related to the amortization of intangible assets and acquired product rights, litigation settlements,
write-downs of assets and certain other items. We believe the presentation of these non-GAAP financial measures, when taken together with the corresponding GAAP financial measures, provides
meaningful supplemental information regarding the Company's operating performance for the reasons discussed below. Our management uses these non-GAAP financial measures in assessing the
Company's operating results, as well as when planning, forecasting and analyzing future periods. We believe that these non-GAAP financial measures also facilitate comparisons of the Company's
performance to prior periods and to our peers and that investors benefit from an understanding of these non-GAAP financial measures.
(1) Fair value adjustment to deferred revenue. We have completed several business combinations and acquisitions for a variety of strategic purposes over the past few years. As is the case with our
existing business, at the time of acquisition, these acquired businesses recorded deferred revenue related to past transactions for which revenue would be recognized in future periods as revenue
recognition criteria are satisfied. The purchase accounting entries for these acquisitions require us to write down a portion of this deferred revenue to its then current fair value. Consequently, in post
acquisition periods, we do not recognize the full amount of this deferred revenue. When measuring the performance of our business, however, we add back non-GAAP revenue associated with certain
types of deferred revenue that were excluded as a result of these purchase accounting adjustments, as we believe that this provides information about the operating impact of the acquired businesses in a
manner consistent with the revenue recognition for our pre-existing products and services. We believe that the inclusion of this revenue provides useful information to our management, as well as to
investors.
(2) Stock-based compensation. Consists of expenses for employee stock options, restricted stock units, restricted stock awards and our employee stock purchase plan determined in accordance with
Statement of Financial Accounting Standards Number 123(R), or SFAS 123(R). When evaluating the performance of our individual business units and developing short and long term plans, we do not
consider stock-based compensation charges. Our management team is held accountable for cash-based compensation, but we believe that management is limited in its ability to project the impact of
stock-based compensation and accordingly is not held accountable for its impact on our operating results. Although stock-based compensation is necessary to attract and retain quality employees, our
consideration of stock based compensation places its primary emphasis on overall shareholder dilution rather than the accounting charges associated with such grants. In addition, for comparability
purposes, we believe it is useful to provide a non-GAAP financial measure that excludes stock-based compensation in order to better understand the long-term performance of our core business and to
facilitate the comparison of our results to the results of our peer companies. Furthermore, unlike cash compensation, the value of stock-based compensation is determined using a complex formula that
incorporates factors, such as market volatility, that are beyond our control. Further, we believe it is useful to investors to understand the impact of SFAS 123(R) to our results of operations. For the
quarters ended July 4, 2008 and June 29, 2007, respectively, stock-based compensation was allocated as follows:
Three Months Ended
July 4, June 29,
2008 2007
Cost of revenues $ 3,636 $ 4,396
Sales and marketing 19,360 14,463
Research and development 13,127 14,167
General and administrative 8,724 7,718
Total stock based compensation $ 44,847 $ 40,744
(3) Amortization of acquired product rights and other intangible assets. When conducting internal development of intangible assets, accounting rules require that we expense the costs as incurred. In
the case of acquired businesses, however, we are required to allocate a portion of the purchase price to the accounting value assigned to intangible assets acquired and amortize this amount over the
estimated useful lives of the acquired intangibles. The acquired company, in most cases, has itself previously expensed the costs incurred to develop the acquired intangible assets, and the purchase
price allocated to these assets is not necessarily reflective of the cost we would incur in developing the intangible asset. Similarly, we adjust our share of the loss from unconsolidated entity for
amortization related to the intangible assets of the joint venture. We eliminate these amortization charges from our non-GAAP operating results to provide better comparability of pre and post-
acquisition operating results and comparability to results of businesses utilizing internally developed intangible assets.
(4) Restructuring. We have engaged in various restructuring activities over the past several years that have resulted in costs associated with severance, benefits, outplacement services, and excess
facilities. Each restructuring has been a discrete event based on a unique set of business objectives or circumstances, and each has differed from the others in terms of its operational implementation,
business impact and scope. We do not engage in restructuring activities in the ordinary course of business. While our operations previously benefited from the employees and facilities covered by our
various restructuring charges, these employees and facilities have benefited different parts of our business in different ways, and the amount of these charges has varied significantly from period to
period. We believe that it is important to understand these charges; however, we do not believe that these charges are indicative of future operating results and that investors benefit from an
understanding of our operating results without giving effect to them.
5
6. (5) Write-down of assets. During the December 2007 quarter, we recorded a $1.2 million write-down on a facility classified as held for sale. In the first quarter of fiscal year 2009, we reduced that write-down to
reflect current market conditions. We do not believe that these charges are indicative of future operating results and that investors benefit from an understanding of our operating results without giving effect
to them.
(6) Loss on sale of assets. During the September 2007 quarter, management determined that certain tangible and intangible assets and liabilities of the Storage and Server Management segment
(formally the Data Center Management segment) did not meet the long term strategic objectives of the segment, and we recorded a write-down in the value of these assets and liabilities to the respective
estimated fair value. On March 8, 2008 these assets were sold to a third party. We exclude these losses because each is a unique one-time occurrence that is not closely related to, or a function of, our
ongoing operations.
(7) Executive incentive bonuses. We have excluded bonuses related to acquisitions and executive sign-on bonuses for newly hired executives. We expect the benefit from these hires and retentions to
extend over an indeterminate future period, but under GAAP we are required to expense the entire cost of the bonus in the period paid. We exclude these amounts to provide better comparability of the
periods that include and do not include these charges. We believe that investors benefit from an understanding of our operating results for the periods presented without giving effect to these charges.
(8) Integration. These charges consist of expenses incurred for consulting services and other professional fees associated with integration activities of acquisitions. Because these expenses are non-
recurring and unique to specific acquisitions, we believe they are not indicative of future operating results and that investors benefit from an understanding of our operating results without giving effect
to them.
(9) Gain on sale of assets. We exclude these gains because each is a unique one-time occurrence that is not closely related to, or a function of, our ongoing operations.
(10) Settlements of litigation. This gain represents the net effect of a charge incurred from our settlements of litigation that was pending against Veritas when we acquired it in July 2005 and a gain from
our settlement of certain patent-related matters. We exclude the impact of these settlements because we do not consider the defense and prosecution of these pieces of litigation to be part of the ongoing
operation of our business and because of the singular nature of the claims underlying each matter.
(11) Income tax effect on above items. This amount adjusts the provision for income taxes to reflect the effect of the non-GAAP adjustments on non-GAAP net income -GAAP adjustments on non-
GAAP net income.
6
8. We include certain non-GAAP revenue and deferred revenue components in the tracking and forecasting of our revenue and management of our business. This includes non-GAAP revenue associated
with deferred revenue that was excluded as a result of purchase accounting adjustments related to acquisitions. We believe the non-GAAP revenue measures set forth above are useful to investors, and
such items are used by our management, because this revenue is reflective of our ongoing operating results.
(1) We have completed several business combinations and acquisitions for a variety of strategic purposes over the past few years. As is the case with our existing business, at the time of acquisition,
acquired business had recorded deferred revenue related to past transactions for which revenue would be recognized in future periods as revenue recognition criteria are satisfied. The purchase
accounting entries for these acquisitions require us to write down a portion of this deferred revenue to its then current fair value. Consequently, in post acquisition periods, we do not recognize the full
amount of this deferred revenue. When measuring the performance of our business, however, we add back non-GAAP revenue associated with certain types of deferred revenue that were excluded as a
result of these purchase accounting adjustments, as we believe that this provides information about the operating impact of the acquired businesses in a manner consistent with the revenue recognition
for our for our pre-existing products and services. We believe that the inclusion of this revenue provides useful information to our management, as well as to investors.
(2) During the first quarter of fiscal year 2009, Altiris service revenue was reclassified from the Security and Compliance segment to the Services segment. Data shown from the prior periods have been
reclassified to match the current reporting structure.
(3) The Americas includes the United States, Latin America, and Canada.
8
10. SYMANTEC CORPORATION
Reconciliation of GAAP deferred revenue
to Non-GAAP deferred revenue
(in thousands)
(Unaudited)
As of:
Jul 04, 2008 Mar 28, 2008 Dec 28, 2007 Sep 28, 2007 Jun 29, 2007 Mar 30, 2007 Dec 29, 2006 Sep 29, 2006 Jun 30, 2006
Deferred revenue reconciliation
GAAP deferred revenue $ 3,011,682 $ 3,076,569 $ 2,877,173 $ 2,598,597 $ 2,664,775 $ 2,753,783 $ 2,559,201 $ 2,325,355 $ 2,305,334
Add back:
Deferred revenue related to acquisitions (1) 12,834 11,662 19,856 25,888 44,007 17,958 25,448 22,263 35,247
Non-GAAP deferred revenue $ 3,024,516 $ 3,088,231 $ 2,897,029 $ 2,624,485 $ 2,708,782 $ 2,771,741 $ 2,584,649 $ 2,347,618 $ 2,340,581
We include certain non-GAAP revenue and deferred revenue components in the tracking and forecasting of our revenue and management of our business. This includes non-GAAP revenue associated
with deferred revenue that was excluded as a result of purchase accounting adjustments related to acquisitions. We believe the non-GAAP deferred revenue measures set forth above are useful to
investors, and such items are used by our management, because this revenue is reflective of our ongoing operating results.
(1) We have completed several business combinations and acquisitions for a variety of strategic purposes over the past few years. As is the case with our existing business, at the time of acquisition,
these acquired businesses had recorded deferred revenue related to past transactions for which revenue would be recognized in future periods as revenue recognition criteria are satisfied. The purchase
accounting entries for these acquisitions require us to write down a portion of this deferred revenue to its then current fair value. Consequently, in post acquisition periods, we do not recognize the full
amount of this deferred revenue. When measuring the performance of our business, however, we add back certain types of deferred revenue that were excluded as a result of these purchase accounting
adjustments, as we believe that this provides information about the operating impact of the acquired businesses in a manner consistent with the revenue recognition for our pre-existing products and
services. We believe that the inclusion of this deferred revenue provides useful information to our management, as well as to investors.
10
11. SYMANTEC CORPORATION
Trended Cash Flow Statements
(In thousands)
(Unaudited)
Three months ended Fiscal Three months ended Fiscal Three months ended
4-Jul-08 2008 28-Mar-08 28-Dec-07 28-Sep-07 29-Jun-07 2007 30-Mar-07 29-Dec-06 29-Sep-06 30-Jun-06
OPERATING ACTIVITIES: #REF! #REF!
Net income $ 186,692 $ 463,850 $ 186,386 $ 131,890 $ 50,368 $ 95,206 $ 404,380 $ 60,894 $ 116,770 $ 126,182 $ 100,534
Adjustments to reconcile net income to net cash provided by operating activities
Depreciation and amortization 200,056 824,109 205,705 200,911 204,048 213,445 811,443 201,967 200,982 201,618 206,876
Stock-based compensation expense 44,847 163,695 42,544 39,417 40,991 40,743 153,880 35,134 36,117 45,770 36,859
Impairment of equity investments - 1,000 1,000 - - - 2,841 - - - 2,841
Write-down of assets - 1,200 - 1,200 - - - - - - -
Deferred income taxes 14,717 (180,215) (1,568) (74,747) (78,781) (25,119) 11,173 90,240 (61,945) 20,211 (37,333)
Income tax benefit from the exercise of stock options 9,945 29,443 1,713 10,462 7,405 9,863 43,118 17,477 14,798 5,705 5,138
Excess income tax benefit from the exercise of stock options (9,033) (26,151) (7,844) (4,778) (4,485) (9,044) (25,539) (5,951) (13,694) (4,001) (1,893)
Loss (gain) on sale of assets - 97,463 1,522 6,319 89,622 - (19,937) (3,221) - (16,716) -
Net (gain) on settlements of litigation - (58,500) (58,500) - - - - - - - -
Loss from unconsolidated entity 6,181 - - - - - - - - - -
Other 6,160 (894) (894) - 260 (260) 912 (302) 1,358 356 (500)
Net change in assets and liabilities, excluding effects of acquisitions:
Trade accounts receivable, net 118,885 (7,002) 158,390 (284,378) (22,405) 141,391 33,714 81,169 (167,072) (24,449) 144,066
Inventories 5,824 10,791 1,567 (1,273) 2,791 7,706 10,324 1,982 185 (313) 8,470
Accounts payable (8,665) 667 13,916 (20,896) (5,035) 12,682 (25,623) (50,696) 39,088 2,736 (16,751)
Accrued compensation and benefits (90,906) 97,133 13,339 84,212 16,062 (16,480) 23,169 11,091 28,821 6,097 (22,840)
Deferred revenue (70,266) 126,716 117,250 238,479 (119,009) (110,004) 399,517 177,989 198,900 26,634 (4,006)
Income taxes payable (30,592) 196,567 (18,895) 84,026 112,044 19,392 (181,926) (94,702) 70,223 (97,362) (60,085)
Other assets 80,673 81,115 22,259 8,452 30,075 20,329 (23,332) (6,806) (21,104) (12,000) 16,578
Other liabilities (50,942) (2,334) (3,520) 42,709 7,018 (48,541) 48,121 50,719 10,944 (3,828) (9,714)
Net cash provided by operating activities 413,576 1,818,653 674,370 462,005 330,969 351,309 1,666,235 566,984 454,371 276,640 368,240
INVESTING ACTIVITIES: - - - - - - -
Purchase of property and equipment (57,695) (273,807) (64,678) (71,100) (63,341) (74,688) (419,749) (70,154) (113,108) (89,413) (147,074)
Proceeds from sale of property and equipment - 104,715 104,715 - (903) 903 121,464 34,560 - 86,904 -
Purchase of intangible assets - - - - - - (13,300) - (13,300) - -
Cash payments for business acquisitions, net of cash and cash equivalents acquired (166,356) (1,162,455) (11,772) (298,397) (11,718) (840,568) (33,373) (8,358) (20,425) (2,944) (1,646)
Investment in Joint Venture - (150,000) (150,000) - - - - - - - -
Purchases of available-for-sale securities (172,596) (1,233,954) (408,850) (184,534) (340,039) (300,531) (226,905) (97,339) (87,074) (29,809) (12,683)
Proceeds from sales of available-for-sale securities 471,998 1,189,283 358,380 332,517 394,775 103,611 349,408 53,950 49,490 98,703 147,265
Net cash provided by (used in) investing activities 75,351 (1,526,218) (172,205) (221,514) (21,226) (1,111,273) (222,455) (87,341) (184,417) 63,441 (14,138)
FINANCING ACTIVITIES:
Sale of common stock warrants - - - - - - 326,102 - - - 326,102
Repurchase of common stock (199,998) (1,499,995) (200,019) (399,992) (399,989) (499,995) (2,846,312) (594,998) (384,996) (974,958) (891,360)
Net proceeds from sales of common stock under employee stock benefit plans 74,987 224,152 59,990 33,942 68,057 62,163 230,295 61,039 51,274 77,501 40,481
Proceeds from debt issuance - - - - - - 2,067,299 (463) - - 2,067,762
Purchase of bond hedge - - - - - - (592,490) - - - (592,490)
Proceeds from short-term borrowing - 200,000 - 200,000 - - - - - - -
Repayment of short-term borrowing (200,000) - - - - - - - - - -
Excess income tax benefit from the exercise of stock options 9,033 26,151 7,844 4,778 4,485 9,044 25539 5,951 13,694 4,001 1,893
Repayment of other long-term obligation (1,842) (11,724) (1,811) (2,309) (2,271) (5,333) (520,000) - - (520,000) -
Tax payments related to restricted stock issuance (14,768) (4,137) (395) (692) (111) (2,939) - - - - -
Net cash (used in) provided by financing activities (332,588) (1,065,553) (134,391) (164,273) (329,829) (437,060) (1,309,567) (528,471) (320,028) (1,413,456) 952,388
Effect of exchange rate fluctuations on cash and cash equivalents (1,321) 104,309 37,962 19,907 34,401 12,039 109,199 15,859 34,291 (4,356) 63,405
Increase (decrease) in cash and cash equivalents 155,018 (668,809) 405,736 96,125 14,315 (1,184,985) 243,412 (32,969) (15,783) (1,077,731) 1,369,895
Beginning cash and cash equivalents 1,890,225 2,559,034 1,484,489 1,388,364 1,374,049 2,559,034 2,315,622 2,592,003 2,607,786 3,685,517 2,315,622
Ending cash and cash equivalents $ 2,045,243 $ 1,890,225 $ 1,890,225 $ 1,484,489 $ 1,388,364 $ 1,374,049 $ 2,559,034 $ 2,559,034 $ 2,592,003 $ 2,607,786 $ 3,685,517
- - -
Supplemental schedule of non-cash transactions: (701,777.60)
Issuance of common stock, stock options, and restricted stock units for business
acquisitions $ 35,054 $ -
Supplemental cash flow disclosures:
Income taxes paid (net of refunds) during the year $ 181,089 $ 384,771
Interest expense paid during the year $ 22,659 $ 10,108
11
12. SYMANTEC CORPORATION
Guidance - Reconciliation of Projected GAAP Revenue, GAAP Deferred Revenue and GAAP Earnings per Share
to Non-GAAP Revenue, Deferred Revenue and Earnings per Share
(Unaudited)
Three Months Ended:
October 3, 2008
Revenue reconciliation (in millions)
GAAP revenue range $1,520 - $1,560
Add back:
Deferred revenue related to acquisitions (1) 5
Non-GAAP revenue range $1,525 - $1,565
Earnings per share reconciliation
GAAP earnings per share range $0.15 - $0.17
Add back:
Stock-based compensation, net of tax (2) 0.04
Deferred revenue related to acquisitions, amortization of
(1,3,4)
acquired product rights and other intangible assets, and restructuring net of tax 0.15
Non-GAAP earnings per share range $0.34 - $0.36
As of :
October 3, 2008
Deferred revenue reconciliation (in millions)
GAAP deferred revenue range $2,865 - $2,965
Add back:
Deferred revenue related to acquisitions (1) 10
Non-GAAP deferred revenue range $2,875 - $2,975
We believe the presentation of these non-GAAP financial measures, when taken together with the corresponding GAAP financial measures, provide meaningful supplemental
information regarding the Company's operating performance by excluding certain items that may not be indicative of the Company's core business, operating results or future outlook.
Our management uses, and believes that investors benefit from referring to, these non-GAAP financial measures in assessing the Company's operating results both as a consolidated
entity and at the business unit level, as well as when planning, forecasting and analyzing future periods. We believe that these non-GAAP financial measures also facilitate
comparisons of the Company's performance to prior periods and to our peers. These measures are used by our management for the reasons associated with each of the adjusting items
as described below.
(1) Fair value adjustment to deferred revenue. We have completed several business combinations and acquisitions for a variety of strategic purposes over the past few years. As is
the case with our existing business, at the time of acquisition, these acquired businesses recorded deferred revenue related to past transactions for which revenue would be recognized
in future periods as revenue recognition criteria are satisfied. The purchase accounting entries for these acquisitions require us to write down a portion of this deferred revenue to its
then current fair value. Consequently, in post acquisition periods, we do not recognize the full amount of this deferred revenue. When measuring the performance of our business,
however, we add back non-GAAP revenue associated with certain types of deferred revenue that were excluded as a result of these purchase accounting adjustments, as we believe
that this provides information about the operating impact of the acquired businesses in a manner consistent with the revenue recognition for our pre-existing products and services.
We believe that the inclusion of this revenue and deferred revenue provides useful information to our management, as well as to investors.
(2) Stock-based compensation. Consists of expenses for employee stock options, restricted stock units, restricted stock awards and our employee stock purchase plan determined in
accordance with Statement of Financial Accounting Standards Number 123(R), or SFAS 123(R). When evaluating the performance of our individual business units and developing
short and long term plans, we do not consider stock-based compensation charges. Our management team is held accountable for cash-based compensation, but we believe that
management is limited in its ability to project the impact of stock-based compensation and accordingly is not held accountable for its impact on our operating results. Although stock-
based compensation is necessary to attract and retain quality employees, our consideration of stock based compensation places its primary emphasis on overall shareholder dilution
rather than the accounting charges associated with such grants. In addition, for comparability purposes, we believe it is useful to provide a non-GAAP financial measure that excludes
stock-based compensation in order to better understand the long-term performance of our core business and to facilitate the comparison of our results to the results of our peer
companies. Furthermore, unlike cash compensation, the value of stock-based compensation is determined using a complex formula that incorporates factors, such as market volatility,
that are beyond our control. Further, we believe it is useful to investors to understand the impact of SFAS 123(R) to our results of operations.
(3) Amortization of acquired product rights and other intangible assets. When conducting internal development of intangible assets, accounting rules require that we expense the
costs as incurred. In the case of acquired businesses, however, we are required to allocate a portion of the purchase price to the accounting value assigned to intangible assets acquired
and amortize this amount over the estimated useful lives of the acquired intangibles. The acquired company, in most cases, has itself previously expensed the costs incurred to
develop the acquired intangible assets, and the purchase price allocated to these assets is not necessarily reflective of the cost we would incur in developing the intangible asset.
Similarly, we adjust our share of the loss from unconsolidated entity for amortization related to the intangible assets of the joint venture. We eliminate these amortization charges from
our non-GAAP operating results to provide better comparability of pre and post-acquisition operating results and comparability to results of businesses utilizing internally developed
intangible assets.
(4) Restructuring. We have engaged in various restructuring activities over the past several years that have resulted in costs associated with severance, benefits, outplacement services,
and excess facilities. Each restructuring has been a discrete event based on a unique set of business objectives or circumstances, and each has differed from the others in terms of its
operational implementation, business impact and scope. We do not engage in restructuring activities in the ordinary course of business. While our operations previously benefited
from the employees and facilities covered by our various restructuring charges, these employees and facilities have benefited different parts of our business in different ways, and the
amount of these charges has varied significantly from period to period. We believe that it is important to understand these charges; however, we do not believe that these charges are
indicative of future operating results and that investors benefit from an understanding of our operating results without giving effect to them.
12