1. Clear Channel Reports Second Quarter 2004 Results
San Antonio, Texas July 23, 2004…Clear Channel Communications, Inc. (NYSE: CCU) today reported
results for its second quarter ended June 30, 2004.
The Company reported revenues of $2.5 billion in the second quarter of 2004, a 7% increase over the $2.3
billion reported for the second quarter of 2003. Clear Channel’s net income and diluted earnings per share
were $253.8 million and $.41 per diluted share during the second quarter of 2004.
The Company’s second quarter 2003 net income included approximately $41.3 million of pre-tax gains, $.04
per diluted share after tax, related primarily to the early extinguishment of debt. Excluding this gain, Clear
Channel’s second quarter 2003 net income would have been $225.7 million or $.37 per diluted share and the
Company’s second quarter 2004 net income and diluted earnings per share growth would have been 12% and
11%, respectively.
On Wednesday, July 21, the Company announced that the Board of Directors declared a quarterly dividend of
$0.125 per common share, an increase of 25% over the previous quarterly dividend of $0.10. The Board of
Directors also authorized an incremental share repurchase program, permitting the Company to repurchase
$1.0 billion of its common shares over the next 12 months. The Company had previously authorized a
repurchase program of $1.0 billion on March 30, 2004, which is substantially complete. To date, the Company
has repurchased $934 million of its common shares.
Mark Mays, Interim Chief Executive Officer, President and Chief Operating Officer said, quot;The long-term growth
potential of Clear Channel has never been better. We are continuing to reinvent our businesses and are
leading change in the businesses in which we compete. Our strong operating performance this quarter
generated 12% earnings growth and produced a significant amount of free cash flow. As a result, we have
increased the level of our dividend and implemented another share repurchase plan. We continue to believe
that the purchase of our common stock represents an attractive opportunity to benefit the long-term interests of
the Company and its shareholders. We expect to continue to deliver superior results and returns to our
shareholders for years to come.”
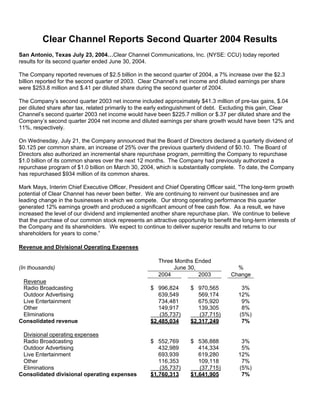
Revenue and Divisional Operating Expenses
Three Months Ended
(In thousands) June 30, %
2004 2003 Change
Revenue
Radio Broadcasting $ 996,824 $ 970,565 3%
Outdoor Advertising 639,549 569,174 12%
Live Entertainment 734,481 675,920 9%
Other 149,917 139,305 8%
Eliminations (35,737) (37,715) (5%)
Consolidated revenue $2,485,034 $2,317,249 7%
Divisional operating expenses
Radio Broadcasting $ 552,769 $ 536,888 3%
Outdoor Advertising 432,989 414,334 5%
Live Entertainment 693,939 619,280 12%
Other 116,353 109,118 7%
Eliminations (35,737) (37,715) (5%)
Consolidated divisional operating expenses $1,760,313 $1,641,905 7%
1
2. Included in the Company’s second quarter 2004 revenue and operating expenses are approximately $44.7
million and $36.9 million, respectively, of foreign exchange increases compared to the same period of 2003.
Radio Broadcasting
The Company’s radio broadcasting revenue increased 3% to $996.8 million in the second quarter of 2004
compared to the same period of 2003. The increase was driven by local revenues, the Company’s
syndicated radio programs and traffic revenues. The increase was partially offset by a decline in national
advertising revenue, which contributed to a deceleration in the Company’s revenue growth as the quarter
progressed. The primary driver of revenue growth was in the Company’s small and mid-sized markets,
which the Company defines as markets outside the top 25. Strong advertising categories included
services, media and consumer products, with automotive down for the quarter.
Radio’s operating expenses increased 3% in the second quarter of 2004 compared to the same period of
2003. The primary drivers of the increase were increased compensation costs related to program talent
salaries and sales commissions and increased advertising and promotion expenditures.
Outdoor Advertising
The Company’s outdoor advertising revenue increased 12% to $639.5 million during the second quarter of
2004 compared to the same period of 2003. Growth was led by strong domestic bulletin and poster
revenues as well as international street furniture and billboard revenues. Excluding foreign exchange of
approximately $28.8 million, revenues increased 7% for the quarter.
The growth in the Company’s domestic bulletin and poster revenue came from growth in average rates,
while occupancy levels were down for the second quarter of 2004 compared to 2003. Growth occurred
across the majority of the Company’s domestic markets, lead by Washington/Baltimore, Seattle, Tampa and
Portland. Strong advertising categories included automotive, retail, soft drinks, telecommunications,
entertainment, real estate and insurance.
The growth in the Company’s international revenues was fueled by growth in average revenue per billboard
and street furniture display. The number of billboard displays was down slightly while the number of street
furniture displays was up for the second quarter of 2004 compared to the same period of 2003. Strong
international markets included the United Kingdom, Australia and Sweden.
Outdoor’s operating expenses increased 5% to $433.0 million during the second quarter of 2004 compared
to the same period of 2003. The increase includes approximately $22.1 million from foreign exchange
increases. Also, the Company recorded a restructuring charge of approximately $11.0 million related to its
operations in France in the second quarter of 2003. Excluding foreign exchange and the restructuring
charge, operating expenses were up 2% driven by increased site lease expenses.
Live Entertainment
The Company’s live entertainment revenue increased 9% to $734.5 million during the second quarter of
2004 compared to the same period of 2003. The increase was driven by an increase in ticket sales and
theater event revenues, partially offset by event cancellations and a decline in ancillary revenues from
concessions, merchandising and parking. The increase in theater revenues was driven by additional
theatrical productions and an increase in the number of weeks presenting theater events in the second
quarter of 2004 compared to the same period of 2003. The decline in ancillary revenues was a result of
fewer events held at the Company’s amphitheaters in the second quarter of 2004 compared to the same
period of 2003. Also included in the revenue increase is approximately $15.9 million from foreign exchange
increases.
Live entertainment’s operating expenses increased 12% to $693.9 million during the second quarter of 2004
compared to the same period of 2003. Included in the increase is approximately $14.8 million from foreign
2
3. exchange increases. Live Entertainment’s operating expenses grew at a higher rate than its revenue
growth primarily from event cancellations and higher guaranteed artist payments during the second quarter
of 2004 compared to the same period of 2003.
Selected Balance Sheet Information
(In millions) June 30, 2004 March 31, 2004
Cash $ 232.8 $ 194.0
Total Current Assets $ 2,460.8 $ 2,197.5
Net Property, Plant and Equipment $ 4,103.8 $ 4,168.3
Total Assets $ 27,921.5 $ 27,799.5
Current Liabilities (excluding current portion of long-term debt) $ 2,137.4 $ 2,019.1
Long-Term Debt (including current portion of long-term debt) $ 6,676.6 $ 6,285.1
Shareholders’ Equity $ 15,122.8 $ 15,582.0
Capital Expenditures
Capital expenditures for the second quarter of 2004 versus 2003 were:
(In millions) June 30, 2004 June 30, 2003
Non-revenue producing $ 47.4 $ 35.7
Revenue producing 38.5 40.1
Total capital expenditures $ 85.9 $ 75.8
The Company defines non-revenue producing capital expenditures as those expenditures that are required on
a recurring basis. Revenue producing capital expenditures are discretionary capital investments for new
revenue streams, similar to an acquisition.
Liquidity and Financial Position
For the six months ended June 30, 2004, cash flow from operating activities was $903.8 million, cash flow
provided from investing activities was $320.3 million, and cash flow used in financing activities was $1.1 billion
for a net increase in cash of $109.4 million.
At June 30, 2004, Clear Channel had long-term debt of:
(In millions) June 30, 2004
Bank Credit Facilities $ 920.8
Public Notes 5,551.4
Other Debt 204.4
Total $ 6,676.6
Leverage, defined as debt*, net of cash, divided by the trailing 12-month pro forma EBITDA**, was 2.80x at
June 30, 2004.
On July 13, 2004 the Company entered into a new five-year, multi-currency revolving credit facility in the
amount of $1.75 billion. The facility can be used for general working capital purposes including commercial
*
As defined by Clear Channel’s credit facilities, debt is long-term debt of $6,676.6 million plus letters of credit of $138.7 million; guarantees of third party
debt of $13.2 million; net original issue discount/premium of $4.4 million; deferred purchase consideration of $14.4 million included in other long-term
liabilities; plus the fair value of interest rate swaps of $19.0 million; and less purchase accounting premiums of $15.3 million.
**
As defined by Clear Channel’s credit facilities, pro forma EBITDA is the trailing twelve-month EBITDA adjusted to include EBITDA of any assets
acquired in the trailing twelve-month period.
3
4. paper support as well as to fund capital expenditures, acquisitions, stock repurchases and the refinancing of
certain public debt securities. The Company's existing $1.5 billion revolving credit facility was repaid in its
entirety and terminated at the same time the Company entered into the new facility.
Randall Mays, Chief Financial Officer for the Company, said, “Our second quarter results highlight the
attractive growth characteristics of our out-of-home media assets and our ability to generate significant free
cash flow. In addition, we have repurchased a total of $934 million of our common shares under our share
repurchase plan, increased our dividend 25% and successfully closed and funded a new $1.75 billion, five-
year, multi-currency, revolving credit facility. With the new facility and the overall reduction and refinancing of
debt that has occurred over the past few years, we have a strong balance sheet and are very well positioned to
grow earnings and free cash flow over the long-term.”
As of June 30, 2004, 64% of the Company’s debt bears interest at fixed rates and 36% of the Company’s debt
bears interest at floating rates based upon LIBOR. The Company’s weighted average cost of debt at June 30,
2004 was 5.06%.
As of July 23, 2004, Clear Channel has approximately $1.1 billion available on its bank credit facilities. The
Company does not have any public debt maturing during 2004. The Company may utilize existing capacity
under its bank facilities and other available funds for future maturities or redemptions of debt. Redemptions or
repurchases will occur through open market purchases, privately negotiated transactions, or other means.
Business Outlook
The Company expects that operating income will increase in the low double digits on a percentage basis and
earnings per share will increase in the high teens to low twenties on a percentage basis for the full year of
2004. Earnings per share guidance excludes gains from the sale of investments and operating assets, and the
effects of early extinguishment of debt.
Conference Call
The Company will host a teleconference to discuss its results on July 23rd at 9:00 a.m. Eastern Time. The
conference call number is 800-810-0924 and the pass code is 396859. Please call ten minutes in advance to
ensure that you are connected prior to the presentation. The teleconference will also be available via a live
audio cast on the Company's website, located at www.clearchannel.com. A replay of the call will be available
for 72 hours after the live conference call. The replay number is 888-203-1112 and the pass code is 396859.
The audio cast will also be archived on the Company's website and will be available beginning 24 hours after
the call for a period of one week.
4
5. FINANCIAL HIGHLIGHTS
Clear Channel Communications, Inc. and Subsidiaries
Unaudited
(In thousands of dollars, except per share data)
Three months ended
30-Jun
%
2004 2003 Change
Revenue $2,485,034 $2,317,249 7.2%
Divisional operating expenses 1,760,313 1,641,905
Corporate expenses 46,581 42,459
Non-cash compensation expense 915 1,779
Depreciation and amortization 167,754 161,880
Operating Income 509,471 469,226 8.6%
Interest expense 85,403 95,311
Gain (loss) on marketable securities (5,503) 2,581
Equity in earnings (loss) of nonconsolidated affiliates 10,635 6,713
Other income (expense) - net (2,694) 39,142
Income before income taxes 426,506 422,351
Income tax benefit (expense):
Current (106,888) (58,321)
Deferred (65,848) (112,730)
Net Income $253,770 $251,300 1.0%
Net Income per share:
Basic $0.42 $0.41 2.4%
Diluted $0.41 $0.41 0.0%
Weighted Average Shares Outstanding - Diluted 612,960 617,556
5
6. Supplemental Disclosure Regarding Non-GAAP Financial
Information
Operating Income before Depreciation and Amortization (D&A) and Non-cash Compensation Expense
The following tables set forth Clear Channel's Operating Income, D&A and Non-cash compensation expense
for the three months ended June 30, 2004 and 2003. The Company defines quot;Operating Income before D&A
and Non-cash compensation expense” as net income adjusted to exclude the following line items presented in
its Statement of Operations: Income tax benefit (expense); Other income (expense) - net; Equity in earnings of
nonconsolidated affiliates; Gain (loss) on marketable securities; Interest expense; D&A; and, Non-cash
compensation expense.
The Company uses Operating Income before D&A and Non-cash compensation expense, among other things,
to evaluate the Company's operating performance. This measure is among the primary measures used by
management for planning and forecasting of future periods, as well as for measuring performance for
compensation of executives and other members of management. This measure is an important indicator of the
Company's operational strength and performance of its business because it provides a link between
profitability and cash flows from operating activities. It is also a primary measure used by management in
evaluating companies as potential acquisition targets.
The Company believes the presentation of this measure is relevant and useful for investors because it allows
investors to view performance in a manner similar to the method used by the Company's management. It helps
improve investors’ ability to understand the Company's operating performance and makes it easier to compare
the Company's results with other companies that have different capital structures or tax rates. In addition, this
measure is also among the primary measures used externally by the Company's investors, analysts and peers
in its industry for purposes of valuation and comparing the operating performance of the Company to other
companies in its industry. Additionally, the Company’s bank credit facilities use this measure for compliance
with leverage covenants.
Since Operating Income before D&A and Non-cash compensation expense is not a measure calculated in
accordance with GAAP, it should not be considered in isolation of, or as a substitute for, net income as an
indicator of operating performance and may not be comparable to similarly titled measures employed by other
companies. Operating Income, D&A and Non-cash compensation expense are all financial statement line
items included on the Company’s statement of earnings. Operating Income before D&A and Non-cash
compensation expense is not necessarily a measure of the Company's ability to fund its cash needs. As it
excludes certain financial information compared with operating income and net income (loss), the most directly
comparable GAAP financial measure, users of this financial information should consider the types of events
and transactions, which are excluded.
As required by the SEC, the Company provides reconciliations below of Operating Income before D&A and
Non-cash compensation expense for each segment to such segment's operating income, and Operating
Income before D&A and Non-cash compensation expense to net income, the most directly comparable
amounts reported under GAAP.
6
7. Non-cash Operating Income before
(In thousands) Operating compensation Depreciation D&A and Non-cash
income (loss) expense and amortization compensation expense
Three Months Ended June 30, 2004
Radio Broadcasting $ 405,848 $ 232 $ 37,975 $ 444,055
Outdoor Advertising 113,754 92,806 206,560
Live Entertainment 25,647 14,895 40,542
Other 16,706 16,858 33,564
Corporate (52,484) 683 5,220 (46,581)
Consolidated $ 509,471 $ 915 $ 167,754 $ 678,140
Three Months Ended June 30, 2003
Radio Broadcasting $ 394,401 $ 500 $ 38,776 $ 433,677
Outdoor Advertising 65,369 89,471 154,840
Live Entertainment 41,714 14,926 56,640
Other 17,608 12,579 30,187
Corporate (49,866) 1,279 6,128 (42,459)
Consolidated $ 469,226 $ 1,779 $ 161,880 $ 632,885
Reconciliation of Operating Income before Depreciation and amortization (D&A) and Non-cash
compensation expense to Net income
(In thousands) Three months ended June 30,
2004 2003
Operating Income before D&A and Non-cash
compensation expense $ 678,140 $ 632,885
Non-cash compensation expense 915 1,779
Depreciation & amortization 167,754 161,880
Operating Income 509,471 469,226
Interest expense 85,403 95,311
Gain (loss) on marketable securities (5,503) 2,581
Equity in earnings of nonconsolidated affiliates 10,635 6,713
Other income (expense) – net (2,694) 39,142
Income before income taxes 426,506 422,351
Income tax (expense) benefit:
Current (106,888) (58,321)
Deferred (65,848) (112,730)
Net income $ 253,770 $ 251,300
About Clear Channel Worldwide
Visit our website at http://www.clearchannel.com.
Clear Channel Worldwide, headquartered in San Antonio, Texas, is a global leader in the out-of-home
advertising and entertainment industries with radio and television stations, outdoor advertising displays, and
live entertainment productions and venues throughout the United States and in 63 countries around the world.
For further information contact:
Investors - Randy Palmer, Senior Vice President of Investor Relations, (210) 832-3315 or
7
8. Media – Lisa Dollinger, Senior Vice President of Corporate Communications, (210) 832-3474
or visit our web-site at http://www.clearchannel.com.
The numbers contained within this release are unaudited. Certain statements in this release constitute “forward-looking
statements” within the meaning of the Private Securities Litigation Reform Act of 1995. Such forward-looking statements
involve known and unknown risks, uncertainties and other factors which may cause the actual results, performance or
achievements of the Company to be materially different from any future results, performance or achievements expressed or
implied by such forward-looking statements. The words or phrases “guidance,” “expect,” “anticipate,” “estimates” and
“forecast” and similar words or expressions are intended to identify such forward-looking statements. In addition, any
statements that refer to expectations or other characterizations of future events or circumstances are forward-looking
statements. Various risks that could cause future results to differ from those expressed by the forward-looking statements
included in this release include, but are not limited to: changes in economic conditions in the U.S. and in other countries in
which Clear Channel currently does business (both general and relative to the advertising and entertainment industries);
fluctuations in interest rates; changes in industry conditions; changes in operating performance; shifts in population and
other demographics; changes in the level of competition for advertising dollars; fluctuations in operating costs; technological
changes and innovations; changes in labor conditions; changes in governmental regulations and policies and actions of
regulatory bodies; fluctuations in exchange rates and currency values; changes in tax rates; changes in capital expenditure
requirements and access to capital markets. Other key risks are described in the Clear Channel Communications’ reports
filed with the U.S. Securities and Exchange Commission. Except as otherwise stated in this news announcement, Clear
Channel Communications does not undertake any obligation to publicly update or revise any forward-looking statements
because of new information, future events or otherwise.
8