
Empfohlen
Weitere ähnliche Inhalte
Ähnlich wie parker hannifin annual 07
Ähnlich wie parker hannifin annual 07 (20)
Mehr von finance25
Mehr von finance25 (20)
Kürzlich hochgeladen
Kürzlich hochgeladen (20)
parker hannifin annual 07
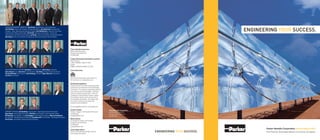
- 1. PARKER MANAGEMENT COMMITTEE: Dan Serbin, Vice President - Human Resources; Tom Williams, Senior Vice President and Operating Officer; Jack Myslenski, Executive Vice President - Sales, Marketing and Operations Support; Don Washkewicz, Chairman of the Board, Chief Executive Officer and President; Tim Pistell, Executive Vice President - Finance and Administration and Chief Financial Officer; Lee Banks, Senior Vice President and Operating Officer; Bob Barker, Senior Vice President and Operating Officer and Aerospace Group President. Parker Hannifin Corporation 6035 Parkland Boulevard Cleveland, Ohio 44124-4141 216 896 3000 Product Information & Distributor Locations North America: 1-800-C-PARKER (1 800 272 7537) Europe: 00800-C-PARKER-H (0800 2727 5374) GROUP PRESIDENTS & OFFICERS: Bob Bond, Fluid Connectors; Jeff Cullman, Hydraulics; Stock Information Heinz Droxner, Seal; John Greco, Instrumentation; Tom Healy, Climate & Industrial Controls; Ricardo Machado, Latin America; John Oelslager, Filtration; Roger Sherrard, Automation; Joe Vicic, Asia Pacific. New York Stock Exchange, ticker symbol: PH On the Internet at: www.phstock.com Worldwide Capabilities Parker Hannifin is the world’s leading diversified manufacturer of motion and control technologies and systems. The company’s engineering expertise spans the core motion technologies - electrome- chanical, hydraulic and pneumatic - with a full complement of fluid handling, filtration, sealing and shielding, climate control, process control and aerospace technologies. The company part- ners with its customers to increase their productivity and profitability. See our capabilities online at: www.parker.com Investor Contact Parker Hannifin Corporation CORPORATE OFFICERS: John Dedinsky, Vice President - Global Supply Chain & Procurement; Pamela J. Huggins, Vice President & Treasurer 6035 Parkland Boulevard Dana Dennis, Vice President & Controller; Bill Eline, Vice President - Chief Information Officer; 216 896 2240 Cleveland, Ohio 44124-4141 Bill Hoelting, Vice President - Tax; Pam Huggins, Vice President & Treasurer; Marwan Kashkoush, phuggins@parker.com 216 896 3000 Vice President - Worldwide Sales & Marketing; Craig Maxwell, Vice President - Technology & Innovation; Media Contact Tom Piraino, Vice President, General Counsel & Secretary. Christopher M. Farage, Vice President - Corporate Communications 216 896 2750 cfarage@parker.com Parker Hannifin Corporation Annual Report 2007 Career Opportunities The Premier Diversified Motion & Control Company Search for job openings and apply online at: www.parker.com/careers
- 2. Parker’s Motion & Control Product Groups CLIMATE & INDUSTRIAL AEROSPACE AUTOMATION FILTRATION FLUID CONNECTORS HYDRAULICS INSTRUMENTATION SEAL CONTROLS This year, Parker AirAgriculture a majorAlternative energy reaching & beverage Food Aerial lift Aerial lift Chemical & refining Aerospace Business jets Key Markets $10.7 Billion in Revenues Key Markets achieved milestone by surpassing conditioning Industrial machinery Agriculture Agriculture Food & beverage Chemical processing Commercial transports Conveyor & material handling 900,000 Products Appliances Life sciences Bulk chemical handling Construction machinery Medical & dental Consumer Defense Factory automation $10 billion in revenues Food & beverage Marine Construction machinery Forestry Microelectronics Energy, oil & gas Engines Life sciences & medical 427,000 Customers Industrial & commercial Mobile equipment Food & beverage Industrial machinery Oil & gas Fluid power General aviation Machine tools 57,000 Employees refrigeration Oil & gas Fuel & gas delivery Machine tool Power generation General industrial Helicopters Packaging machinery for the first time in our history. What comes next promises to Industrial machinery Power generation Industrial machinery Marine Information technology Launch vehicles Paper machinery 12,000 Distribution/MRO Outlets Oil & gas bebe even more exciting, as we partner with our customers to even more exciting, as we partner with our customers Process Medical Mining Life sciences Missiles & munitions Plastics machinery Life sciences & medical 1,200 Markets & converting Transportation Mining Oil & gas Military Power generation around the world to increase their profitability. Because when Precision cooling Primary metals Mobile Power generation & energy Semiconductor Regional transports 287 Manufacturing Plants Process Safety & security Oil & gas Truck hydraulics Telecommunications Unmanned aerial vehicles our customers succeed, we succeed. Supermarkets Semiconductor & electronics 125 Divisions Transportation Transportation Aftermarket services Transportation Transportation & automotive Key Products Accumulators AC/DC drives & systems Analytical gas generators Brass fittings & valves Accumulators Dynamic seals Electronics cooling Analytical sample conditioning Key Products products & systems CO2 controls Air preparation Compressed air & gas filters Diagnostic equipment Hydraulic cylinders Elastomeric o-rings Flight control systems 2007 in Review 2 & dryers & components Chemical injection fittings Electronic controllers Electric actuators, gantry Hose couplings Hydraulic motors & pumps EMI shielding Letter to Shareholders 3 & valves robots & slides Condition monitoring Fluid conveyance systems Filter driers Industrial hose Hydraulic systems Extruded & precision-cut, Fluoropolymer chemical Human machine interfaces Engine air, fuel & oil filtration fabricated elastomeric seals Fluid metering, delivery Customer Success 6 Hand shut-off valves PTFE hose & tubing Hydraulic valves & controls delivery fittings, valves & systems & atomization devices Manifolds High temperature metal seals Heat exchangers Quick couplings Hydrostatic steering & pumps Global Success 8 Hydraulic, lubrication & Fuel systems & components Miniature fluidics Homogeneous & inserted Hose & fittings Rubber & thermoplastic hose Integrated hydraulic circuits High purity gas delivery coolant filters elastomeric shapes Hydraulic systems Technology Success 10 Pneumatic accessories fittings, valves & regulators Pressure regulating valves Tube fittings & adapters Power take-offs Nitrogen, hydrogen & zero & components Metal & plastic retained Pneumatic actuators Process control fittings, valves, Refrigerant distributors Tubing & plastic fittings Power units air generators Operational Success 12 composite seals Inert gas generating systems & grippers regulators & manifold valves Safety relief valves Rotary actuators Process, chemical, water Thermal management Pneumatic systems Financial Success 14 Pneumatic valves & controls Process control manifolds & microfiltration filters Solenoid valves & components Rotary actuators Financial Report 15 Thermostatic expansion valves Wheels & brakes Stepper motors, servo motors, drives & controls Structural extrusions Vacuum generators, cups & sensors © 2007 PARKER HANNIFIN CORPORATION Cover Photo: Nevada Solar One Project Solargenix Energy, a subsidiary of Spain’s Acciona Group, relies on 760 Parker actuator systems (pictured left) to position more than 219,000 mirrors (pictured right) as they follow the sun across Nevada’s desert sky and generate 64 megawatts of clean, renewable energy. Special thanks to Acciona and Solargenix for their photo contributions. 1
- 3. This year, Parker achieved a major milestone by surpassing $10 billion in revenues for the first time in our history. What comes next promises to be even more exciting, as we partner with our customers around the world to increase their profitability. Because when our customers succeed, we succeed. 1
- 4. The Year in Review NET SALES NET INCOME CASH FLOWS FROM AVERAGE SALES/EMPLOYEE OPERATING ACTIVITIES Millions of Dollars Millions of Dollars Thousands of Dollars Millions of Dollars 11,000 900 1,000 200 9,900 810 900 180 8,800 720 800 160 7,700 630 700 140 6,600 540 600 120 5,500 450 500 100 4,400 360 400 80 3,300 210 300 60 2,200 180 200 40 1,100 90 100 20 0 0 0 0 03 04 05 06 07 03 04 05 06 07 03 04 05 06 07 03 04 05 06 07 FOR THE YEARS ENDED JUNE 30, 2007 2006 2005 (in thousands, except per share data) OPERATING DATA Net sales $ 10,718,059 $ 9,385,888 $ 8,068,805 Gross profit 2,445,110 2,018,270 1,677,328 Net income 830,046 673,167 604,692 Net cash provided by operating activities 955,007 954,639 853,506 Net cash (used in) investing activities (579,761) (921,243) (565,383) Net cash (used in) financing activities (378,529) (194,192) (137,538) PER SHARE DATA Diluted earnings per share $ 7.01 $ 5.57 $ 5.02 Dividends 1.04 .92 .78 Book value 40.71 35.46 28.14 RATIOS Return on sales 7.7% 7.2% 7.5% Return on average assets 10.0 9.0 9.3 Return on average equity 18.5 17.8 19.1 Debt to debt-equity 21.4 21.1 22.5 OTHER Number of employees 57,338 57,073 50,019 2
- 5. Letter to Shareholders By remaining focused on The Parker Win Strategy goals of premier customer service, financial performance and profitable growth, Parker employees around the world again delivered record results to shareholders, surpassing the $10 billion revenue milestone in the process. Parker delivered record results in fiscal year 2007 by continuing to do what we do best: partnering with customers to drive their productivity and profitability. We are committed to our belief that when our customers and distributors are successful, we will be too. We’ve summed up what Parker stands for with a bold new tagline: Engineering Your Success. It appears on the cover of this year’s annual report and will soon appear in all of our communication materials. Simply put, Engineering Your Success is our promise to customers around the world. To ensure that we remain the kind of enterprise capable of deliv- ering on this promise, we’re using a proven tool: The Parker Win Don Washkewicz, Chairman of the Board, Chief Executive Officer and President Strategy. Launched in 2001, The Parker Win Strategy provides the blueprint through which employees are engineering success • Return on invested capital of 21.9 percent placed Parker in every aspect of our organization. among the top quartile of our peers. Record Levels of Success • Parker’s stock price exceeded $100.00 a share on a pre-stock- Fiscal year 2007 was a year of outstanding achievements: split basis. • Sales reached $10.7 billion, an increase of 14.2 percent • The company also expanded and accelerated its share over fiscal year 2006. Of the total growth amount, 5 percent repurchases. was organic, 6 percent was from strategic acquisitions, and the remainder was from foreign currency exchange rates. Profitable Global Growth • Income from continuing operations increased 30 percent to a Each year, Parker aims to grow revenues by at least ten percent. record $830.0 million compared with $638.3 million a year ago. We achieved that goal again this year through a balanced • Before including the recent three-shares-for-two stock split, mix of organic growth and growth through acquisitions. diluted earnings per share from continuing operations were $7.01 compared to $5.28 a year ago. Winovation, our program for developing innovative new prod- • Net income as a percent of net sales reached an all-time ucts that customers want, continued to deliver breakthroughs: record 7.7 percent. • Data-carrying smart seals in sections of oil rig drilling rods • Cash flow from operations reached a record $955.0 million help sense the likelihood of finding oil or gas at any given site or 8.9 percent of sales. faster. Initial market potential: $20 million. • Parker’s annual dividend increased for the 51st consecutive • Self cleaning, regenerative filtration systems that neutralize year, one of the top five longest records of dividend increases biological, nuclear and chemical contaminants. Initial among the Standard & Poor’s 500. market potential: $40 million. • Since the end of the fiscal year, we increased our quarterly • Microfluidic process controllers that control instruments dividend paid to shareholders by more than 21 percent, in applications ranging from airport security to disease bringing our total quarterly dividend increase to more than detection. Initial market potential: $50 million. 65 percent over the last three years. 3
- 6. Disciplined Strategic Acquisitions The company also continued to invest wisely in acquisitions that fit its motion and control technology A-FILTER ARLON, Filtration, Sweden portfolio. ACAL AIR CONDITIONING & REFRIGERATION, Climate Control, UK ACOFAB SAS, Sealing & Shielding, France • Acofab in France, Rayco Technologies in Singapore and AIRTEK, Filtration, US Tecknit in the U.S. dramatically strengthened our global CABETT SUBSEA, Fluid & Gas Handling, US sealing and shielding platform. SERVICIOS METALCROM LIMITADA, Hydraulics, Chile POWER COMPONENTS of MIDWEST INC., Hydraulics, US • Cabett Subsea in the U.S and Rectus in Germany RAYCO TECHNOLOGIES, Sealing & Shielding, Singapore brought new technology and expanded distribution to RECTUS AG, Fluid & Gas Handling, Germany our fluid and gas handling offering. SSD DRIVES INDIA, Electromechanical, India • Important product and regional niches were filled in TECKNIT, Sealing & Shielding, US climate control, filtration and hydraulics. No single company offers a more comprehensive family of In addition, results from the acquisitions made a year ago motion and control products than Parker. Increasingly, custom- continue to improve as integration activities are completed. ers are asking Parker to help engineer their success by combining our products into complete systems. In China, for example, Taken together, our efforts have reshaped the company. our technologies are driving one of the largest marine dredge Parker’s revenues and profits are now more balanced systems ever constructed there. In the U.S., our climate control geographically, as the accompanying chart illustrates. This expertise is providing subsystems for geothermal heating and makes the company’s overall performance less susceptible to cooling units. Other examples include emission-reducing fan regional economic downturns when they occur. At the same drive systems for construction vehicles; flight, hydraulic, and time, we’ve kept our roughly 50/50 strategic mix between fuel control systems for nearly every plane flying today; and a full OEM and MRO business. We continue to apply Parker suite of life science solutions for anesthesia delivery, drug discov- technologies in dozens of diverse markets. ery, minimally invasive surgery and biomedical waste disposal. FY 2001 FY 2007 Parker’s ultimate competitive advantage in serving customers has been built over more than sixty years: our global network of Climate Climate 10% 12,000 distribution outlets that can provide our products nearly 9% Aerospace Industrial anytime, anywhere. Our relationships with distributors have Aerospace 16% North America Industrial 20% never been stronger. Parker continues to give them the products, 38% North America services and training they need to grow their businesses and 49% Industrial Industrial ours. One of our fastest growing innovations, the ParkerStore, International International 22% provides distributors with a tool to reach the walk-in MRO 36% or “industrial retail” marketplace untapped $6.0 Billion Revenues $10.7 Billion Revenues by competitors. Delivering Customer Success In sum, we follow our customers around the world and do what As the leader in the motion and control industry, Parker it takes to engineer their success. Centralized country sales strives to be our customers’ trusted partner. These relation- offices, market-specific sales teams, on-site service centers, ships are cultivated by listening closely to our customers and online tools and inventory management programs are among repeatedly providing them with value measured in real dol- the many tools at our customers’ disposal. We believe that no lars: saved time, reduced waste, gained efficiency, expanded company in our industry is better than Parker at providing output, and increased profitability. customers with local engineering, local products and local service. Customer trust is earned first by delivering quality products Building Greater Performance on-time. Parker’s performance level is among the best in class The Win Strategy’s initiatives drive excellence on the and allows us to win business when competitors fall short. fundamentals of purchasing, manufacturing and pricing. While Parker has already realized tremendous benefits from each of these initiatives, it is clear that there is still much to be gained. 4
- 7. Parker’s strategic procurement initiative continues to deliver Parker’s future goals include: millions of dollars in savings. We partner with key suppliers, • Continued #1 position in the global motion and control market rewarding them with larger orders and long term business in • Compound revenue growth rate of greater than 10 percent exchange for continuous supply chain improvements. These • Top quartile return on invested capital among our peer group agreements help us plan for and mitigate swings in the costs of • Market share of 20 percent raw materials. • Continued dividend growth • Technology leadership and a continuous flow of innovative Lean Enterprise is the way we operate our company around new products the world. Tools such as standard work, value stream mapping, visual controls and error proofing are used to meet objective, What may be most exciting is that our target market potential measurable goals. As these tools are applied, inventory levels has greatly expanded. This year we completely reassessed our and capital expenditures go down while productivity, quality and market opportunities to account for the effects of recent return on net assets improve. We continue to see especially acquisitions and internal technology developments. Our true dramatic results as we introduce lean to recently acquired compa- opportunity is now more than double previous assessments. nies. Lean is also taking hold in the office as areas such as finance, legal, and marketing reduce waste and improve productivity. We feel it will be hard for our competitors to match the continued success of Parker because of our technologies, our In terms of pricing, Parker has become adept at capturing the diversification, our structure and our people. The need for Parker full value we provide our customers. Our ability to do just that products and technologies continues to grow. Wherever the stan- was profiled in a front page Wall Street Journal article earlier dard of living is increasing, Parker is there to satisfy basic needs this year. in the areas of energy, food and water, healthcare, infrastructure and the environment. With each succeeding year, we are proving These efforts are yielding results. Most telling is Parker’s margin that our success is predictable and repeatable. Management improvement outside of North America. A dollar of sales inter- incentives are aligned to maximize shareholder value. The future nationally today yields nearly the same level of profit as the rest is bright. On behalf of our employees, I thank you, our share- of our industrial business. Regional downturns should no longer holders, for giving us the opportunity to engineer your success. affect Parker as dramatically as they once did. Sincerely, Empowered Employees Drive Success At Parker, we trust that the people closest to the work know best how to improve their processes. The company’s decentralized structure allows employees to be entrepreneurial, reacting as Donald E. Washkewicz they see fit to sudden or emerging opportunities to grow Chairman, CEO and President the business. We continue to develop a diversified group of leaders at all levels of the organization. Perhaps the best example of our bench strength: the seamless management transition following the retirement of President and Chief Operating Officer Nick Vande Steeg. Proven leaders Lee Banks, Bob Barker and Tom Williams were each named Senior Vice President and Operating Officer to build on what’s already been done and to lead Parker into the future. More Success to Come Fiscal year 2007 was a great year at Parker. Our stock price reached record levels. Total shareholder return has outpaced the S&P 500 and S&P Industrial indices over three, five and ten years. Yet, employees throughout the organization insist ▲ The Win Strategy gives clarity to our people and operations around the “the best is yet to come.” I know they are right. world. Our vision of being the #1 motion and control company rests on the strategy’s pillars of premier customer service, financial performance and profitable growth. 5
- 8. Customer Success Premier customer service always comes first at Parker. We face and knowing the markets they serve. Our market-focused collaborate with our customers to engineer solutions that sales forces provide relevant expertise to customers. improve their profitability and reduce complexity. We look at their entire operation to integrate systems that add long- Custom products are typical, subsystems are practical, term value. and engineered systems celebrated. We are in the business of accommodating our customers. If our standard offering Parker’s global presence supports on-time delivery and doesn’t meet the needs of a particular application, our on-site services that speed customers’ operations. We pro- engineers work side by side with the customer until the vide audits that target specific operating costs and advise problem is solved. Parker provides motion and control customers of ways to reduce their spend. We help to improve technologies and systems, bringing together all of our customers’ performance by listening to the challenges they specialized operations. 6
- 9. ▲ Refrigerated Large Capacity Dryers Custom large capacity dryers for compressed air are tested and approved by China Steel Corporation at Parker’s Domnick Hunter Hiross facility in S. Angelo di Piove, Italy. Flight Controls for Light Jets Protecting Patients’ Health Demanding Performance Significant Energy Savings Subsystem contracts are increasingly Parker and French customer Anios filter Herrenknecht, of Germany, relies on Aluminum manufacturers in Dubai awarded to Parker based on our water used for surgical hand washing Parker to plumb its utility tunneling and and Russia reduce operating costs by reputation for quality. and showering of immuno-compro- geothermal exploration equipment. using less compressed air with Parker mised patients to minimize risk of cylinders. hospital acquired illnesses. 7
- 10. ▲ Infrastructure Construction and Maintenance Here in Shanghai, China and around the world, we make it possible to connect with people, whether it be through building infrastructure or enabling telecommunications. ParkerStore Retail Locations Optimizing Wind Power Local Customer Service Safe Alternate Energy Our distributor-owned ParkerStores serve In Denmark, leading wind turbine An acquired Chilean manufacturer Nuclear energy is re-emerging with the vast, global MRO market. Thousands of companies use Parker hydraulics increased Parker’s market share in the millions of dollars of Parker products products are available in The Parker Book, exclusively. region’s mining industry. supporting safe operation. an MRO specific catalog. 8
- 11. Global Success Parker continues to expand its global footprint through worldwide. Customers are able to take advantage of on-site strategic acquisitions and organic growth. We’ve achieved a service and engineering expertise, as well as inventory geographic sales balance unparalleled in the company’s management programs. history. We’ve organized our operations to achieve compa- rable margins anywhere in the world. Parker’s global reach By establishing operations close to our customers, we’re enables us to serve global OEMs with local manufacturing and enjoying growth in every region of the world. Ongoing around-the-clock customer service. improvements in the standard of living worldwide mean the demand for our technologies should steadily increase. We add Our loyal, 12,000-location strong, distribution network gives new talent and capabilities with each company that joins us in customers personalized access to Parker’s capabilities our quest to remain the global leader in motion and control. 9
- 12. ▲ Consumer Entertainment Market Parker helps flat panel television manufacturers keep up with growing Asian consumer demand by providing gantry systems that position panels during the fabrication process. Flexible Drives Smart Syringes Public Safety Intelligent Pumps This AC adjustable speed drive features Our fluidic dispensing systems enable Contaminants are eliminated from In aerospace applications, our pumps a modular design, easing installation and precise liquid metering for the drug municipal water systems with the help adjust flow and pressure in response to maintenance. discovery and life science markets. of Parker’s instant monitoring systems. system demand for optimum efficiency. 10
- 13. Technology Success Parker’s systematic approach to innovation, called At Parker, we employ our motion and control technologies Winovation, gives our engineers the framework to develop to improve the quality of life for people everywhere. solutions customers want. Winovation promotes the We team with our customers to find new ways to develop development of breakthrough products and ensures their infrastructure, save energy, reduce pollution, improve ultimate success. We strive to deliver technology our safety, and promote health. customers need instead of just filling out product lines. Our intelligent systems communicate with operators, Our access to world markets and available cash makes us an providing information to support reliable performance. Our attractive partner for emerging technology companies. We integration of electronics allows us to create smart products develop partnerships with start-up companies to benefit our and systems that sense, diagnose and respond automatically, customers with progressive technology. eliminating human error. We integrate functions that help to reduce our customers’ down-time and improve their productivity. 11
- 14. Operational Success Our Win Strategy focuses on customer service, financial provide in our products. We continue to leverage performance and profitable growth, and provides consistency strategic contracts to maintain a healthy supply chain. throughout Parker’s decentralized organization. Our 57,000 Still, we have much more to accomplish by executing each employees have achieved productivity gains, improved initiative in the Win Strategy. on-time delivery, and decreased inventory levels. Parker has recently implemented programs to support We’ve optimized our manufacturing globally, with fewer innovative products on both ends of our Winovation plants and higher utilization. Our efforts have put Parker’s process: Winmap, our marketing-focused program; and international operating margins nearly on par with those in Winvalue, our sales-based program. These new processes North America. We’ve educated many of our suppliers, dis- will work well to complement the Win Strategy initiatives, tributors and customers on the advantages of lean operations leveraging the strength of Parker with well thought-out plans as well. Our pricing model now captures all of the value we for the application of our technology. 12
- 15. ▲ Kaarst, Germany Sales Company Our strategically located sales companies pull Parker systems together for customers, bringing our global capabilities to local markets with local people. Lean Enterprise Procurement Improvements Immediate Response Phastite Fitting Our manufacturing operations are in- Parker worked with a supplier to In the aerial lift market, we deliver This virtually indestructible fitting creasingly productive, and we’re using reduce the weight of this pump by products direct to the assembly line emerged from our Winovation process, lean methodologies to streamline our 30 percent with a redesign of its and enjoy sole source agreements with which guides strategic product functional business processes. iron castings. leading global providers. development. 13
- 16. Financial Success Total Shareholder Return Our Return on Net Assets Goal Annual Equivalent S&P 500 S&P 500 Industrials Parker 25% L OA RONA G 20% 20% 07 06 % of Return on Sales 17% 05 15% 04 10% 03 11% 5% 0% 5 Year 3 Year 10 Year Years Ending June 30, 2007 Net Assets/Sales Total shareholder return assumes stock price appreciation and reinvestment Continued Above-the-Line Performance in 2007 – Return on Net Assets is of dividends. In FY2007, Parker total shareholder return was 28 percent, or a common metric throughout the company, providing a standard for how 35 percent higher than the S&P 500. efficiently and productively each operating unit employs the average dollar invested in assets. To reach Parkerʼs internally established benchmark, the RONA Goal line, operations must successfully balance investments in assets with profitable sales growth. Since the launch of the Win Strategy, Parker has steadily moved toward the goal, reaching the line in 2005 and eclipsing it in 2006 and 2007. Over the last six years, Parkerʼs Win Strategy has driven the companyʼs financial performance to a higher level. As our employees continue to execute our Win Strategy, we will continue to operate from a position of financial strength, enabling us to invest in strategic new opportunities, grow our business, and provide strong returns to our shareholders. Parker Return on Invested Capital Versus Peers* Peers Parker 36.0% 34.5% 26.4% 24.4% PARKER 21.9% 20.8% 20.7% 20.5% 20.1% 18.9% 18.8% Strong ROIC Performance in 2007 – Our ROIC 17.2% continues to outpace our weighted average cost 16.9% of capital, creating value for our shareholders. 16.9% 16.3% 13.1% 12.9% 12.1% 11.4% 0% 5% 10% 15% 20% 25% 30% 35% 40% 05 Return on Invested Capital % *Return on Invested Capital = [Pretax income from Continuing Operations + Interest Expense] / [Average Debt + Average Equity]. Parkerʼs ROIC peers include (identified by stock symbol) CAT, CBE, CMI, DE, DHR, DOV, EMR, ETN, FLS, GR, HON, IR, ITT, ITW, PLL, ROK, SPW, and TXT. Peer data is from most recent 10-K filings. 14
- 17. FINANCIAL REVIEW Consolidated Statements of Income and Comprehensive Income page 22 Consolidated Statement of Cash Flows page 25 Business Segment Information page 23 Notes to Consolidated Financial Statements page 26 Consolidated Balance Sheet page 24 Eleven-Year Financial Summary page 38 RETURN ON AVERAGE FIVE-YEAR AVERAGE RETURN DIVIDEND ASSETS/ COMPOUND EQUITY ON SALES PAYOUT RATIO SALES SALES GROWTH Goal: 15.0% Goal: 6.5% Goal: 25.0% Goal: $.80 Goal: 10% 15.0% 9.0% $1.20 24.0% 75.0% 10.0% 6.0% $.80 16.0% 50.0% 5.0% 3.0% $.40 8.0% 25.0% 03 04 05 06 07 03 04 05 06 07 03 04 05 06 07 03 04 05 06 07 03 04 05 06 07 MANAGEMENT’S DISCUSSION AND ANALYSIS Overview The ISM index at the end of fiscal 2007 was 56.0 and the most recent PMI for the Eurozone countries was 54.1. With respect to the aerospace market, aircraft miles The Company is a leading worldwide diversified manufacturer of motion control flown and revenue passenger miles in 2007 have shown moderate improvement over products and systems, providing precision engineered solutions for a wide variety comparable fiscal 2006 levels and the Company expects continued improvement in of commercial, mobile, industrial and aerospace markets. fiscal 2008. The Company anticipates that Department of Defense spending in fiscal 2008 will be about 2 percent higher than the fiscal 2007 level. The Company’s order rates provide a near-term perspective of the Company’s outlook particularly when viewed in the context of prior and future order rates. The Company The Company also believes that there is a high correlation between interest rates has historically published its order rates on a monthly basis. However, beginning in and Industrial manufacturing activity. The Federal Reserve did not change the federal fiscal 2008, the Company will publish order rates on a quarterly basis in order to funds rate during fiscal 2007 but did raise the federal funds rate eight times during more effectively characterize the longer term trends of the Company’s markets. The fiscal 2006. Increases in the federal funds rate typically have a negative impact on lead time between the time an order is received and revenue is realized can range industrial production thereby lowering future order rates while decreases in the federal from one day to 12 weeks for commercial, mobile and industrial orders and from one funds rate typically have the opposite effect. day to 18 months for aerospace orders. The Company believes the leading economic indicators of these markets that have a strong correlation to the Company’s future The Company’s major opportunities for growth are as follows: order rates are as follows: Leverage the Company’s broad product line with customers desiring to • Institute of Supply Management (ISM) index of manufacturing activity with consolidate their vendor base and outsource system engineering, • respect to North American commercial, mobile and industrial markets, Marketing systems solutions for customer applications, • Purchasing Managers Index (PMI) on manufacturing activity with respect to • Expand the Company’s business presence outside of North America, • most International commercial, mobile and industrial markets, and New product introductions, including those resulting from the Company’s • Aircraft miles flown and revenue passenger miles for commercial aerospace • innovation initiatives, markets and Department of Defense spending for military aerospace markets. Completing strategic acquisitions in a consolidating motion and control • An ISM and PMI index above 50 indicates that the manufacturing economy is industry, and expanding resulting in the expectation that the Company’s order rates in the commercial, mobile and industrial markets should be positive year-over-year. Expanding the Company’s vast distribution network. • Parker Hannifin Corporation annual report 2006 2007 15
- 18. MANAGEMENT’S DISCUSSION & ANALYSIS The financial condition of the Company remains strong as evidenced by the continued in 2007 were 14.2 percent higher than 2006. The increase in sales in NET SALES generation of substantial cash flows from operating activities, which were $955 2007 primarily reflects higher volume experienced across all Segments. Acquisitions million or 8.9 percent of sales in fiscal 2007, a debt to debt-equity ratio of 21.4 completed within the last 12 months contributed about 45 percent of the net sales percent, ample borrowing capabilities and strong short-term credit ratings. increase. The effect of currency rate changes increased net sales by approximately $241 million. Acquisition opportunities remain available to the Company within its target markets. During fiscal 2007, the Company completed 11 acquisitions whose aggregate Net sales in 2006 were 16.3 percent higher than 2005. The increase in sales in incremental annual revenues were approximately $260 million. The Company 2006 primarily reflects higher volume experienced across all Segments. Acquisitions believes that future financial results will reflect the benefit of a fast and efficient completed within the last 12 months contributed about one-half of the net sales integration of the companies recently acquired. Acquisitions will continue to be increase. The effect of currency rate changes reduced net sales in 2006 by considered from time to time to the extent there is a strong strategic fit, while at approximately $38 million. the same time, maintaining the Company’s strong financial position. The Company During 2007, the Company experienced strong business conditions in several of will also continue to assess the strategic fit of its existing businesses and initiate the markets of the Industrial International businesses and the Aerospace Segment. efforts to divest businesses that are not considered to be a good long-term fit Softer business conditions were experienced in a number of markets of the Industrial for the Company. Future business divestitures could have a negative effect on North America businesses and the Climate & Industrial Controls Segment. For 2008, the Company’s results of operations. the Company expects the strong business conditions experienced in the Industrial The Company routinely strives to improve customer service levels and manage International businesses and the Aerospace Segment to continue while business changes in raw material prices and expenses related to employee health and welfare conditions in a number of the markets in the Industrial North American operations benefits. The Company is currently focused on maintaining its financial strength and Climate & Industrial Controls Segment will continue to be soft. through the current Industrial North American slowdown, especially in the auto- was higher in 2007 primarily due to a combination of the GROSS PROFIT MARGIN motive, heavy-duty truck and construction markets. The Company has in place a increase in sales and the effects of the Company’s financial performance initiatives, number of strategic financial performance initiatives relating to growth and margin especially in the Industrial International businesses. Current-year acquisitions, not improvement in order to meet these challenges, including strategic procurement, yet fully integrated, negatively affected the current-year gross margin. The higher strategic pricing, lean enterprise, product innovation and business realignments. margins in 2006 were primarily due to a combination of the increase in sales as The discussion below is structured to separately discuss each of the financial well as the effects of the Company’s financial performance initiatives, especially statements presented on pages 22 to 25. All year references are to fiscal years. in the areas of lean manufacturing and strategic procurement. increased 18.3 percent in SELLING, GENERAL AND ADMINISTRATIVE EXPENSES Discussion of Consolidated Statement of Income 2007 primarily due to the higher sales volume, as well as higher expenses related to research and development, incentive compensation and professional fees. The Consolidated Statement of Income summarizes the Company’s operating performance over the last three fiscal years. INTEREST EXPENSE increased in 2007 primarily due to higher average debt out- standing as well as higher interest rates, primarily on commercial paper borrowings. (millions) 2006 2005 2007 Interest expense increased in 2006 as a result of higher average debt outstanding Net sales $ 9,386 $ 8,069 $10,718 resulting from an increase in borrowings used to fund 2006 acquisition activity. Gross profit margin 21.5% 20.8% 22.8% Selling, general and includes plant and equipment disposals, (GAIN) LOSS ON DISPOSAL OF ASSETS administrative expenses $ 1,037 $ 860 $ 1,227 divestitures of businesses and miscellaneous asset adjustments. Interest expense 76 67 83 Other (income) expense, net (9) 8 (7) (millions) 2006 2005 2007 (Gain) loss on disposal Plant and equipment disposals $(1) $3 $(11) of assets 15 4 (17) Divestitures 10 (6) Effective tax rate from Asset adjustments 6 1 continuing operations 29.1% 27.8% 28.4% Income from The amount for divestitures in 2007 primarily relates to the final accounting for a continuing operations $ 638 $ 533 $ 830 business divested in 2002. The amount for divestitures in 2006 primarily relates to Income from the sale of the Thermoplastics division. continuing operations, as a percent of sales 6.8% 6.6% 7.7% was lower in 2007 primarily EFFECTIVE TAX RATE FROM CONTINUING OPERATIONS Discontinued operations $ 35 $ 72 due to a higher amount of research and development tax credits received in 2007 Net income $ 673 $ 605 $ 830 as compared to 2006. The effective tax rate in 2006 was higher primarily due to a lower level of research and development tax credits as compared to 2005, partially offset by the effect of tax planning initiatives. In August 2007, a new German tax rate was enacted. The effect of the new tax rate will be accounted for as a discrete tax item in the first quarter of fiscal 2008 resulting in a tax benefit of approximately $7 million. Parker Hannifin Corporation annual report 2007 16