1. PPG Industries, Inc. First Quarter 2007 Financial Results
April 19, 2007 Recorded Comments as presented by Vince Morales, Director Investor Relations
First, thank you for your time and interest in PPG. In the next few minutes, I’ll review our
first quarter 2007 performance and comment on various industry and economic trends
underlying our performance. Before getting into all the details, let me quickly characterize
the quarter for you.
• Before we start, let me remind everyone that we have changed the composition of our
reportable business segment information. This new segmentation reflects
management’s view of our company and provides further clarity concerning our financial
performance. This information will help our shareholders to measure our success as we
deliver on our strategic plans.
• Speaking of delivering, PPG’s first quarter sales grew to $2.9 billion, representing an 11
percent increase versus the first quarter 2006. This is a new all-time quarterly sales
figure for PPG for any quarter, topping our prior mark set in the second quarter of last
year. We have consistently delivered top line growth as this marks the sixteenth
consecutive quarter in which we have delivered a year-over-year quarterly sales record.
• Leading this excellent sales performance were our strongest operating margin
businesses. Our Performance and Applied Coatings segment grew sales over 25
percent. Also our Optical and Specialty Materials segment grew 21 percent.
• Also, the company’s volumes grew by 3 percent, led by continued excellent volume
growth in both Asia and Europe which I will discuss further in detail later. In North
America we also posted positive volume growth, but the level was tempered by weaker
economic conditions.
• Our first quarter earnings-per-share were $1.17 which includes a reduction of $0.03 per
share for our proposed asbestos settlement. Last year earnings-per-share were $1.11
and included per share reductions of $0.14 for restructuring and $0.03 for the asbestos
settlement. Earnings in both years benefited favorably by about $0.10 per share from
favorable one-time tax items.
• Our business segment earnings improved in both Coatings segments and our Optical
and Specialty Materials segment. Earnings declined in both Commodity Chemicals and
Glass. I will discuss the specifics on all these segments a bit later.
• During the quarter, we completed the acquisition of the architectural and industrial
coatings businesses of Renner Sayerlack S.A., which substantially expands and
strengthens our Latin American coatings presence.
• Lastly, in January, our quarterly dividend was raised to $0.50 per share. Also, during the
quarter we repurchased over $55 million of PPG stock, and near the end of the quarter
our stock set a new 52-week high.
2. 2
Now let me just expand a bit on some of the key points:
• In the quarter, our 11 percent sales increase was driven by both of our Coatings
segments and our Optical and Specialty Material segment, which each grew by double-
digit percentages. As we have said many times, these are the business segments we
have targeted for growth and our results certainly demonstrate the successful execution
of our growth strategies.
• That being said, our growth strategies would not be successful without the
accompanying earnings impact, and collectively the two Coatings segments and the
Optical and Specialty Materials segment contributed about $30 million of operating
earnings versus the first quarter of 2006.
• The results in these segments were due to both organic growth, particularly outside the
U.S. and Canada, and from the acquisitions we have made since the beginning of 2006.
• With respect to both acquisition sales and earnings, as per our prior commitment, we are
beginning to deliver from these acquisitions. We indicated last quarter that we expected
acquisitions to add full year 2007 sales of between $700 to $800 million dollars and
produce industry level margins. In the first quarter, our acquisitions added about $190
million in sales and about $11 million in earnings.
Moving ahead, as we begin to reach the various one-year anniversary dates on these
acquisitions, it will be more difficult for those externally to visually track our progress.
However, we will provide periodic updates on progress against the benchmarks noted.
• Regarding uses of cash, we once again deployed cash in a balanced manner with the
dual focus of rewarding shareholders today and building for the future. In the quarter,
we spent about $135 million on dividends and share buybacks, and around $150 million
on acquisitions. Additionally, we made a $100 million voluntary pension contribution.
To quickly summarize our excellent first quarter performance, we once again delivered on
our growth commitments and did so despite overall slower growth in North America and
significant declines in several major end-use markets. We accomplished this excellent
performance through our global reach, excellent customer profile and our leading
technologies and services.
Now let’s review the details.
Business Segment Sales
First Quarter Sales Comparisons
Our first quarter sales results are illustrated on slide
number 3.
1st Quarter
Sales 2007 2006 % Change
Performance & Applied Coatings $ 855 $ 678 26%
For the overall quarter, sales increased 11 percent
Industrial Coatings 869 768 13%
Optical & Specialty Materials 280 232 21%
with volume growth of 3 percent and acquisitions
Commodity Chemicals 371 401 -7%
Glass 542 559 -3%
adding 7 percent. A stronger Euro drove favorable
Total PPG $ 2,917 $ 2,638 11%
currency impacts of 3 percent, which slightly
outpaced reduced sales due to lower pricing of
3. 3
2 percent. Once again, our quarterly sales performance was an all-time PPG record for the
first quarter or any quarter in PPG history.
Our Performance and Applied Coatings segment delivered sales growth of 26 percent, as
all three businesses Aerospace, Architectural Coatings and Automotive Refinish delivered
sales growth over 20 percent. Naturally, given this level of growth, each of these
businesses achieved a new all-time quarterly sales record.
The Industrial Coatings segment also realized double-digit percentage growth, posting a 13
percent year-over-year gain. Our Automotive OEM Coatings and Packaging Coatings
businesses led the way with top-line growth of 14 percent and 22 percent respectively. Our
Industrial Coatings business grew a respectable 9 percent on the strength of robust sales
growth in Asia and Europe.
Sales in our Optical and Specialty Materials segment improved by 21 percent as both our
Optical Products and Fine Chemicals businesses posted solid sales increases of greater
than 15 percent.
Our Glass segment sales declined by 3 percent driven largely by the impact of lower
production levels of the U.S. domestic auto manufacturers and weaker residential
construction. Also, as we mentioned would occur at the outset of the quarter, pricing in our
Performance Glazings business fell by nearly $8 million versus last year due to a reduction
in an energy surcharge relating to lower natural gas prices.
Our Commodity Chemical segment sales were down 7 percent reflecting the decline in
market prices for chlorine and caustic soda from all-time high levels in the first quarter of
2006. This price decline was, in part, a reflection of lower natural gas prices.
In aggregate, stronger foreign currencies, primarily the Euro, contributed about $75 million
to our sales and added about $12 million to our earnings.
To summarize our record sales performance, for the past several years we have
consistently delivered excellent sales growth despite varying global economic conditions.
Our global presence, results from our disciplined acquisitions, continued strength in
industries such as Optical Products and Aerospace, and the dedicated efforts of our people
in focusing on our customers’ needs were all contributing factors to our exceptional
performance. Looking ahead, our strategies remain focused on driving continued and
profitable growth.
I will discuss our results in some of our business
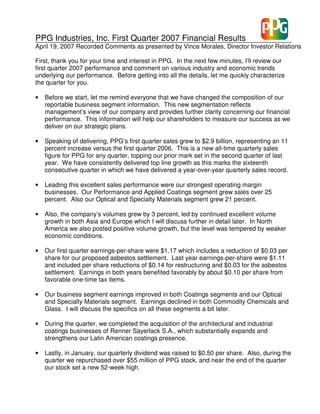
Quarterly Volume Change
Total PPG units later. Now let’s take a look at our overall
sales growth trends.
From Prior Year Quarter
10
Quarterly Volume Change – Total PPG
U.S.
8
Hurricanes
As slide number 4 clearly illustrates, our volume
6
Percent
4
growth in the quarter was exceptional, especially in
2
light of the slowing growth in the North American
0
economy. This performance was achieved despite
-2
-4
-6
2002 2003 2004 2005 2006 2007
1st Qtr 2nd Qtr 3rd Qtr 4th Qtr
4. 4
being negatively impacted by several large U.S. customers who took significant downtime,
primarily in the first six to eight weeks of the year.
Despite these headwinds, and a difficult comparison period, we posted a 3 percent year-
over-year volume gain during the quarter which, as is visible on the graph, was one of our
best year-over-year volume gains over the past several years. An important element of this
growth performance is the strength of our markets outside the U.S. and Canada, and the
results we are garnering from our investments in these parts of the world.
Now let’s review our results in those regions.
Quarterly Volume Change – Europe
The next slide depicts our European volumes
Quarterly Volume Change
where this past quarter we continued a very
Europe
positive trend which began over a year ago. As a
From Prior Year Quarter
matter of fact, our volume growth actually
10
accelerated this past quarter to about 8 percent,
8
6
easily one of our best quarters in Europe in over
4
Percent
2
five years.
0
-2
-4
The overall factors driving this performance trend
-6
-8
were market share growth by PPG in the region
-10
2002 2003 2004 2005 2006 2007
and a continued solid European economic
1st Qtr 2nd Qtr 3rd Qtr 4th Qtr
environment.
Quarterly Volume Change
Asia Quarterly Volume Trends Asia
Moving to the slide depicting our Asian markets,
From Prior Year Quarter
our organic growth in this region continues.
25
Economic growth in this region remains very
20
strong, especially in terms of industrial production
Percent
15
and infrastructure development which are some of
10
the key markets we serve.
5
While not depicted on this slide, during the quarter
0
2002 2003 2004 2005 2006 2007
our total Asian sales grew by over 70 percent year-
1st Qtr 2nd Qtr 3rd Qtr 4th Qtr
over-year, as our strong volume growth was
supplemented by sales from our prior year
First Quarter Comparisons acquisitions.
We continue to expect our organic growth
2007 2006
prospects in this region to remain robust,
Million EPS Million EPS
Net Income As Reported $ 194 $ 1.17 $ 184 $ 1.11
supporting continued high economic activity in the
Net Income Includes the Following Charges:
region.
Asbestos Settlement - Net $ 5 $ 0.03 $ 6 $ 0.03
Business Restructuring - - 23 0.14
Now let’s move to our earnings performance.
First Quarter Earnings Comparison
As depicted on slide number 7, we reported first
quarter earnings-per-share of $1.17 in the quarter that included a reduction of five million
dollars after-tax, or $0.03 a share related to our proposed asbestos settlement.
5. 5
Last year our reported earnings-per-share were $1.11. This figure included charges of
$0.03 a share for our asbestos settlement and $0.14 a share relating to restructuring costs.
Our first quarter 2007 tax rate was about 24.3 percent. The rate was lowered as we
adjusted a portion of our net operating losses or NOL carryforwards in Europe. This was
done in reflection of improved profitability in that region. This lower tax rate added about
$0.10 per share to our first quarter earnings per share. Without this adjustment our tax rate
would have been in sync with our prior estimate of about 31.5 percent, which remains the
tax rate we expect for the remainder of this year.
The tax rate in the first quarter of 2006 was about 24.5 percent, as we recognized a one
time benefit from favorable resolution of a prior year tax appeal and also the impact of the
2006 restructuring charges. In 2006, the benefit of the lower tax rate also added about
$0.10 per share to that quarter’s EPS.
Our first quarter earnings performance was one of our best on record, which is something
we are very proud of given the economic backdrop, and was driven by strong performance
by both of our Coatings segments and our Optical and Specialty Materials segment.
However, compared with the first quarter of 2006, the Commodity Chemical segment
earnings declined by about $40 million due to both, the decline in pricing I cited earlier and
by several large customer outages during the first six to eight weeks of the year. Our first
quarter Glass segment earnings were down by about $15 million compared with a year ago
as a result of the energy surcharge I mentioned earlier, and a $10 million loss on asset
write-offs associated with ongoing efforts to improve the profitability of our Fiber Glass
business.
Looking ahead, let me quickly comment that customers who had outages during the quarter
returned to a reasonable and consistent ordering pattern in the latter part of the first quarter.
I will provide some additional outlook as I review each of our business segments in a few
minutes.
Economic Indicators
Economic Indicators The next slide provides an overview of either our or
Global Insight’s current estimates of the relevant
1Q 2007
historic economic statistics. I will briefly discuss
(change from 1Q 2006)
U.S. Real GDP* 2%
these and how they relate to our business
U.S. Industrial Production* 3%
EEC Real GDP* 3%
performance, and I will also comment on our
China Real GDP* 9%
N.A. Vehicle Production -7%
economic outlook.
N.A. Light Vehicle Sales -1%
Western Europe Auto Production* 2%
Western Europe, New Registrations -1%
First with respect to automotive production, as we
U.S. Housing Starts* -25%
have stated many times, global automotive
U.S. Commercial Const. (Real Inv.)* 12%
production continues to expand. Due to the
*Estimates
overemphasis placed on continuing issues faced by
the U.S. domestic automakers, we continue to believe the ongoing global expansion in the
auto market is both misunderstood and undervalued by the equity market.
Global Insight estimates that global vehicle builds grew by 4 percent last year and about
12.5 percent over the past three years. This is consistent growth and is driven by
6. 6
substantial growth in emerging regions, while production in mature regions has varied only
slightly, either up or down.
In the first quarter, North American light vehicle production is expected to have been down
by about 7 percent. Meanwhile, Western European vehicle production grew 2 percent,
while Eastern European and Asian production grew by high single digits.
The volumes in our Automotive Coatings business have continued to perform at or above
the overall market with 3 percent global volume growth. Meanwhile, our North American
Automotive Glass business performed below the North American market with a 12 percent
volume drop. I will explain the reasons for these diverse performances when I review each
of our business segments.
As we said entering the year, we expect North American softness from the second half of
last year to continue in the early part of this year, followed by an upward tick later in the
year. We expect modest growth in Western Europe and high single digit growth in Eastern
Europe. Lastly, we believe the emerging regions will continue to grow rapidly. Overall, our
view remains very positive on growth in the overall global automotive market, with global
growth rates being in sync with recent history.
Moving to industrial production, we continue to see robust industrial growth occurring in
emerging regions, offsetting lower or even negative growth in some of the more mature
regions. We have been focusing our investments in growth, both acquisitions and
expansions of existing businesses, in these emerging economies.
North American industrial production is estimated to have improved by about 3 percent
year-over-year, in the first quarter, with Western Europe also producing a positive figure.
Industrial activity continued to flourish in the emerging regions such as China, where growth
rates remained in the mid-teens.
Industrial production remains the one metric that most closely correlates to PPG volumes.
During the quarter, our volumes in the U.S. and Canada were up about 1 percent, up 8
percent in Europe, and improved 12 percent in Asia.
Looking ahead, we expect high rates of growth in industrial production in emerging regions
to continue as these regions displace products from more mature regions.
High labor content products remain the focal point, while products with much lower labor
content, such as coatings, where labor content is typically less than 10 percent of the cost,
will remain more regional with transportation costs acting as a sturdy barrier to globalization.
Finally on the construction markets, we have continued to see the U.S. commercial and
U.S. residential construction markets move in opposite directions.
The dramatic slowdown in residential construction which began in mid-2006 has continued
into 2007, with a contraction of housing starts resulting in an estimated year-over-year 25
percent decline. Conversely, commercial construction has grown about 12 percent over the
same period.
7. 7
As we reiterated many times, our Performance Glazings, architectural glass business with
its value-added product focus, is more highly correlated to commercial construction. During
the quarter we recognized volume growth in Performance Glazings, and only a slight 2
percent volume decline in our North American Architectural Paints business.
Looking at the remainder of the year, we don’t expect to see any substantive recovery in the
residential construction market until at least the third quarter. Meanwhile with respect to
commercial construction, the life cycle of the average size commercial construction project
is about 14 months. Therefore, we fully expect the recent activity increases to carry forward
well into 2007 for the products that we supply.
Now let’s discuss our overall economic outlook and several other key topics.
Key Topics and Outlook
Key Topics
In North America, we expect GDP growth to remain
fairly stable with the first quarter. Housing will
continue to act as a notable drag on the overall
economy, and although we expect U.S. automobile
• Economy
production to slightly improve, it will still be down
• Energy & Raw Materials
year-over-year. These same factors will continue
• Legacy Issues
to have somewhat similar impacts on our volumes
in the businesses that supply these sectors.
• Business Performance
Meanwhile other market sectors, such as
aerospace and commercial construction, will continue to experience high activity levels and
we will benefit from our leading products in these markets.
Many other economic statistics will also remain fairly steady. We anticipate corporate profit
growth to slow, but corporate balance sheets to remain sound and, as we anticipated, the
export market did and will likely continue to expand given lower U.S. energy costs and the
current foreign exchange environment.
As we said at the outset of the year, we believe the overall economy is on sound footing.
We said then and reiterate now, that employment figures are good and fairly stable, inflation
is in check, and consumer spending remains consistent. Any downturn in these statistics
would give us reason for concern, but the most recent data indicates these statistics are
stable.
Moving to Europe we expected several headwinds to slow the growth rates versus 2006.
These headwinds are a change in taxation, a stronger Euro which changes import/export
economics, higher interest rates, and slower first half growth in the North American
economy which will impact the European export market.
While some of these headwinds were present, Europe continued to grow rapidly in the first
quarter. The difference versus our projection was that business spending improved, as did
employment. Employment and productivity improved due, in part, to the gradual relaxation
of labor laws. These two economic factors are very positive as they move Europe from an
export driven focus to an internal focus.
8. 8
While we believe the headwinds I previously mentioned will eventually impact the growth
rate, we now believe the higher activity levels within Europe will result in a consistent annual
growth rate when compared with 2006. Also, we continue to expect growth in Eastern
Europe to outperform Western Europe by roughly two-to-one.
With respect to Asia, once again, and simply put, we expect the very high growth we have
evidenced to continue. As I have already discussed, our volume performance in both
Europe and Asia for at least the past year has been excellent.
Overall, we expect global GDP growth to continue to be in the range of about 4 percent,
with both the North American and Western European rate at about 2.5 percent. We expect
China GDP growth to be in the 8 percent - 10 percent range.
I will conclude my economic discussion by stating that our current expectation of stable
economic conditions gives us continued optimism regarding the prospects for our
businesses. We have stated many times that our preference is to operate in markets with a
disciplined growth rate where leading technologies and services act to differentiate
companies. Our continued volume growth over the past year, which, once again, actually
accelerated this quarter, provides true indication of our abilities to thrive in these stable
economic times.
Now let’s shift our discussion to energy costs and raw materials.
In the quarter, our primary energy cost, natural gas, declined markedly versus the first
quarter of 2006. I will remind you that the 2006 first quarter costs were elevated following
the two U.S. hurricanes, Katrina and Rita, which occurred in late 2005. Our first quarter
2007 unit cost for natural gas was about $7.50. In the first quarter of 2006, our natural gas
cost was about $10.00.
For those of you who may not know us well, we use 60 to 70 trillion BTUs of natural gas a
year to generate power for the production of chlorine and caustic soda, and to produce
glass and fiber glass. So if natural gas unit costs change by one dollar per million BTU, our
pre-tax costs change by about 60 to 70 million dollars on an annual basis. In the first
quarter, our year-over-year natural gas costs declined by about $40 million.
In addition to natural gas, we have been experiencing increases related to coatings raw
material costs. The cost of materials, which includes petroleum-based materials, is the
largest component of production costs for coatings. These costs remained stubbornly high
as a result of, among many other things, consistently high oil prices.
We expected these costs to increase in 2007, but very modestly. During the quarter, our
coatings raw material costs increased but just about 1 percent, driven primarily by shortages
of a few raw materials.
Moving ahead and as recent history has indicated, we believe that we will continue to see
price volatility in the energy markets as shifts occur in global supply and demand. We also
believe geopolitical issues and speculation will remain prevalent factors in pricing.
Regarding natural gas costs, we have hedged the cost of about one-third of our second
quarter 2007 natural gas purchases at a unit price of about $7.50.
9. 9
With respect to coatings raw materials, the pricing environment remains fragile from a
supplier perspective. Recent oil price trends have kept pricing intact, however, supply and
demand factors are tilting toward a buyer’s market. We still stand behind our original 2007
forecast that as a worst-case scenario, we expect only slight raw material escalation for
2007. However, we have experienced higher transportation costs and we expect the higher
level of cost to remain.
Now before I review our business results in more detail, I typically provide an update on our
proposed asbestos settlement. As we said in our previous update, we are analyzing a
variety of options which may include plan modifications, and reconsideration or appeals of
the bankruptcy court opinion. Given the overall complexity of the issue, we are not able to
offer any time line upon which any next step will be taken. For those not familiar with the
details of the proposed settlement, please refer to page 53 of our 2006 Annual Report and
Form 10-K and our first quarter 2007 Form 10-Q which will be filed shortly.
Now let’s discuss our businesses performance.
Business Segment Performance – Performance
Business Performance –
Performance & and Applied Coatings
Applied Coatings Slide number 10 details our excellent results in our
Performance and Applied Coatings segment. In
1st Quarter
2007 2006 $ Change % Change
the quarter sales grew by $177 million or 26
Sales $ 855 $ 678 $ 177 26%
percent. This substantial increase resulted in
Segment Earnings $ 121 $ 105 $ 16 15%
achievement of both a first quarter and all-time
Yr. To Yr. % Change - Sales
sales record. Acquisitions added just under 20
Sales Volume Price Currency Acq./Other
Total Performance &
percent growth with price, volume and currency
Applied Coatings 26% 2% 2% 3% 19%
Aerospace 36% 12%
also contributing to the sales gains. Also, all
Architectural Finishes 26% -2%
Automotive Refinish 23% 3%
regions contributed at least 15 percent sales
growth each.
Our earnings grew $16 million, or about 15 percent, reflecting our volume growth and
incremental acquisition earnings. Regarding the acquisition earnings, as I indicated earlier,
we expect last year’s acquisitions to deliver industry type margins in the year 2007.
However, we did not and do not expect these acquisitions to achieve our industry leading
margins this year. So while we are delivering as expected, when combined with our
ongoing businesses, they will still have the effect of tempering down our operating margins.
Our Architectural business sales grew 26 percent, supported by acquisitions, and we also
achieved a new first quarter and all-time quarterly sale records. The growth results are on
top of 25 percent growth last year.
Volumes were down slightly, about 2 percent, as lower volumes in our professional
channels, both our stores and distributors, were partially offset by slightly higher volumes in
our national accounts channel.
Looking ahead, our acquisitions will continue to provide an excellent growth base, however
we don’t expect any immediate improvement in the U.S. housing market which has
hampered our overall volume growth.
10. 10
In Aerospace, our excellent double-digit growth continued with sales improving by 36
percent, supported by both volume growth and acquisition growth. This resulted in
establishment of a new first quarter and all-time quarterly sales record. The growth was
also very broad geographically with each region posting fairly similar growth rates. We have
now achieved double-digit growth in 8 of the last 10 quarters.
Our future growth prospects also appear very bright as we significantly grew our sales
content on the new Boeing 787 Dreamliner, for which significant production ramp-up has
not yet begun.
Our Automotive Refinish business also posted excellent results this quarter growing 23
percent, with about one-half attributed to acquisitions. A strong Euro also benefited sales.
Our volumes grew in both of our primary markets, the U.S. and Europe. Meanwhile, our
Asian sales were up 50 percent, supported by acquisitions and reflecting our growth focus
in that region.
In summary, our Performance and Applied Coatings segment has delivered on both organic
growth, as well as successfully integrating our acquisitions. Our expectations are for a
continuation of this successful execution.
Business Segment Performance – Industrial
Business Performance –
Coatings
Industrial Coatings
Moving to the next slide illustrating our Industrial
1st Quarter
Coatings segment, our sales rose by $100 million
2007 2006 $ Change % Change
dollars or 13 percent and we set a new first quarter
Sales $ 869 $ 768 $ 101 13%
Segment Earnings $ 95 $ 91 $ 4 4%
and all-time quarterly sales record. Acquisitions
contributed 7 percent, currency added 4 percent,
Yr. To Yr. % Change - Sales
while volume and price added 1 percent each.
Sales Volume Price Currency Acq./Other
Total Industrial Coatings 13% 1% 1% 4% 7%
Automotive OEM 14% 3%
This remains one of our most global business
Industrial 9% -4%
Packaging 22% 14%
segments with nearly 20 percent of our sales from
the segment coming from Asia and no geographic
region accounting for more than 40 percent of the total segment. This geographic diversity
and our acquisitions have aided this business in weathering slowing in several U.S. end-
markets. Our Asian sales grew by 80 percent versus last year, supported by both volume
growth and our acquisitions. In Europe, our sales grew by just below 20 percent.
Earnings in the segment improved modestly, as higher raw materials and other inflation was
not fully offset by our pricing initiatives. Contributing to earnings were improved volumes
and earnings from acquisitions.
Let me comment just briefly on each of our Industrial Coatings segment businesses.
First let me discuss our Packaging Coatings, where we also set a new first quarter and all-
time quarterly sales record. Our sales volumes grew by 13 percent with double-digit
percentage volume growth in each region of the world. This is on top of high single digit
volume growth in the first quarter of 2006 and is a reflection of our continuing market share
gains in this business. Currency contributed 6 percent.
11. 11
We expect our strengthening market position to contribute once again in the second
quarter.
Industrial Coatings business sales improved by 9 percent to a new first quarter record.
Negative volumes were more than offset by acquisitions and currency gains. Our North
American volumes were down due to lower industrial customer sales into automotive parts
and accessories and other domestic end-markets. Our European and Asian volumes both
grew by high single digit percents.
Asia is now our second largest region in this business and sales grew by over 70 percent
year-over-year, assisted by our prior year acquisitions.
Looking ahead, we expect an equally challenging North American market in the second
quarter, but also anticipate an equally robust European and Asian market.
Next, our Automotive OEM Coatings business grew by 14 percent and also achieved a new
first quarter and all-time quarterly sales record. Volumes grew 3 percent while acquisitions
and currency added 7 percent and 5 percent respectively. Pricing was down, but just
slightly.
We delivered positive volume growth, once again, in North America despite the overall
industry light vehicle production figures falling nearly 7 percent. This is due to our strong
customer profile in North America servicing both the “old domestics” and the transplant
manufacturers. Also, Europe continued to post very positive volume gains partially due to
market share gains.
As I discussed earlier, we expect the North American automotive market to only slightly
improve in the second quarter. We expect the other regional markets to also be stable in
comparison with the first quarter.
In summary, we gained market share in several businesses in our Industrial Coatings
segment, and our acquisitions are beginning to deliver to the bottom line. However, we
were also negatively impacted by several industrial customers supporting U.S. end-markets
that remain very challenged.
Looking ahead, these U.S. end-market challenges are expected to exist further into 2007,
and we continue to expect this segment to deliver by relying on our technologies, services
and business leadership positions.
Business Performance –
Optical & Specialty Business Segment Performance – Optical
Products and Specialty Materials
1st Quarter
As detailed on slide number 12, our Optical and
2007 2006 $ Change % Change
Sales $ 280 $ 232 $ 48 21%
Specialty Materials segment also generated top-
Segment Earnings $ 67 $ 56 $ 11 20%
line growth of over 20 percent driven by excellent
volume performance. Acquisitions and currency
Yr. To Yr. % Change - Sales
Sales Volume Price Currency Acq./Other
also benefited sales and assisted us in establishing
Total Optical &
Specialty
a new first quarter and all-time quarterly sales
Materials 21% 12% 0% 4% 5%
Optical 19%
record.
Specialty Materials 27%
12. 12
Earnings for the quarter were also a first quarter and all-time record, growing 20 percent, as
strong volume gains more than offset higher, growth focused, advertising costs.
Optical Products sales grew by 19 percent which included strong growth rates in emerging
regions, where we have been focused on improving our penetration rates. Acquisitions
added to our sales and, just as important, broadened our product offering.
Our heritage of growth in this business is well known with compounded annual sales growth
of around 15 percent since the year 1992. We certainly expect a continuation of this growth
trend, supported by our expected level of higher advertising spending.
Our Silicas business recognized modest growth of about 3 percent primarily on higher
pricing, as the business continues to work to offset the multi-year rise that occurred in
natural gas pricing. Volumes were down slightly in recognition of the North American auto
market, while currency aided sales.
Our Fine Chemicals business grew sales significantly, reflecting sales of an active
pharmaceutical intermediate for the Tamiflu vaccine. As we have mentioned in the past,
this business tends to be “lumpy” due to order and ship patterns, but we are pleased with
the improved performance.
Our Optical and Specialty Materials segment grew nicely and produced excellent financial
returns on the growth this quarter. This segment remains poised to continue to lead our
growth initiatives as we move ahead.
Business Segment Performance – Commodity
Chemicals
Business Performance –
Commodity Chemicals Shifting to the next slide detailing our Commodity
Chemicals segment, year-over-year sales declined
1st Quarter
by nearly 8 percent as pricing was down notably
2007 2006 $ Change % Change
Sales $ 371 $ 401 $ (30) -7%
from the prior year’s all-time record high levels
Segment Earnings $ 44 $ 87 $ (43) -49%
reflecting, in part, considerably lower natural gas
input costs.
Yr. To Yr. % Change - Sales
Sales Volume Price Currency Acq./Other
Total Commodity
Our year-over-year volumes improved despite the
Chemicals -7% 9% -16% 0% 0%
customer outages which I referenced earlier,
however our production facility utilization and
product mix were not optimal. The customer outages occurred in the first six to eight weeks
of this quarter and in the latter stages of the quarter customer orders returned to a
reasonable and consistent level.
Earnings were down primarily as a result of lower pricing, higher maintenance costs and the
less optimal manufacturing mix, but were partially offset by lower natural gas costs.
Looking ahead, the current level of customer orders, low inventories and announced price
increases on both chlorine and caustic soda all bode well for our second quarter in
comparison with our first quarter performance this year.
13. 13
Business Segment Performance - Glass
Business Performance – As detailed on slide number 14, Glass segment
Glass
sales dropped 3 percent in the first quarter,
primarily on lower volumes. Currency favorability
1st Quarter
2007 2006 $ Change % Change
was offset by slightly lower pricing.
Sales $ 542 $ 559 $ (17) -3%
Segment Earnings $ 20 $ 35 $ (15) -43%
Looking at earnings, Glass segment results fell by
Yr. To Yr. % Change - Sales
$15 million in the quarter, due largely to a $10
Sales Volume Price Currency Acq./Other
Total Glass -3% -3% -1% 1% 0%
million write-off of our investment in a Fiber Glass
Automotive Glass -13% -12%
joint venture. As we have mentioned before, we
ARG & Service 1% -1%
Performance Glazings -5% 1%
Fiber Glass 7% 3%
are well into a multi-year action plan focused on
transforming our Fiber Glass business’s supply
chain and improving profitability. These efforts have included, from time-to-time, non-core
asset disposals or write-offs. Our write-off this quarter resulted from our conclusion that we
are not be able to recover the book value amount of our joint venture investment.
In addition to this write-off, and as we mentioned last quarter would occur, segment
earnings were negatively impacted by about $8 million dollars due to a negative year-over-
year delta associated with the timing of our Performance Glazing’s energy surcharge in the
first quarter of 2006. Our energy surcharge is on a quarter lag and the beneficial first
quarter 2006 surcharge reflected the all-time high PPG energy costs in the fourth quarter of
2005.
From an operations basis, we performed very well and offset the shortfall in sales with
improved product mix, manufacturing performance and lower overhead costs.
Now let’s look individually at our Glass business units.
Automotive OEM Glass volumes dropped by a notable 12 percent, in sync with production
declines at our domestic U.S. automotive customers. Both Daimler-Chrysler and General
Motors took notable production downtime during the quarter. Also, during the quarter we
placed a strong focus on cost management that resulted in minimizing the earnings impact
of the sales shortfall. The production schedule for our U.S. customer base looks improved
during the second quarter, but only slightly.
Automotive Replacement Glass and Services sales grew slightly during the quarter, as
positive pricing offset a small drop in volumes. This business also achieved cost
reductions. As I have stated many times, this market remains highly competitive and price
sensitive.
Fiber Glass sales grew by 7 percent as good European volume growth was coupled with
beneficial currency. U.S. volumes were lower partially due to the U.S. auto and housing
markets. Of importance, our global sourcing strategies are beginning to yield earnings
benefits and our Asian joint ventures continue to deliver positive results.
Next, Performance Glazings sales declined 5 percent during the quarter due largely to the
absence of the energy surcharge which we mentioned previously. Volume growth was
positive as we continued to see the growth in sales of our value added products into the
commercial construction market which, once again, more than offset the negative volume
14. 14
impact of slower residential construction. As we stated many times, this business is much
more closely aligned to commercial construction and our results, in the wake of a serious
housing downturn, certainly confirm our assertion.
In summary for the Glass Segment, we remain keenly focused on improving results and
continue to recognize that despite our interim improvement this year. To date, several of
our glass businesses still need to substantially improve their full year financial performance
to meet our corporate objectives.
Now let’s move to our cash uses during the quarter.
Use of Cash
Slide number 15 details our prioritized cash uses,
Uses of Cash
which most of you have heard us discuss for some
time. Our overriding goals for our cash deployment
• Prudently Fund Businesses
are to strengthen our businesses and provide for
sustainable benefits to shareholders.
• Dividends
• Debt
First is prudently funding our businesses through
Pensions
organic capital spending necessary to keep the
businesses healthy and competitive. Our capital
• Acquisitions
spending, excluding acquisitions, in the first quarter
• Stock Repurchase
was right around $100 million. Our annual target is
about 3 percent - 4 percent of our sales.
Next, we continue our tradition of rewarding shareholders with annual returns in the form of
dividends as evidenced by the fact that we have paid uninterrupted dividends for over 100
years. Our Board of Directors increased the quarterly dividend to $0.50 per share at our
January board meeting, our second dividend increase in twelve months.
Regarding debt, our debt-to-capital is about 30 percent which is within our desired range of
30 percent to 40 percent.
With respect to pensions, we mentioned last quarter that we have no mandatory funding
requirements until at least 2009 to our U.S. pension fund, however we may make voluntary
contributions this year of up to $200 million. During the first quarter, we made a $100
million voluntary contribution.
Next on our list are acquisitions, and as mentioned earlier we acquired the architectural and
industrial coatings business of Renner Sayerlack S.A. during the first quarter. We continue
to evaluate appropriate acquisitions.
Regarding our last prioritized use of cash, share repurchases, we spent about $50 million
during the quarter, repurchasing just under 835 thousand shares of PPG stock. We
currently have about 6.8 million shares remaining on our current board authorized share
repurchase program.
Let me conclude our discussion on cash by just saying that we have an excellent legacy of
cash generation, and an equally excellent and important legacy of using that cash to reward
our shareholders.
15. 15
Conclusion
In conclusion, let me summarize the quarter for our company:
• We have delivered all-time record quarterly sales and our earnings-per-share were one
of our best first quarters on record,
• Both of our Coatings segments and our Optical and Specialty Materials segment,
delivered double-digit sales growth
• We have continued to more than weather a significant U.S. downturn in residential
construction and also lower North American automotive production,
• We posted strong organic growth results in both Europe and Asia
• We are successfully executing our integration strategies and delivering on our financial
commitments relating to our acquisitions,
• We continued our penetration into emerging regions, either organically or through
acquisition, with over 70 percent sales growth in Asia and 30 percent growth in Latin
America,
• We made a $100 million voluntary contribution to our U.S. pension fund,
• And, as has been our long standing heritage, we once again rewarded our shareholders
with higher dividends and also repurchased over $50 million in PPG stock.
As we look into next quarter, we see a similar economic backdrop. We do expect quarter-
over-quarter improvement in certain businesses, such as Commodity Chemicals where our
outlook is more positive. However, the challenges faced by several U.S. economic sectors,
such as housing and autos, are expected to remain a moderating influence.
We will continue to explore strategic options related to our Automotive OEM Glass,
Automotive Replacement Glass and Services and Fine Chemicals businesses. Additionally,
we will continue to evaluate appropriate acquisitions with the goal of strengthening our
portfolio.
In conclusion, we are very pleased with both our growth in sales and earnings this quarter.
These results provide measurable proof that we are properly delivering on our growth
strategies, and that our globalization provides us with the ability to minimize economic
downturns in a single region.
We remain committed to executing our strategies and to growing our company, which will
allow us to provide sustainable returns to our shareholders.
16. 16
PPG INDUSTRIES, INC.
Business Segment Information
1st Quarter Results
(Millions of Dollars)
Net Sales Segment Income
2007 2006 2007 2006
INDUSTRIAL COATINGS $ 869 $ 768 $ 95 $ 91
PERFORMANCE and APPLIED COATINGS 855 678 121 105
OPTICAL and SPECIALTY MATERIALS 280 232 67 56
COMMODITY CHEMICALS 371 401 44 87
GLASS 542 559 20 35
SUBTOTAL $ 2,917 $ 2,638 $ 347 $ 374
LEGACY COSTS (NOTE A) (5) (12)
ASBESTOS SETTLEMENT - NET (9) (9)
INTEREST - NET (19) (17)
RESTRUCTURING - (35)
UNALLOCATED STOCK BASED
COMPENSATION (NOTE B) (9) (8)
OTHER UNALLOCATED CORP. EXPENSE - NET (25) (24)
INCOME BEFORE INCOME TAXES, AND
MINORITY INTEREST $ 280 $ 269
Note A:
Legacy costs include current costs related to former operations of the Company, including certain environmental
remediation, pension and other postretirement benefit costs and certain charges which are considered to be
unusual or non-recurring.
Note B:
Unallocated stock based compensation includes the cost of stock options, restricted stock units and contingent
share grants which are not allocated to the operating segments.
17. 17
PPG INDUSTRIES, INC.
Condensed Statement of Operations
1st Quarter Results
(Millions of Dollars)
3 Months Ended
March 31,
2007 2006 % Change
Net Sales $ 2,917 $ 2,638 10.6
Cost of Sales 1,885 1,691
Selling and Other 622 535 16.3
Depreciation 87 82 6.1
Interest 22 20
Amortization 14 9 55.6
Asbestos Settlement - Net 9 9
Business Restructuring - 35
Other - Net (2) (12)
Income Before Income Taxes
280 269
and Minority Interest
68
Income Tax Expense 66 3.0
18
Minority Interest 19
5.4
Net Income $ 194 $ 184
6.3
Earnings per common share $ 1.18 $ 1.11
Earnings per common share --
5.4
assuming dilution $ 1.17 $ 1.11
(0.5)
Average shares outstanding 164.6 165.4
Average shares outstanding --
(0.4)
assuming dilution 165.9 166.5
18. 18
Forward-Looking Statement
Statements contained herein relating to matters that are not historical facts are forward-
looking statements reflecting PPG’s current view with respect to future events and financial
performance. These matters involve risks and uncertainties that may affect PPG’s
operations, as discussed in PPG’s filings with the Securities and Exchange Commission
pursuant to Sections 13(a), 13(c) or 15(d) of the Securities Exchange Act of 1934, as
amended, and the rules and regulations promulgated thereunder. Accordingly, many
factors may cause actual results to differ materially from the forward-looking statements
contained herein. Such factors include increasing price and product competition by foreign
and domestic competitors, fluctuations in cost and availability of raw materials and energy,
the ability to maintain favorable supplier relationships and arrangements, economic and
political conditions in international markets, foreign exchange rates and fluctuations in such
rates, the impact of environmental regulations, unexpected business disruptions, and the
unpredictability of existing and possible future litigation, including litigation that could result if
the asbestos settlement discussed in PPG’s filings with the Securities and Exchange
Commission does not become effective. However, it is not possible to predict or identify all
such factors. Consequently, while the list of factors presented here is considered
representative, no such list should be considered to be a complete statement of all potential
risks and uncertainties. Unlisted factors may present significant additional obstacles to the
realization of forward-looking statements. Consequences of material differences in results
compared with those anticipated in the forward-looking statements could include, among
other things, business disruption, operational problems, financial loss, legal liability to third
parties and similar risks, any of which could have a material adverse effect on PPG’s
consolidated financial condition, operations or liquidity. All information in this presentation
speaks only as of April 19, 2007, and any distribution of this presentation after that date is
not intended and will not be construed as updating or confirming such information.