1. Investorfactsheet 2008
NYSE: PEG
Company Profile
Public Service Enterprise Group (PSEG) is one of the ten largest electric companies in the U.S., with three principal
subsidiaries. PSEG Power is a major supplier of electric energy in the constrained Northeast and Mid-Atlantic markets;
PSE&G is a regulated public utility company engaged in the transmission and distribution of electricity and gas in New Jersey;
PSEG Energy Holdings through its Global subsidiary is focused on operating segments in the electric industry as its
Resources subsidiary is focused on financial investments in the energy industry, while managing potential tax risk associated
with its lease portfolio.
PSEG is well situated to benefit from a convergence of market forces that require investing in critical infrastructure as policy
makers focus on reducing the impact of demand on the environment.
Right Assets... Right Markets... At the Right Time... Investment Highlights
Strengthened balance
Large, diverse PSEG Power operates in Value of capacity
sheet supports capital
low-cost, base-load tightly constrained and being recognized in
investments
and load-following growing markets constrained areas
generating fleet Return of cash to
PSEG Power’s nuclear Moves to control carbon
shareholders through
Reliable electric and and coal base load benefit our nuclear
divided and share
gas distribution and capacity operate in based fleet
repurchase program
transmission systems markets with price set Brownfield development
provides discipline to
by gas
Portfolio of investments opportunities at
investment process
in domestic and T&D assets provide existing sites
Earnings growth and yield
International electric service in a modest
T&D set to benefit from
provide opportunity for
assets and leases growth market with new investment
double digit shareholder
reasonable regulation
returns of 10 - 13%
Financial Highlights
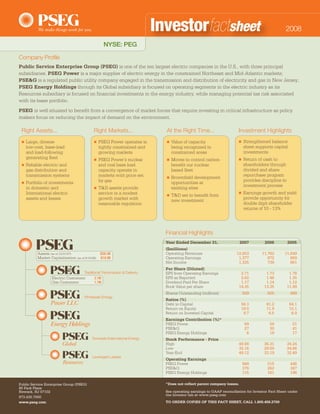
Year Ended December 31, 2007 2006 2005
($millions)
Operating Revenues 12,853 11,762 11,849
Assets (as of 12/31/07): $28.4B
Market Capitalization (as of 8/15/08): $19.9B Operating Earnings 1,377 872 869
Net Income 1,335 739 661
Per Share (Diluted)
Traditional Transmission & Delivery EPS from Operating Earnings 2.71 1.73 1.78
EPS as Reported 2.62 1.46 1.35
Electric Customers: 2.1M
Dividend Paid Per Share
Gas Customers: 1.17 1.14 1.12
1.7M
Book Value per share 14.35 13.35 11.99
Shares Outstanding (millions) 509 505 489
Wholesale Energy
Ratios (%)
Power LLC Debt to Capital 56.3 61.2 64.1
Return on Equity 19.0 11.9 15.1
Return on Invested Capital 9.7 6.5 6.9
Earnings Contribution (%)*
PSEG Power 69 59 51
PSE&G 27 30 41
PSEG Energy Holdings 8 18 17
Domestic/International Energy Stock Performance - Price
High 49.88 36.31 34.24
Low 32.16 29.50 24.66
Year-End 49.12 33.19 32.49
Leveraged Leases
Operating Earnings
PSEG Power 949 515 446
PSE&G 376 262 347
PSEG Energy Holdings 115 161 196
*Does not reflect parent company losses.
Public Service Enterprise Group (PSEG)
80 Park Plaza
See operating earnings to GAAP reconciliation for Investor Fact Sheet under
Newark, NJ 07102
the Investor tab at www.pseg.com
973.430.7000
TO ORDER COPIES OF THIS FACT SHEET, CALL 1.800.458.2700
www.pseg.com
2. Investorfactsheet 2008
NYSE: PEG
PSEG Power LLC is a major electric generation company with 13,300 MW of base-load, intermediate and load following capability operating
in attractive markets in the Northeast with operating control of additional 2,000 MW of capacity in Texas..
PSEG Power’s assets are located in attractive markets with expansion capability.
Power LLC
Fuel Diversity 2007 Energy Produced 2007
19% 1%
8%
Bethlehem 26%
System
Energy Center
Interface 54%
1%
25%
47%
Albany 18%
1%
New
Haven
Bridgeport Total MW: 13,300 Total GWh: 53,200
Keystone
Hudson
Bergen
Conemaugh
Kearny Nuclear
Mercer Gas
Essex
Peach Bottom
Pumped Storage Oil
Linden
Coal
Sewaren
Hope Creek
Edison
Salem
Burlington
National Park
Power’s assets along the dispatch curve position the company to serve
full requirement load contracts.
Power LLC
Nuclear Dispatch Cost ($/MWh) National Park
Sewaren 6
Coal
Mercer 3
Combined Cycle Kearny 10-11
Steam
Burlington 8-9-11
GT Peaking
Edison 1-2-3
Essex 10-11-12
New
Linden 5-8 / Essex 9
Haven
Burlington 12 / Kearny 12
Bergen 1
Sewaren 1-4
Linden 1-2 Hudson 1
Yards
BEC Creek
Peach Keystone Bridgeport Bergen 2
Hope Bottom Salem
Creek Mercer 1-2
Conemaugh Hudson 2
Baseload units Load Following units Peaking units
Energy Revenue X X X
Capacity Revenue X X X
Ancillary Revenue — X X
Duel Fuel — X X
Nuclear CF 90% to 92% — —
Coal CF 85% to 90% 50% to 70% —
Combined Cycle CF — 30% to 50% —
Peaking CF — — 2% to 10%
Public Service Enterprise Group (PSEG) This document contains forward-looking information. Actual results may differ from those anticipated. Information describing the significant factors that
80 Park Plaza could cause results to differ from those anticipated are described in Public Service Enterprise Group’s filings with the SEC, which are available on our
Newark, NJ 07102 website www.pseg.com
973.430.7000
www.pseg.com
3. Investorfactsheet 2008
NYSE: PEG
PSE&G is a stable electric and gas distribution and transmission company rated top quartile for reliability providing service in a mature
service territory in New Jersey.
Electric and Gas Distribution Statistics
December 31, 2007 Electric Gas
Customers 2.1 million 1.7 million
NJ is ranked 2rd nationally in
Electric Sales, Gas Sold and Transported 44,709 GWH 3,502 M Therms
personal income per capita
Historical Annual Load Growth 2003-2007 1.6% (0.2%)
Mid-Atlantic ReliabilityOne
Projected Annual Load Growth 2008-2012 1.0% 0.4%
Award winner six years running
Solid regulatory relationships
Transmission Statistics
on traditional utility matters
December 31, 2007
Gas Territory Network Circuit Miles 1,429
Billing Peak (MW) 10,378*
Electric Territory
Historical Annual Load Growth 2003-2007 1.3%
Combined Electric &
Projected Annual Load Growth 2008-2012 1.4%
Gas Territories
Recognized as America’s Most Reliable Electric Utility
2007 Actual 2012 Base Plan
Rate Base = $6.4B Rate Base = $10.2B
12% 22% Gas Distribution
30%
34%
Electric Distribution
54% Electric Transmission
48%
iPower, PSE&G’s
T&D Expansion Opportunities PSE&G EMP Strategies new Customer System
Renewables/Emissions Strategies
PJM backbone transmission and Leveraging State of the Art
RTEP projects Technology – SAP CCS
Solar initiative
Sub-transmission to Transmission Enabling GPS technology to
reliability upgrades improve dispatching
Demand-Side Strategies
Distribution System Reinforcements Creating new opportunities through
Advanced Metering Infrastructure
web-based empowerment
Carbon Abatement
Moving to a platform with full
PSE&G Facility and System Efficiency AMI capability
Addressing customer operational
and financial measures that are not
achieving strategy
This document contains forward-looking information. Actual results may differ from those anticipated. Information describing the significant factors that
Public Service Enterprise Group (PSEG)
could cause results to differ from those anticipated are described in Public Service Enterprise Group’s filings with the SEC, which are available on our
80 Park Plaza
website www.pseg.com
Newark, NJ 07102
973.430.7000
www.pseg.com
4. Dividendfactsheet 2008
NYSE: PEG
PSEG Dividends – A New Century
PSEG is continuing its remarkable record of paying common dividends. The year 2008 represents the 101st year
PSEG or its predecessor company will be paying dividends to the holders of its common stock. PSEG has paid dividends
each year since 1907 – a record only matched by General Electric and Exxon Mobil.
The board of directors of PSEG declared a 10% increase in the quarterly common dividend on January 15,
2008 as it also announced a 2-for-1 stock split. On a post-split basis, the quarterly dividend was raised to 32.25
cents per share from 29.25 cents per share. The new annual common dividend rate is $1.29 per share on a post-split basis.
This is the fifth consecutive year that PSEG has raised its common dividend. This latest increase by the board
resets the dividend to a payout of earnings in the middle of a range (40-50%) which provides flexibility for growth and
investment given PSEG’s mix of earnings and assets. The largest contributor to PSEG’s earnings is PSEG Power, a com-
petitive power generation company, followed by PSE&G, a regulated electric and gas transmission and distribution
company, and, to a lesser extent PSEG Energy Holdings. The resetting of the dividend provides PSEG with flexibility for
dividend growth and new investment. (All future changes in the common dividend are subject to board approval.)
PSEG Annual Dividend Rate*
$1.40
5-year rate of growth: 4.1%
10-year rate of growth: 2%
$1.29
$1.20
$1.17
$1.14
$1.12
$1.10
$1.08 $1.08 $1.08 $1.08 $1.08
$1.00
1999 2000 2001 2002 2003 2004 2005 2006 2007 2008E
Payout
69% 59% 59% 111% 62% 70% 63% 66% 43% 44%**
Ratio
5.9% 5.7% 4.9% 6.4% 5.6% 4.8% 3.8% 3.5% 2.8% 3.3%**
Yield
*Annual dividend rate reflects 2:1 stock split effective on February 4, 2008.
**2008 yield calculation based on PEG stock price as of March 30, 2008 (adjusted for stock split); payout ratio based on mid-point of 2007 and 2008 earnings guidance.
Payout ratio = percent of income paid to shareholders as common dividends; Yield = annual dividend as a percent of the average stock price of the year.
Public Service Enterprise Group (PSEG)
80 Park Plaza
Newark, NJ 07102
973.430.7000
www.pseg.com