1. ConocoPhillips
Houston, Texas 77079
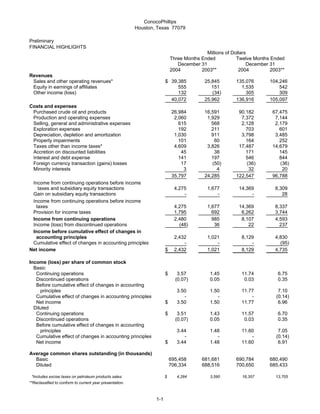
Preliminary
FINANCIAL HIGHLIGHTS
Millions of Dollars
Three Months Ended Twelve Months Ended
December 31 December 31
2004 2003** 2004 2003**
Revenues
Sales and other operating revenues* $ 39,385 25,845 135,076 104,246
Equity in earnings of affiliates 555 151 1,535 542
Other income (loss) 132 (34) 305 309
40,072 25,962 136,916 105,097
Costs and expenses
Purchased crude oil and products 26,984 16,591 90,182 67,475
Production and operating expenses 2,060 1,929 7,372 7,144
Selling, general and administrative expenses 615 568 2,128 2,179
Exploration expenses 192 211 703 601
Depreciation, depletion and amortization 1,030 911 3,798 3,485
Property impairments 101 60 164 252
Taxes other than income taxes* 4,609 3,826 17,487 14,679
Accretion on discounted liabilities 45 38 171 145
Interest and debt expense 141 197 546 844
Foreign currency transaction (gains) losses 17 (50) (36) (36)
Minority interests 3 4 32 20
35,797 24,285 122,547 96,788
Income from continuing operations before income
taxes and subsidiary equity transactions 4,275 1,677 14,369 8,309
Gain on subsidiary equity transactions - - - 28
Income from continuing operations before income
taxes 4,275 1,677 14,369 8,337
Provision for income taxes 1,795 692 6,262 3,744
Income from continuing operations 2,480 985 8,107 4,593
Income (loss) from discontinued operations (48) 36 22 237
Income before cumulative effect of changes in
accounting principles 2,432 1,021 8,129 4,830
Cumulative effect of changes in accounting principles - - - (95)
Net income $ 2,432 1,021 8,129 4,735
Income (loss) per share of common stock
Basic
Continuing operations $ 3.57 1.45 11.74 6.75
Discontinued operations (0.07) 0.05 0.03 0.35
Before cumulative effect of changes in accounting
principles 3.50 1.50 11.77 7.10
Cumulative effect of changes in accounting principles - - - (0.14)
Net income $ 3.50 1.50 11.77 6.96
Diluted
Continuing operations $ 3.51 1.43 11.57 6.70
Discontinued operations (0.07) 0.05 0.03 0.35
Before cumulative effect of changes in accounting
principles 3.44 1.48 11.60 7.05
Cumulative effect of changes in accounting principles - - - (0.14)
Net income $ 3.44 1.48 11.60 6.91
Average common shares outstanding (in thousands)
Basic 695,458 681,681 690,784 680,490
Diluted 706,334 688,516 700,650 685,433
*Includes excise taxes on petroleum products sales: $ 4,284 3,590 16,357 13,705
**Reclassified to conform to current year presentation.
1-1
2. ConocoPhillips
Houston, Texas 77079
Preliminary
SELECTED FINANCIAL DATA
Millions of Dollars
Three Months Ended Twelve Months Ended
December 31 December 31
2004 2003 2004 2003
INCOME/(LOSS) FROM CONTINUING OPERATIONS
E&P
United States $ 935 491 2,942 2,232
International 736 500 2,760 1,928
Total E&P 1,671 991 5,702 4,160
Midstream 100 43 235 130
R&M
United States 484 176 2,126 1,115
International 269 26 617 282
Total R&M 753 202 2,743 1,397
LUKOIL Investment 74 - 74 -
Chemicals 83 11 249 7
Emerging Businesses (24) (24) (102) (99)
Corporate and other (177) (238) (794) (1,002)
Consolidated $ 2,480 985 8,107 4,593
CUMULATIVE EFFECT OF CHANGES IN
ACCOUNTING PRINCIPLES
E&P
United States $ - - - 142
International - - - -
Total E&P - - - 142
Midstream - - - -
R&M
United States - - - (125)
International - - - -
Total R&M - - - (125)
LUKOIL Investment - - - -
Chemicals - - - -
Emerging Businesses - - - -
Corporate and other - - - (112)
Consolidated $ - - - (95)
INCOME/(LOSS) FROM DISCONTINUED OPERATIONS
Corporate and other (48) 36 22 237
SUMMARY OF NET INCOME/(LOSS)
E&P
United States $ 935 491 2,942 2,374
International 736 500 2,760 1,928
Total E&P 1,671 991 5,702 4,302
Midstream 100 43 235 130
R&M
United States 484 176 2,126 990
International 269 26 617 282
Total R&M 753 202 2,743 1,272
LUKOIL Investment 74 - 74 -
Chemicals 83 11 249 7
Emerging Businesses (24) (24) (102) (99)
Corporate and other (225) (202) (772) (877)
Net income $ 2,432 1,021 8,129 4,735
1-2
3. ConocoPhillips
Houston, Texas 77079
Preliminary
SELECTED FINANCIAL DATA
Three Months Ended Twelve Months Ended
December 31 December 31
2004 2003 2004 2003
INCOME FROM CONTINUING OPERATIONS
Effective tax rate % 42.0 % 41.3 43.6 44.9
Millions of Dollars
FOREIGN CURRENCY GAINS/(LOSSES)
AFTER-TAX
E&P $ (28) (22) (13) (50)
Midstream (1) - (1) -
R&M 11 14 12 18
LUKOIL Investment - - - -
Chemicals - - - -
Emerging Businesses - - - (1)
Corporate and other 23 46 44 67
$ 5 38 42 34
CASH FLOWS FROM OPERATING ACTIVITIES
Income from continuing operations $ 2,480 985 8,107 4,593
Depreciation, depletion and amortization 1,030 911 3,798 3,485
Property impairments 101 60 164 252
Dry hole costs and leasehold impairments 75 131 417 300
Accretion on discounted liabilities 45 38 171 145
Deferred income taxes 90 68 1,088 401
Undistributed equity earnings (236) 132 (777) (59)
Net (gain) loss on asset dispositions (34) 15 (116) (211)
Other (295) (202) (190) (328)
Net working capital changes (69) (114) (680) 589
Net cash provided by continuing operations 3,187 2,024 11,982 9,167
Net cash provided by (used in) discontinued
operations 10 8 (23) 189
Net cash provided by operating activities $ 3,197 2,032 11,959 9,356
CAPITAL EXPENDITURES AND INVESTMENTS
E&P
United States $ 368 358 1,314 1,418
International 1,184 862 3,935 3,090
1,552 1,220 5,249 4,508
Midstream 1 4 7 10
R&M 574 429 1,344 1,179
LUKOIL Investment 2,649 - 2,649 -
Chemicals - - - -
Emerging Businesses 1 60 75 284
Corporate and other* 60 71 172 188
$ 4,837 1,784 9,496 6,169
*Excludes discontinued operations
OTHER
At December 31, 2004 At December 31, 2003
Total debt $15,002 17,780
Common stockholders' equity $42,723 34,366
1-3
4. ConocoPhillips
Houston, Texas 77079
Preliminary
OPERATING HIGHLIGHTS
BY SEGMENT
Three Months Ended Twelve Months Ended
December 31 December 31
2004 2003 2004 2003
Thousands of Barrels Daily
E&P
Crude oil produced
United States
Alaska 313 318 298 325
Lower 48 50 50 51 54
363 368 349 379
Norway 211 205 207 213
United Kingdom 66 72 64 77
Canada 24 28 25 30
China 17 28 25 26
Indonesia 18 10 15 16
Vietnam 33 22 33 16
Timor Sea 34 3 21 3
Other 55 70 58 72
Total consolidated 821 806 797 832
Equity affiliates 103 116 108 102
Total Worldwide 924 922 905 934
Syncrude 20 18 21 19
Natural gas liquids produced
United States
Alaska* 24 24 23 23
Lower 48 26 27 26 25
50 51 49 48
Norway 9 8 8 7
Canada 11 10 10 10
Other 22 3 17 4
Total Worldwide 92 72 84 69
14 16 14 15
*Includes reinjected volumes sold lease-to-lease.
Millions of Cubic Feet Daily
Natural gas produced*
United States
Alaska 163 205 165 184
Lower 48 1,214 1,264 1,223 1,295
1,377 1,469 1,388 1,479
Norway 306 307 301 275
United Kingdom 852 954 818 940
Canada 442 431 433 435
Timor Sea 35 56 35 60
Indonesia 266 275 250 255
Vietnam 19 12 16 3
Other 59 77 71 63
3,356 3,581 3,312 3,510
Total consolidated
Equity affiliates 4 12 5 12
Total Worldwide 3,360 3,593 3,317 3,522
*Represents quantities available for sale. Excludes gas equivalent of NGL shown above.
Liquefied natural gas sales 107 140 105 121
LUKOIL Investment
Production (MB/D)* 150 - 38 -
Refinery Crude Oil Throughput* 77 - 19 -
*Represents our estimated net share of LUKOIL
1-4
5. ConocoPhillips
Houston, Texas 77079
Preliminary
OPERATING HIGHLIGHTS
Three Months Ended Twelve Months Ended
December 31 December 31
2004 2003 2004 2003
E&P
Per Unit
Average sales prices
Crude oil (per barrel)
United States
Alaska $ 44.37 28.51 38.47 28.87
Lower 48 42.30 28.02 36.95 28.76
Total U.S. 44.08 28.45 38.25 28.85
International 41.75 28.42 37.18 28.27
Total consolidated 42.79 28.43 37.65 28.54
Equity affiliates 26.55 18.14 24.18 19.01
Total Worldwide 40.96 27.27 36.06 27.52
Natural gas-lease (per MCF)
United States
Alaska 2.23 1.88 2.35 1.76
Lower 48 6.04 4.32 5.46 4.81
Total U.S. 5.92 4.18 5.33 4.67
International 4.63 3.87 4.14 3.69
Total consolidated 5.13 3.99 4.62 4.08
Equity affiliates 0.25 3.96 2.19 4.44
Total Worldwide 5.13 3.99 4.61 4.08
Midstream
Thousands of Barrels Daily
Natural gas liquids extracted
Consolidated
United States 23 54 32 52
International 49 50 45 45
Equity affiliates
United States* 113 110 111 111
International 7 6 6 7
192 220 194 215
*Represents 30.3 percent interest in Duke Energy Field Services LLC (DEFS).
Per Barrel
U.S. product prices
Weighted average NGL**
Consolidated $ 34.40 23.14 29.38 22.67
DEFS 33.69 22.76 28.60 22.12
**Prices are based on index prices from the Mont Belvieu and Conway market hubs that are weighted by natural-gas-liquids
component and location mix.
1-5
6. ConocoPhillips
Houston, Texas 77079
Preliminary
OPERATING HIGHLIGHTS
Three Months Ended Twelve Months Ended
December 31 December 31
2004 2003 2004 2003
Thousands of Barrels Daily
R&M
United States
Crude oil capacity 2,160 2,168 2,164 2,168
Crude oil runs 2,005 2,074 2,059 2,074
Refinery production 2,232 2,270 2,245 2,301
International*
Crude oil capacity 428 442 437 442
Crude oil runs 438 397 396 414
Refinery production 453 395 405 412
U.S. Petroleum products outside sales
Gasoline 1,415 1,365 1,356 1,369
Distillates 562 530 553 575
Aviation fuels 195 193 191 180
Other products 613 474 564 492
2,785 2,562 2,664 2,616
International 493 403 477 430
3,278 2,965 3,141 3,046
Per Gallon
U.S. Average sales prices**
Automotive gasoline-wholesale $ 1.40 1.00 1.33 1.05
Automotive gasoline-retail 1.62 1.25 1.52 1.35
Distillates-wholesale 1.41 0.92 1.24 0.92
*Includes ConocoPhillips' share of equity affiliates.
**Excludes excise taxes.
1-6