Al Mizhar Dubai Escorts +971561403006 Escorts Service In Al Mizhar
4 Ifej Media Workshop
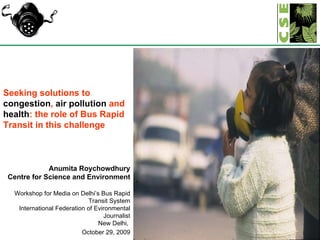
1. Seeking solutions to congestion , air pollution and health : the role of Bus Rapid Transit in this challenge Anumita Roychowdhury Centre for Science and Environment Workshop for Media on Delhi’s Bus Rapid Transit System International Federation of Evironmental Journalist New Delhi, October 29, 2009
2. Delhi is losing battle of car-bulge : The rapid increase in vehicles is destroying all gains of air pollution and health
3. 1996: Crisis of health; of answers This whipped up public anger
4. Delhi implemented first generation measures……… Vehicles Euro II and Euro III emissions standards Pre-mix 2T Oil One of the largest CNG programmes New PUC norms enforced 15 year old commercial vehicles phased out Bypassed transit traffic Diesel run auto rickshaw banned Scaling up bus transport, BRT and metro Industry Zoning policy for industry. Phased out polluting industry Installation of pollution control equipments in thermal power plants. New plants on natural gas Cleaner fuels for industrial boilers Other sources Hospital incineration Ban on open burning of biomass
5. CNG was our first leapfrog option Euro II diesel bus emits 46 times higher PM than Euro II CNG bus Source: Teri Natural gas vehicles sidestepped poor quality diesel It was a Clean fuel programme linked with augmentation of public transport
6. Disinformation campaign started Lobbies at work: bus manufacturers; bus owners; oil oil companies; diesel interests.. Had to distinguish between fact and fiction CNG vehicles emit more ultrafine particles CNG causes cancer CNG vehicles are unsafe CNG technology is experimental There is not enough gas to meet transport demand CNG buses are more expensive and will hurt the poor CNG experimental. Not done anywhere..
7. The verdict April 5, 2002 Give priority to transport - allocate 16.1 lakh kg of CNG per day Phase out 800 diesel buses every month. Diesel buses to pay a penalty per bus per day (Rs 30 crore collected in diesel tax to invest in public transport)
12. It took 37 years to reach the first million mark for personal vehicles (by 1988.) In another 14 years (by 2002) the city added 2 more millions In just 5 years (between 2002 and 2007) 1.55 millions more added Explosive numbers Source: Delhi transport data Daily In 5 years Delhi doubled the registration of vehicles Source: Estimated on the basis of Delhi Economic Survey, 2005-06
13. Road per vehicle decreased in 35 years Source: Delhi Economic Survey
14.
15. Cities are Paralyzed The Crawling Traffic Source: Anon 2008, Study on traffic and transportation policies and Strategies in Urban Areas in India, MOUD, p63 The average journey speed in Delhi (16 km/hr), Mumbai (16 km/hr) and Kolkata (18 km/hr): Abysmally poor compared to smaller cities
16. Speed plummets CRRI study on major arterial roads: -- During the morning and evening peak -- 55-60 per cent of the roads have travel speeds less than 30 kmph. -- Even during off-peak hours 40-45 per cent of the roads have travel speeds less than 30 kmph. -- About 20 per cent have travel speeds less than 20 kmph throughout the day. Source: City Development Plan
17. Peak volume traffic has increased phenomenally Nearly 123 per cent growth on many roads (in PCU/hour) Source: Based on City Development Plan of Delhi, 2006, Eco Smart
18. Choked….. Source: IL&FS 2004 cited in CDP Delhi Traffic volume exceeds designed capacity of key arterial roads NH8 (Delhi-Gurgaon) is designed for a peak traffic volume of 160,000 pcu by 2015. There are already 130,000 pcu fighting for space! Ring Road: 48 km; 6 carriageway; 1,60,000 PCU per day; Exceeds capacity of 75,000 vehicles/day Now projections: reach 4,00,000 by 2011 -- needs 24 lanes Do we have this space? Where? Congestion cause massive delays: Commuting population losing 2.5 hours each day 13617 10981 AIIMS to Dhaula Kuan 12493 10959 B. S Gurudwara to AIIMS 10726 8004 Dhaula Kuan to Raja Garden Actual Peak volume (PCU per hour) in 2002 Peak designed capacity (PCU per hour) Other road segments
19. Reality check Buses marginalised in Delhi Source: Anon 2008, transport demand forecast study: study and development of an integrated cum multi modal public transport network for NCT of Delhi, RITES, MVA Asia Ltd, TERI, September RITES: Modal share in Delhi
20.
21.
22. Bus moves people; but adds to chaos; fights for space with cars; no speed; no reliability; very poor service for poor.. marginalised but not replaced
23.
24.
25.
26. One lane being wasted due to inefficient utilisation of road space by bus Unused space equivalent to one lane Curbside lane generally not being used by motorised traffic Current paradigm is wasteful Source: TRIPS
27. Even cars don’t have space Only one lane available for other motorised traffic Almost two lanes choked by bus operations Source: TRIPS
31. We asked people on the corridor: Are you happy with dedicated lane system of BRT? Source: CSE survey We heard the voice of urban majority… 88% of bus commuters; 85% of pedestrians and cyclists, 45% of cars ad two-wheelers said a resounding YES
32.
33. Chirag Delhi Junction Morning Peak Hour (Ambedkar Nagar to Moolchad) 4,916 Vehicles 11,480 People Source: Dario Hidalgo and M Pai study for CSE, 2008 Mimeo You get different answers depending on your priorities – moving vehicles vs moving people Buses are 2% of all vehicles but carry 55% of people Cars and two-wheelers 75% of the vehicles but carry 33% of the people
34. Motor vehicle lane? Traffic volume doubles just in 5 years on this corridor… Press Enclave Junction during peak hours (Morning) Is this sustainable………. Source: TRIPS Year MV Bus NMT Total Traffic volume 2003 5430 272 854 6556 2008 10604 200 1476 12280
35.
36. Calculation based on Webster’s Delay Formula for Signalized Intersections One Leg Chirag Delhi Junction Morning Peak Hour Ambedkar Nagar to Moolchand 53.0 Vehicle-Hours 164.8 Person-Hours Source: Dario Hidalgo study for CSE, 2008 Mimeo
39. April 2008 to June 2009: Fatal accidents show a declining trend According to reports of Delhi Police, there were 8 fatalities during the first 10 months since the opening of the corridor. This drops significantly thereafter. There are still scope of improvement…… -- Ensure safe crossings (preferably at grade); -- Better management of the bus operations to reduce spill-over at the stations Impact on user safety
40.
41. If not BRT, what other options do you have? Other governments are proposing restraints on personal vehicles use.. But not possible without alternatives…… Other governments are enforcing tax and road pricing measures and caps on car sales to reduce congestion and pollution… Congestion charges: -- London: This has reduced traffic delays by 30 per cent. -- Seven European cities are adopting congestion charges. -- Trondheim, Norway: peak hour traffic dropped by 10% after the introduction of congestion charges. -- Singapore’s road pricing measures: This reduced percentage of commuters entering central areas from 56% to 23%. Caps on cars in Singapore and Shanghai: -- Shanghai has adopted a system of auctioning a limited number of car licenses per month. This has helped the city to cap car registration at not more than 7,500 cars per month -- or 250 cars per day. Such measures require good public transport system….. Different public transport systems will compliment each other: BRT is cheaper to build: Rs 10-20 crore/km. Metro carries more people: Rs 100-300 crore/km Delhi needs all this and fast…Very fast..
42.
43. Familiar sight? Taipei ~60km of BRT Creating more space for public transport Photos: Jason Chang, 2002
45. No other way ahead…. Public transport is the only way out of Delhi’s pollution and congestion nightmare… BRT is an evolving concept. Improve the operation of the corridor Pre-requisite infrastructure is in place. Improve reliability, comfort and safety of buses and the quality of bus services. Timely arrival of buses, low variability with good speeds and less intervals. Need shorter signal timing and better signal synchronization to ensure more people are move on the corridor and quickly. Dedicated facilities for different road users, including pedestrians and bicyclists, need to be preserved. Any compromise on their right of way will erode bus ridership and hurt the integrity of the corridor. Prevent motorised vehicles using the bicycle facilities Bus Rapid Transport is the public transport option. Needs support. Must not be allowed to fail.. Otherwise what???
APPROXIMATELY ONE LANE IS WASTED DUE TO INEFFICIENT UTILISATION OF ROAD SPACE
ALMOST TWO LANES CHOKED BY BUS OPERATIONS
ONLY ONE LANE BEING USED BY CARS
ONLY ONE LANE BEING USED BY CARS
Taipei has developed a bus lane network of 57 km since March 1998 (at an average cost of US$500,000 per kilometre), in the context of a wider policy framework emphasising: A network of dedicated bus lanes; High quality transfer environments; Green buses; Intelligent Transport System (ITS) applications, including innovative passenger information systems; Transit-oriented development. Taipei has pursued a number of innovative solutions to finding lane spaces for buses.