Used Car Merchandising Infographic
•
4 likes•1,570 views

GREAT Information from AutoTrader.com
Recommended

Recommended
More Related Content
Viewers also liked
Viewers also liked (20)
Similar to Used Car Merchandising Infographic
Similar to Used Car Merchandising Infographic (20)
Recently uploaded
Recently uploaded (20)
Used Car Merchandising Infographic
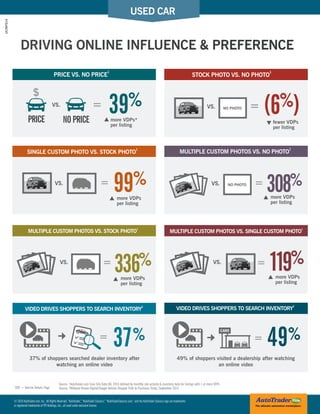
- 1. DRIVING ONLINE INFLUENCE & PREFERENCE USED CAR UCINFO14 MULTIPLE CUSTOM PHOTOS VS. NO PHOTO 1 NO PHOTOVS. 308%= STOCK PHOTO VS. NO PHOTO 1 NO PHOTOVS. = SINGLE CUSTOM PHOTO VS. STOCK PHOTO 1 VS. 99%= MULTIPLE CUSTOM PHOTOS VS. STOCK PHOTO 1 VS. = 336% * VDP = Vehicle Details Page Source: 1 AutoTrader.com Core Site Data Q4, 2013 defined by monthly site activity & inventory data for listings with 1 or more VDPs Source: 2 Millward Brown Digital/Google Vehicle Shopper Path to Purchase Study, September 2013 © 2014 AutoTrader.com, Inc., All Rights Reserved. “AutoTrader,” “AutoTrader Classics,” “AutoTraderClassics.com,” and the AutoTrader Classics logo are trademarks or registered trademarks of TPI Holdings, Inc., all used under exclusive license. MULTIPLE CUSTOM PHOTOS VS. SINGLE CUSTOM PHOTO 1 VS. 119%= PRICE VS. NO PRICE 1 PRICE NOPRICE VS. more VDPs* per listing 39%= more VDPs per listing more VDPs per listing more VDPs per listing more VDPs per listing fewer VDPs per listing (6%) VIDEO DRIVES SHOPPERS TO SEARCH INVENTORY 2 37% 37% of shoppers searched dealer inventory after watching an online video == 49% 49% of shoppers visited a dealership after watching an online video VIDEO DRIVES SHOPPERS TO SEARCH INVENTORY 2